| Param | Original file | Final file |
|---|---|---|
| Filename | modeM0/AS1T03_206T01_9000003672_25086cztM0_level2.evt | modeM0/AS1T03_206T01_9000003672_25086cztM0_level2_quad_clean.evt |
| Size (bytes) | 739,154,880 | 76,682,880 |
| Size | 704.9 MB | 73.1 MB |
| Events in quadrant A | 3,225,035 | 506,339 |
| Events in quadrant B | 3,494,344 | 519,747 |
| Events in quadrant C | 10,711,150 | 417,607 |
| Events in quadrant D | 4,527,539 | 436,259 |
| Mode M9 | |||
|---|---|---|---|
| Quadrant | BADHDUFLAG | Total packets | Discarded packets |
| A | 0 | 22 | 0 |
| B | 0 | 23 | 0 |
| C | 0 | 23 | 0 |
| D | 0 | 23 | 0 |
| Mode SS | |||
|---|---|---|---|
| Quadrant | BADHDUFLAG | Total packets | Discarded packets |
| A | 0 | 128 | 64 |
| B | 0 | 128 | 64 |
| C | 0 | 128 | 64 |
| D | 0 | 128 | 64 |
| Mode M0 | |||
|---|---|---|---|
| Quadrant | BADHDUFLAG | Total packets | Discarded packets |
| A | 0 | 13285 | 0 |
| B | 0 | 14091 | 0 |
| C | 0 | 36171 | 0 |
| D | 0 | 17595 | 0 |
| Quadrant | Total seconds | Saturated seconds | Saturation percentage |
|---|---|---|---|
| A | 6325 | 32 | 0.505929% |
| B | 6325 | 129 | 2.039526% |
| C | 6325 | 2621 | 41.438735% |
| D | 6325 | 481 | 7.604743% |
Noise dominated data is calculated using 1-second bins in cleaned event files. If a bin has >2000 counts, and if more than 50% of those come from <1% of pixels, then it is considered to be noise-dominated and hence unusable.
| Quadrant | # 1 sec bins | Bins with >0 counts | Bins with >2000 counts | High rate bins dominated by noise | Noise dominated (total time) | Noise dominated (detector-on time) | Marked lightcurve |
|---|---|---|---|---|---|---|---|
| A | 7625 | 6327 | 0 | 0 | 0.00% | 0.00% | 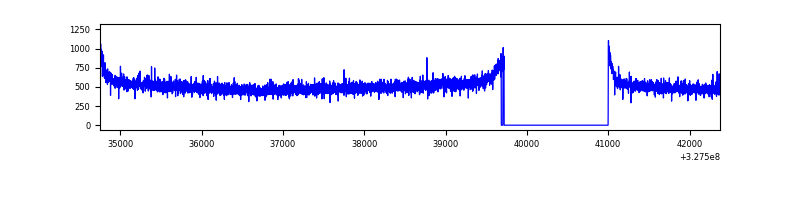 |
| B | 7625 | 6327 | 47 | 47 | 0.62% | 0.74% | 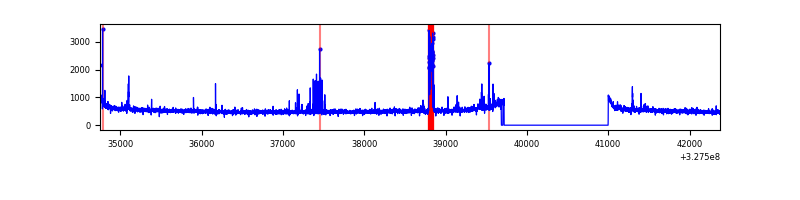 |
| C | 7625 | 6326 | 1996 | 1996 | 26.18% | 31.55% | 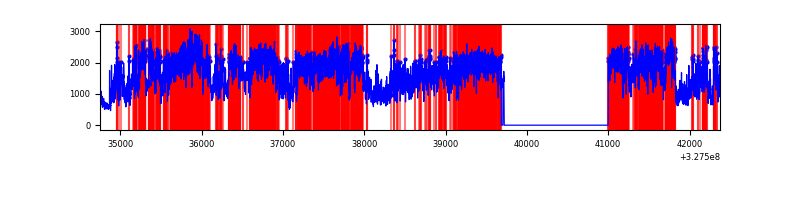 |
| D | 7625 | 6325 | 163 | 163 | 2.14% | 2.58% | 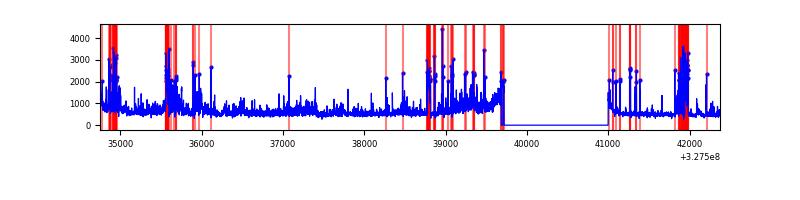 |
Top three noisy pixels from each quadrant. If the there are fewer than three noisy pixels in the level2.evt file, extra rows are filled as -1
| Pixel properties | Quadrant properties | ||||||
|---|---|---|---|---|---|---|---|
| Quadrant | DetID | PixID | Counts | Sigma | Mean | Median | Sigma |
| A | 13 | 254 | 11455 | 63.82 | 833 | 817 | 166.7 |
| A | 0 | 226 | 7251 | 38.6 | 833 | 817 | 166.7 |
| A | 3 | 137 | 7063 | 37.47 | 833 | 817 | 166.7 |
| B | 15 | 32 | 117292 | 736.53 | 835 | 816 | 158.1 |
| B | 4 | 80 | 30830 | 189.79 | 835 | 816 | 158.1 |
| B | 0 | 229 | 30280 | 186.31 | 835 | 816 | 158.1 |
| C | 7 | 247 | 7725010 | 45544.1 | 729 | 737 | 169.6 |
| C | 14 | 238 | 113851 | 666.95 | 729 | 737 | 169.6 |
| C | 7 | 226 | 20051 | 113.88 | 729 | 737 | 169.6 |
| D | 1 | 52 | 897089 | 4916.67 | 750 | 730 | 182.3 |
| D | 8 | 195 | 401129 | 2196.25 | 750 | 730 | 182.3 |
| D | 12 | 233 | 133712 | 729.43 | 750 | 730 | 182.3 |
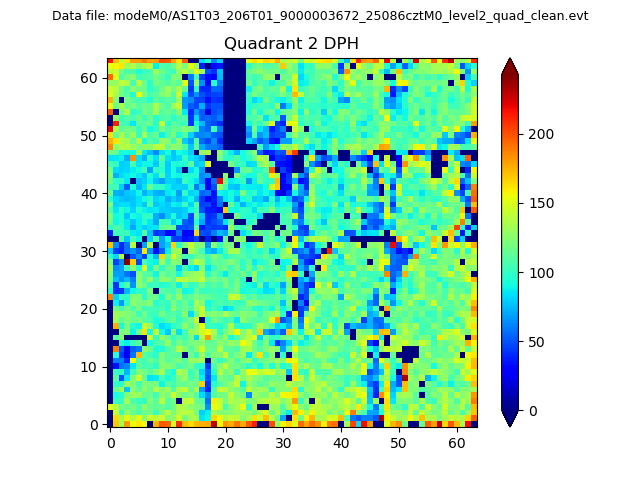
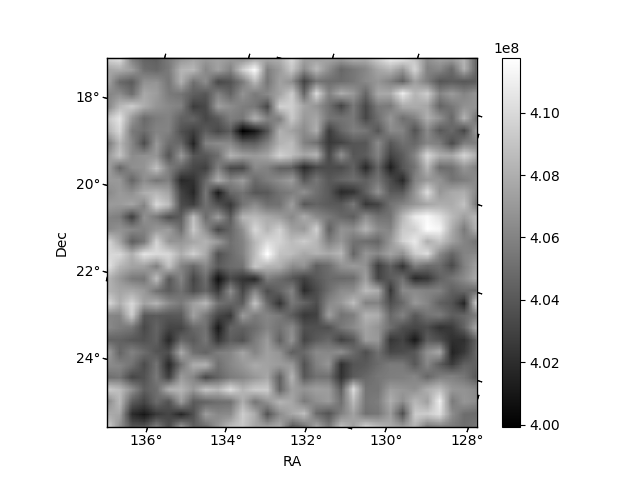
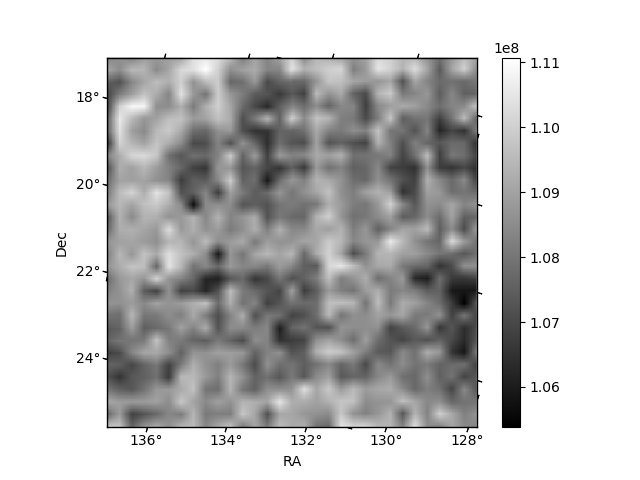
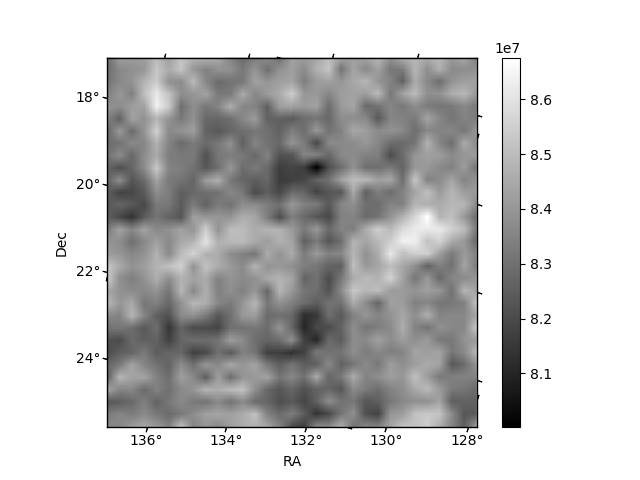
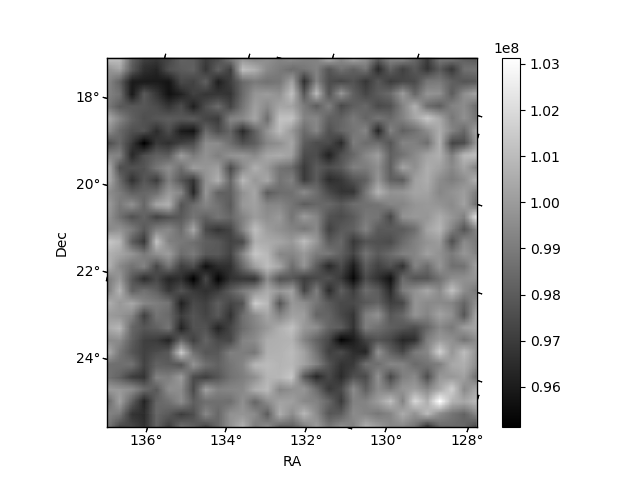
Histogram calculated using DETX and DETY for each event in the final _common_clean file
| Quadrant A | 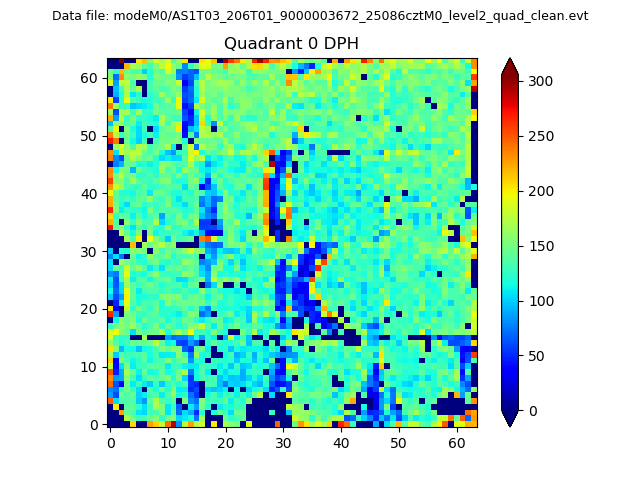 |
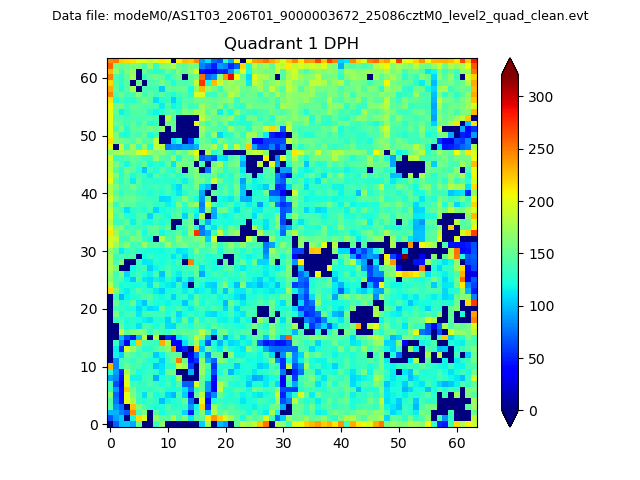 |
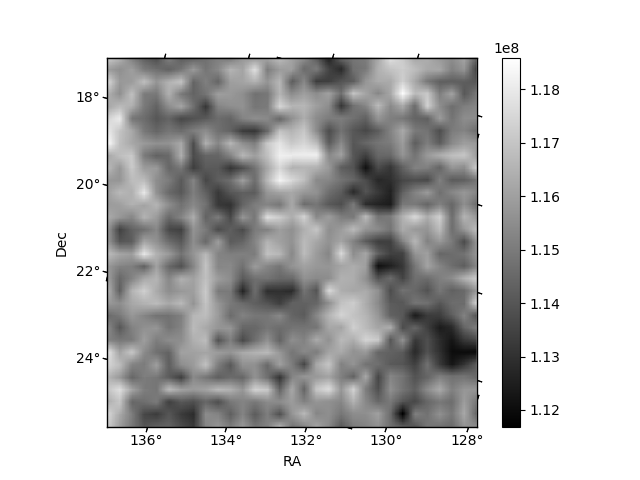
Quadrant B |
|---|---|---|---|
| Quadrant D | 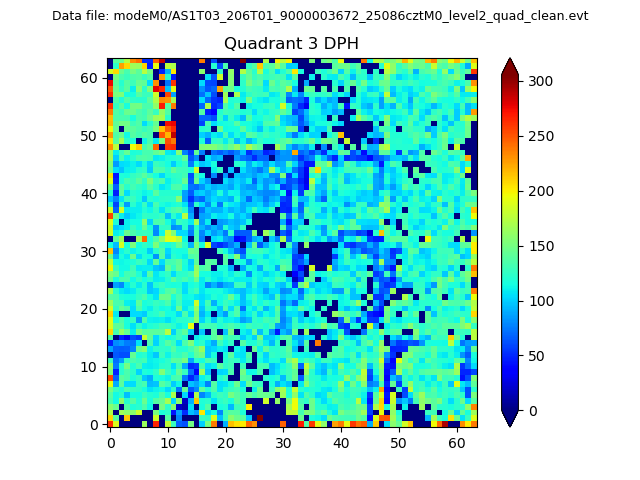 |
 |
Quadrant C |
| Plot type | Count rate plots | Images |
|---|---|---|
| Comparison with Poisson distribution Blue bars denote a histogram of data divided into 1 sec bins. Red curve is a Poisson curve with rate = median count rate of data. |
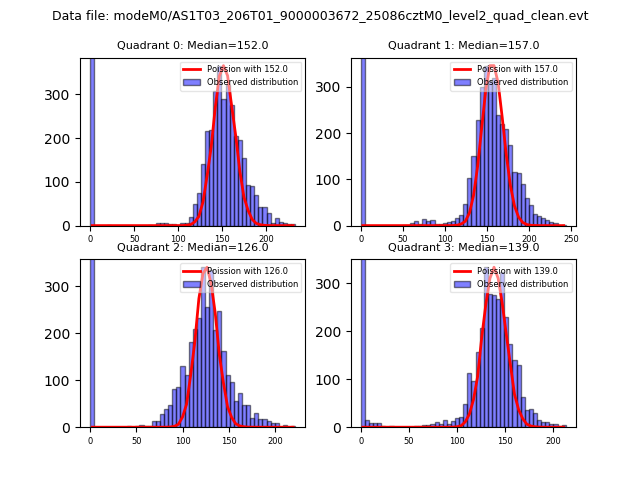 |
 |
| Quadrant-wise count rates Data is divided into 100 sec bins |
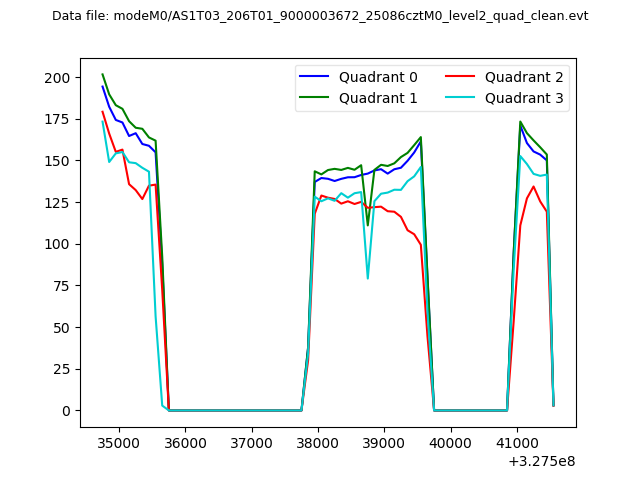 |
|
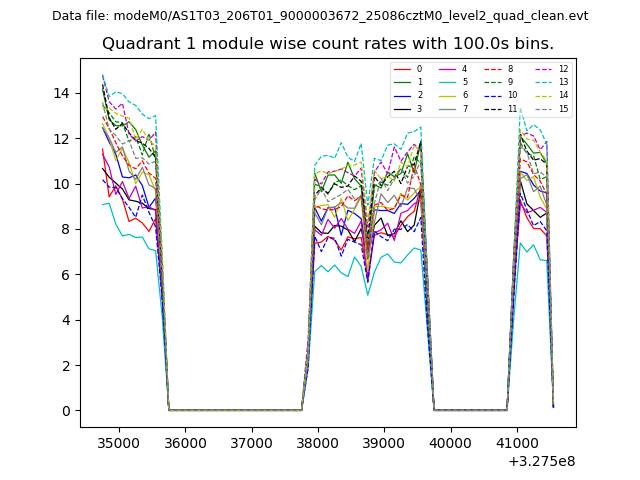
| Module-wise count rates for Quadrant A Data is divided into 100 sec bins |
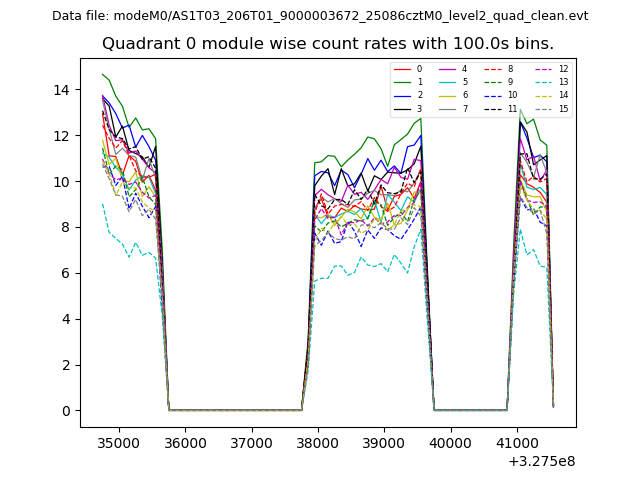 |
 |
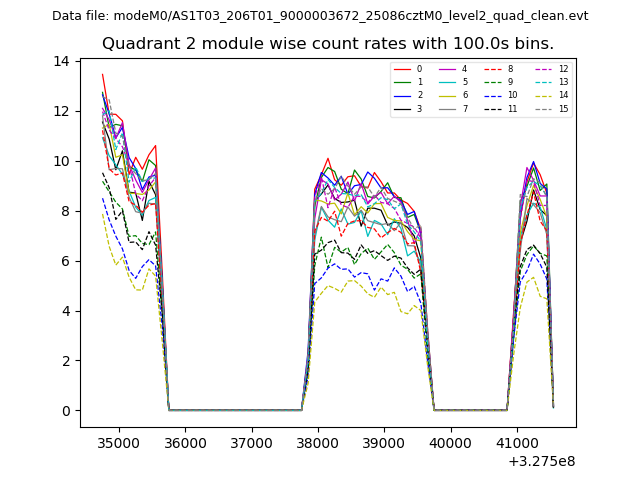
| Module-wise count rates for Quadrant B Data is divided into 100 sec bins |
 |
 |
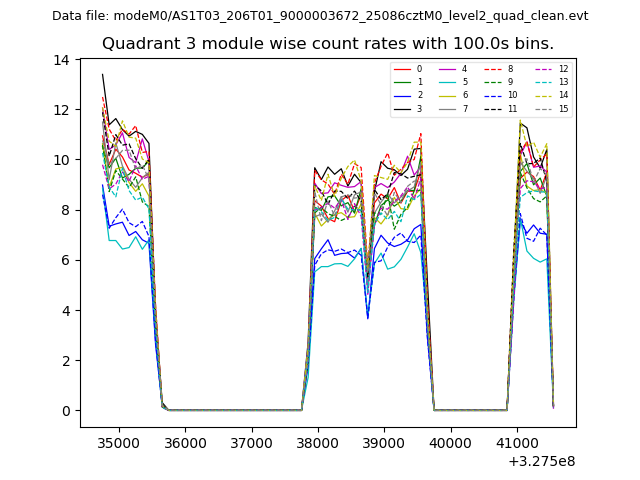
| Module-wise count rates for Quadrant C Data is divided into 100 sec bins |
 |
 |
| Module-wise count rates for Quadrant D Data is divided into 100 sec bins |
 |
 |
| Parameter | Plot |
|---|---|
| CZT HV Monitor | 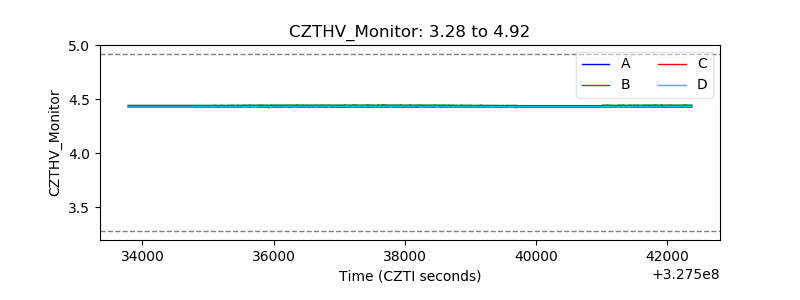 |
| D_VDD | 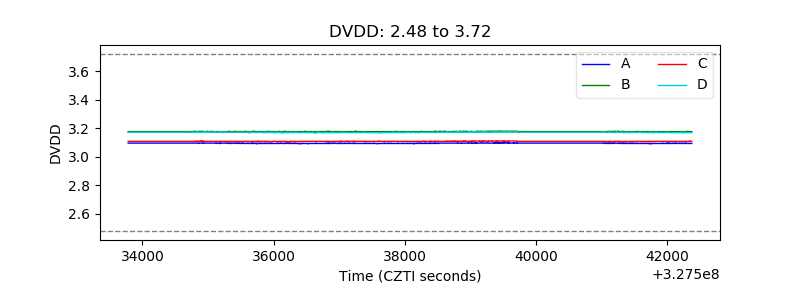 |
| Temperature 1 | 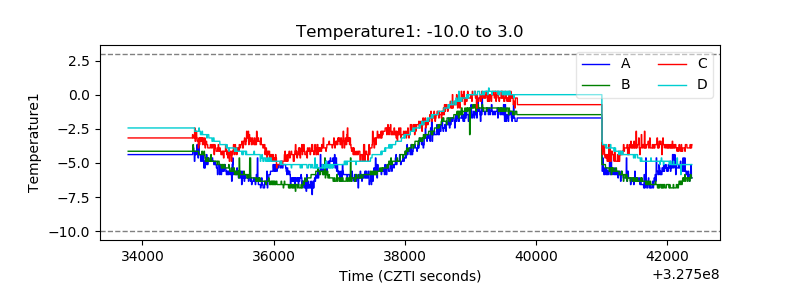 |
| Veto HV Monitor | 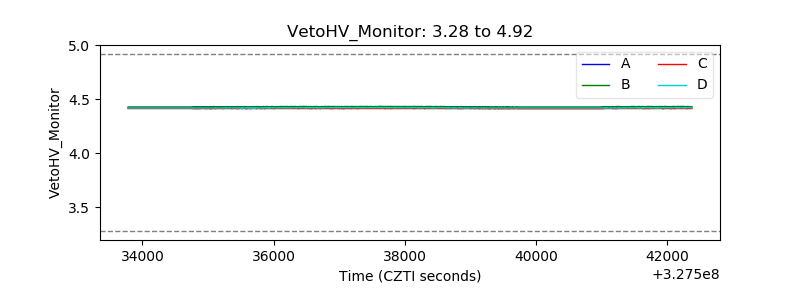 |
| Veto LLD | 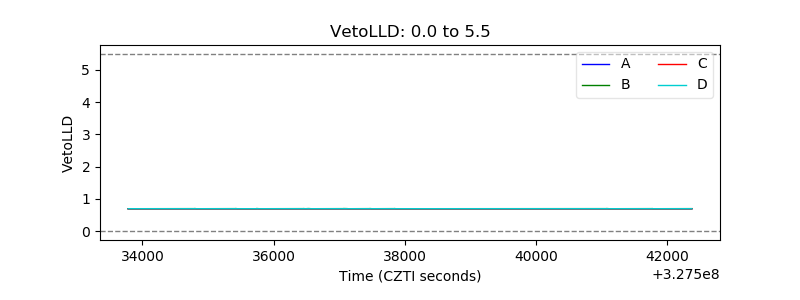 |
| Alpha Counter | 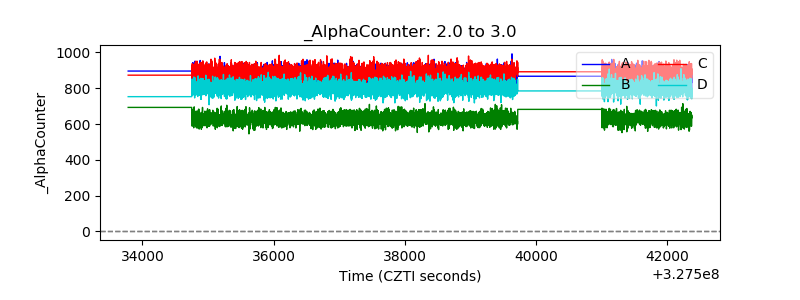 |
| _CPM_Rate | 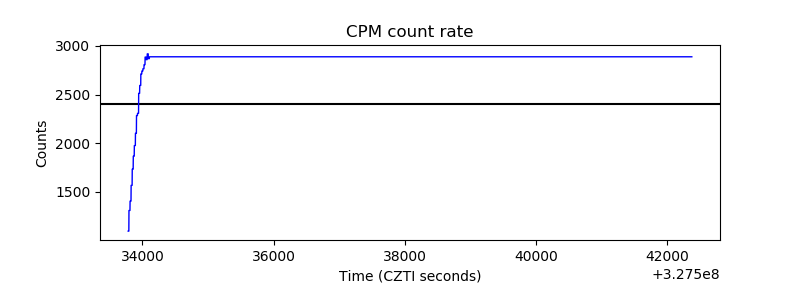 |
| CZT Counter | 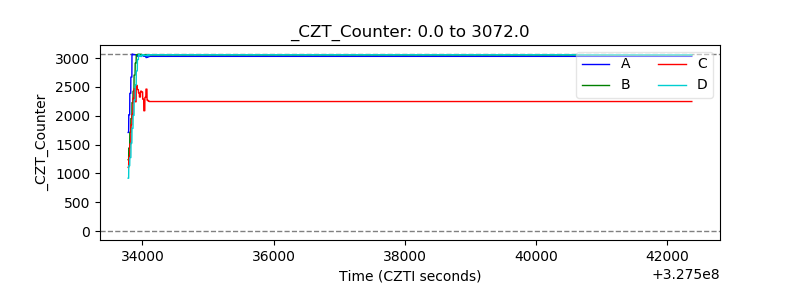 |
| +2.5 Volts monitor | 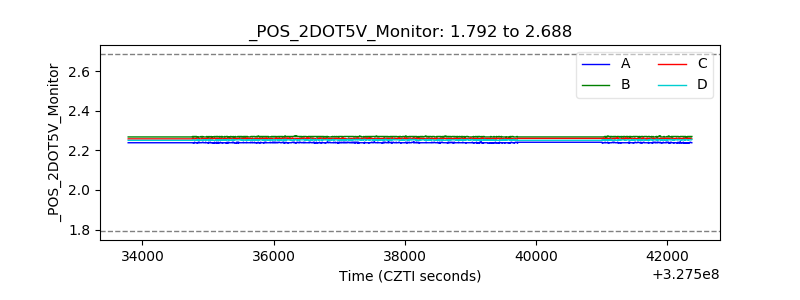 |
| +5 Volts monitor |  |
| _ROLL_ROT | 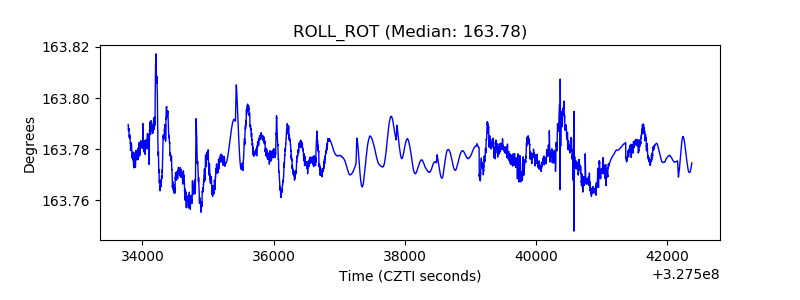 |
| _Roll_DEC | 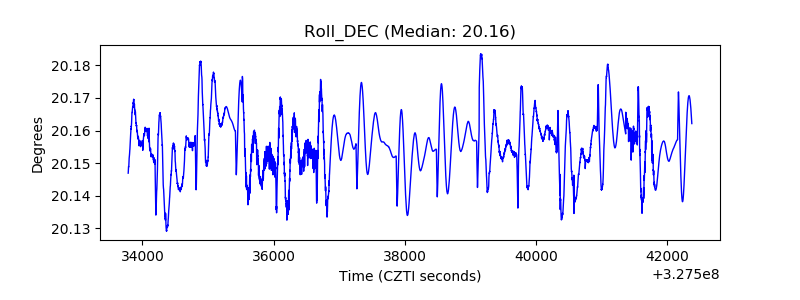 |
| _Roll_RA | 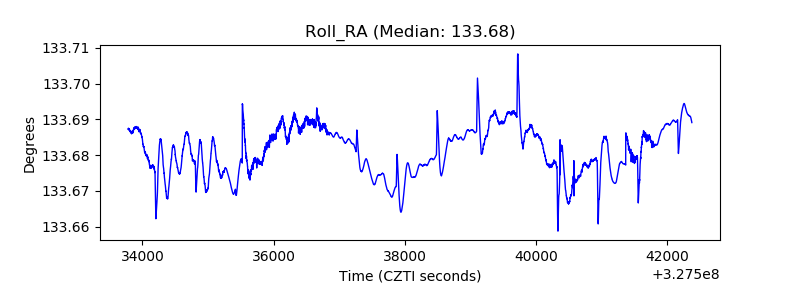 |
| Veto Counter | 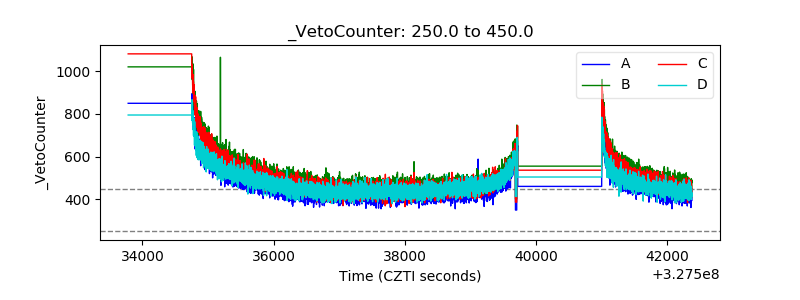 |