Observation information
- date-obs: 2020-05-19
- time-obs: 02:54:41.375500000
- date-end: 2020-05-19
- time-end: 05:12:39.371600000
- obs_id: T03_206T01_9000003672
- exposure: 3569.0062713
- sourceid: OJ 287
- observer: agarwal.a
- ra_pnt: 133.7036
- dec_pnt: 20.10851
Basic statistics of files
| Param |
Original file |
Final file |
|---|
| Filename | modeM0/AS1T03_206T01_9000003672_25089cztM0_level2.evt
| modeM0/AS1T03_206T01_9000003672_25089cztM0_level2_quad_clean.evt
|
| Size (bytes) | 794,456,640 | 76,072,320 |
| Size | 757.7 MB
| 72.5 MB
|
| Events in quadrant A | 4,000,048 | 465,305 |
| Events in quadrant B | 4,222,867 | 468,161 |
| Events in quadrant C | 10,266,014 | 409,405 |
| Events in quadrant D | 5,063,627 | 437,450 |
Level1 data integrity
| Mode M9 |
|---|
| Quadrant | BADHDUFLAG | Total packets | Discarded packets |
|---|
| A | 0 | 7 | 0 |
| B | 0 | 8 | 0 |
| C | 0 | 8 | 0 |
| D | 0 | 8 | 0 |
| Mode SS |
|---|
| Quadrant | BADHDUFLAG | Total packets | Discarded packets |
|---|
| A | 0 | 77 | 0 |
| B | 0 | 77 | 0 |
| C | 0 | 77 | 0 |
| D | 0 | 77 | 0 |
| Mode 2c |
|---|
| Quadrant | BADHDUFLAG | Total packets | Discarded packets |
|---|
| A | 0 | 140139358538632 | 46 |
| B | 0 | -1 | -1 |
| C | 0 | -1 | -1 |
| D | 0 | -1 | -1 |
| Mode M0 |
|---|
| Quadrant | BADHDUFLAG | Total packets | Discarded packets |
|---|
| A | 0 | 16497 | 0 |
| B | 0 | 17209 | 0 |
| C | 0 | 35705 | 0 |
| D | 0 | 20015 | 0 |
Data saturation
| Quadrant | Total seconds | Saturated seconds | Saturation percentage |
|---|
| A | 7513 | 366 | 4.871556% |
| B | 7513 | 381 | 5.071210% |
| C | 7513 | 2333 | 31.052842% |
| D | 7513 | 232 | 3.087981% |
Noise dominated fraction
Noise dominated data is calculated using 1-second bins in cleaned event files. If a bin has >2000 counts, and if more than 50% of those come from <1% of pixels, then it is considered to be noise-dominated and hence unusable.
| Quadrant |
# 1 sec bins |
Bins with >0 counts |
Bins with >2000 counts |
High rate bins dominated by noise |
Noise dominated (total time) |
Noise dominated (detector-on time) |
Marked lightcurve |
|---|
| A | 7713 | 7514 | 88 | 88 | 1.14% | 1.17% | 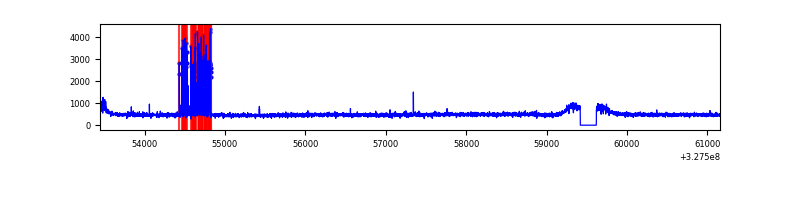 |
|---|
| B | 7713 | 7513 | 70 | 70 | 0.91% | 0.93% | 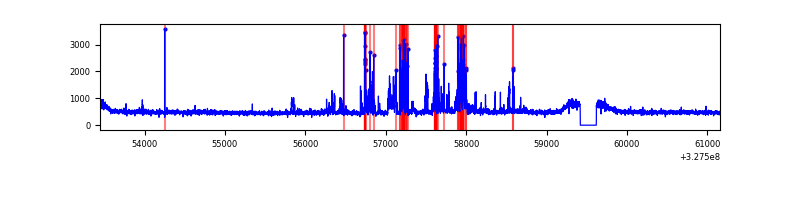 |
|---|
| C | 7713 | 7513 | 1374 | 1374 | 17.81% | 18.29% | 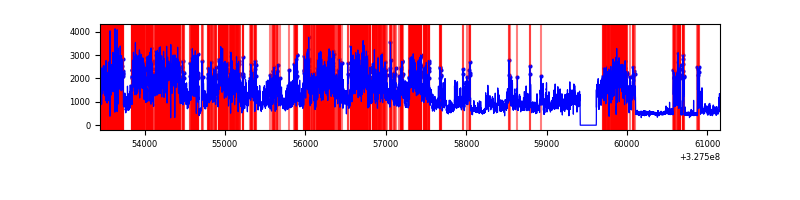 |
|---|
| D | 7713 | 7513 | 47 | 47 | 0.61% | 0.63% | 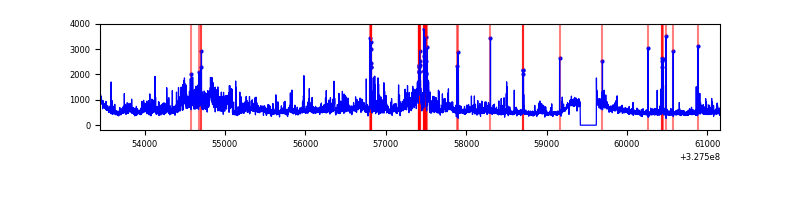 |
|---|
Top noisy pixels
Top three noisy pixels from each quadrant. If the there are fewer than three noisy pixels in the level2.evt file, extra rows are filled as -1
| Pixel properties |
Quadrant properties |
|---|
| Quadrant |
DetID |
PixID |
Counts |
Sigma |
Mean |
Median |
Sigma |
|---|
| A | 6 | 16 | 332347 | 1744.06 | 934 | 913 | 190.0 |
|---|
| A | 10 | 17 | 65717 | 341.01 | 934 | 913 | 190.0 |
|---|
| A | 13 | 254 | 12586 | 61.43 | 934 | 913 | 190.0 |
|---|
| B | 3 | 64 | 512086 | 2806.66 | 934 | 909 | 182.1 |
|---|
| B | 0 | 190 | 22554 | 118.84 | 934 | 909 | 182.1 |
|---|
| B | 12 | 111 | 22324 | 117.58 | 934 | 909 | 182.1 |
|---|
| C | 7 | 247 | 6893905 | 35630.78 | 822 | 824 | 193.5 |
|---|
| C | 14 | 238 | 126964 | 652.03 | 822 | 824 | 193.5 |
|---|
| C | 0 | 207 | 18455 | 91.14 | 822 | 824 | 193.5 |
|---|
| D | 8 | 195 | 673386 | 3039.83 | 909 | 879 | 221.2 |
|---|
| D | 1 | 52 | 560542 | 2529.76 | 909 | 879 | 221.2 |
|---|
| D | 2 | 244 | 133936 | 601.44 | 909 | 879 | 221.2 |
|---|
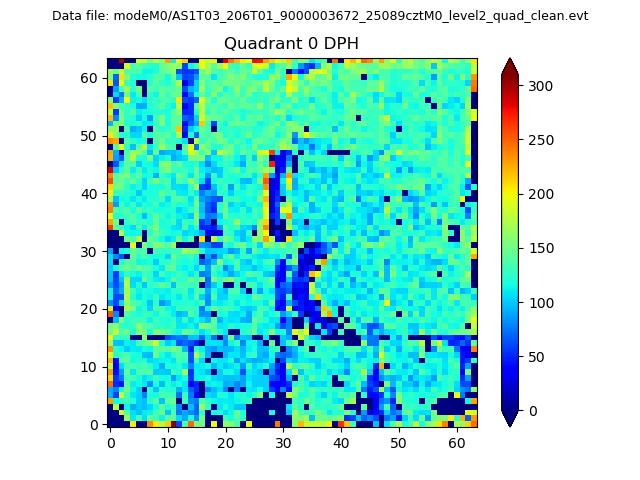
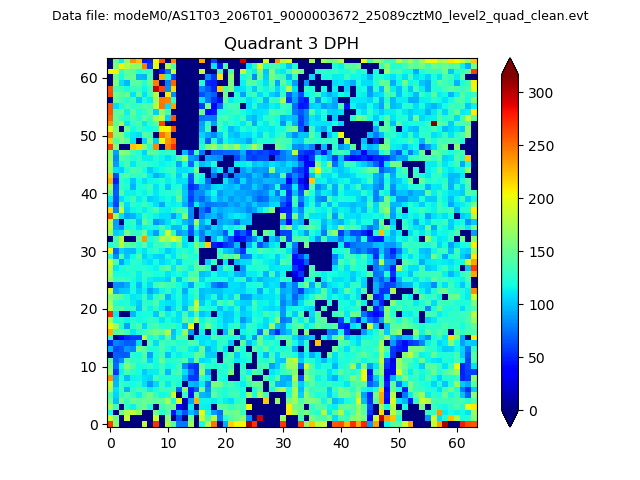
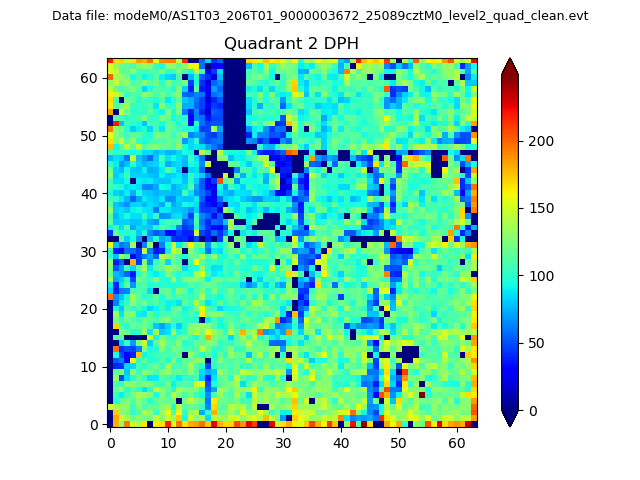
Detector plane histogram (DPH)
Histogram calculated using DETX and DETY for each event in the final _common_clean file
| Quadrant A |
 |
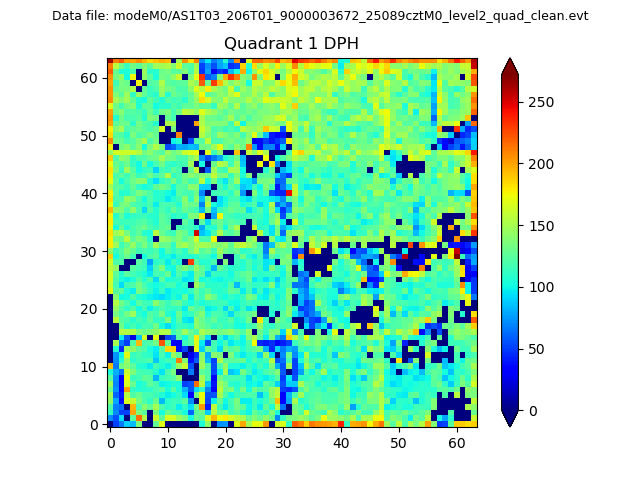 |
Quadrant B |
|---|
| Quadrant D |
 |
 |
Quadrant C |
|---|
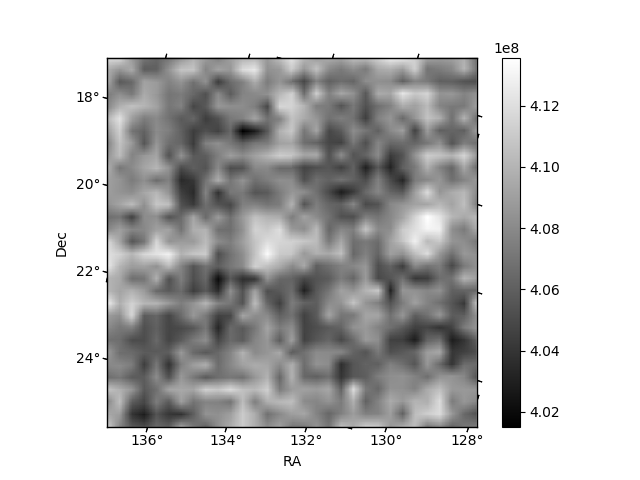
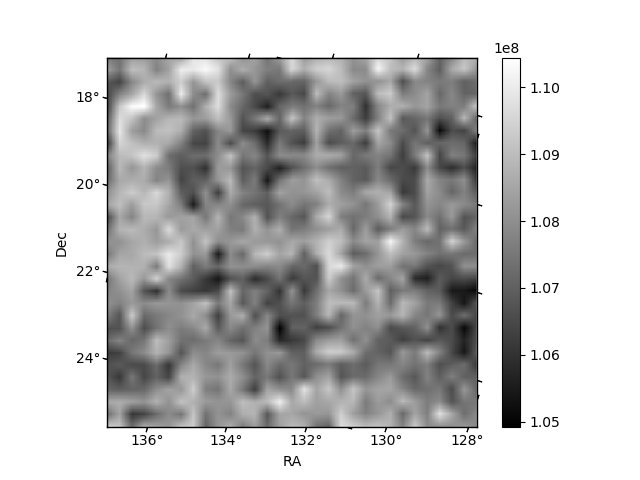
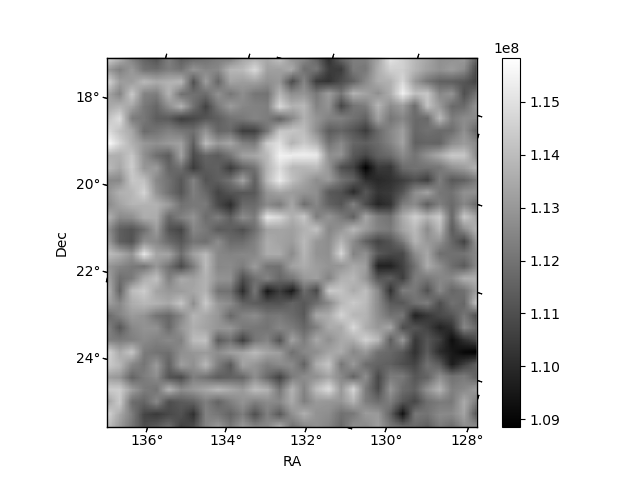
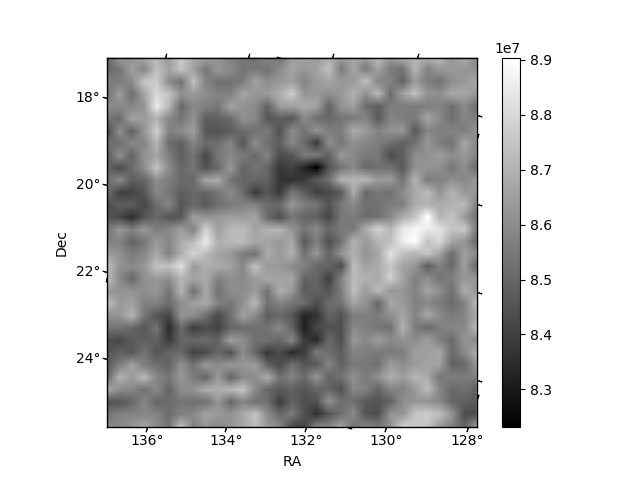
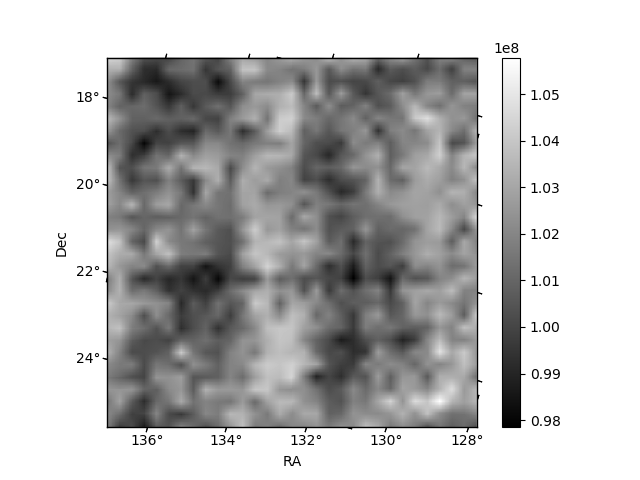
Count rate plots and images
| Plot type |
Count rate plots |
Images |
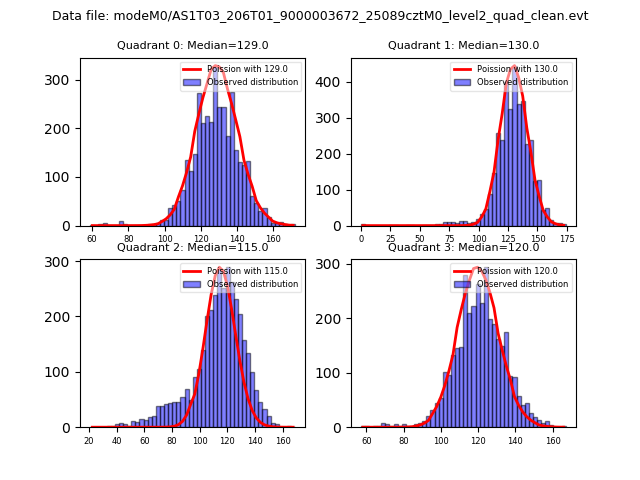
Comparison with Poisson distribution
Blue bars denote a histogram of data divided into 1 sec bins.
Red curve is a Poisson curve with rate = median count rate of data. |
 |
 |
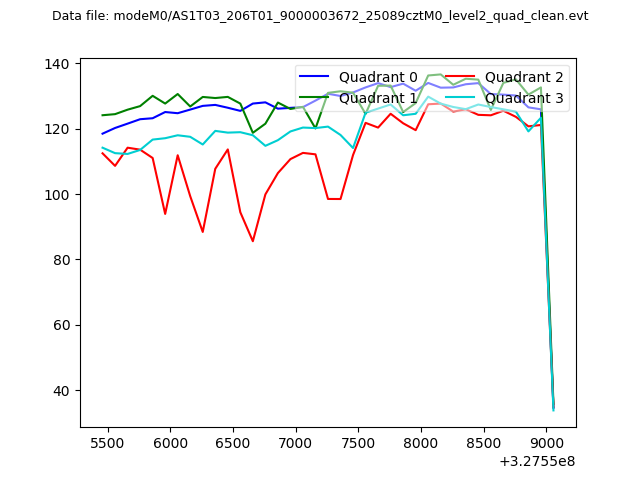
Quadrant-wise count rates
Data is divided into 100 sec bins |
 |
|
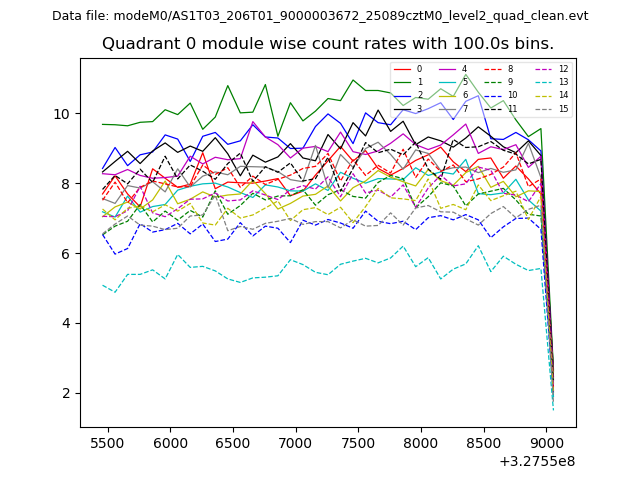
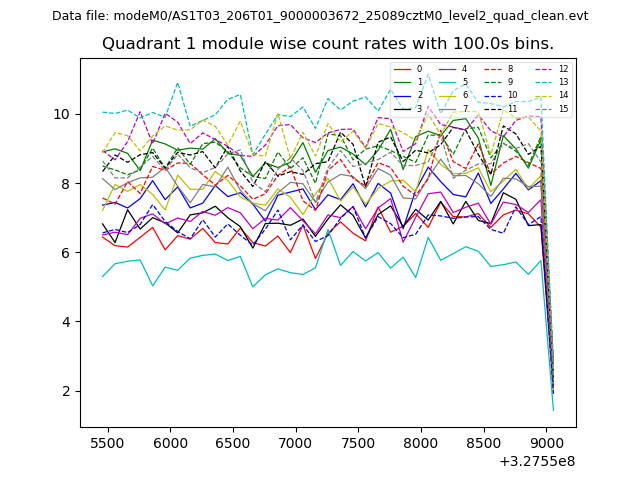
Module-wise count rates for Quadrant A
Data is divided into 100 sec bins |
 |
 |
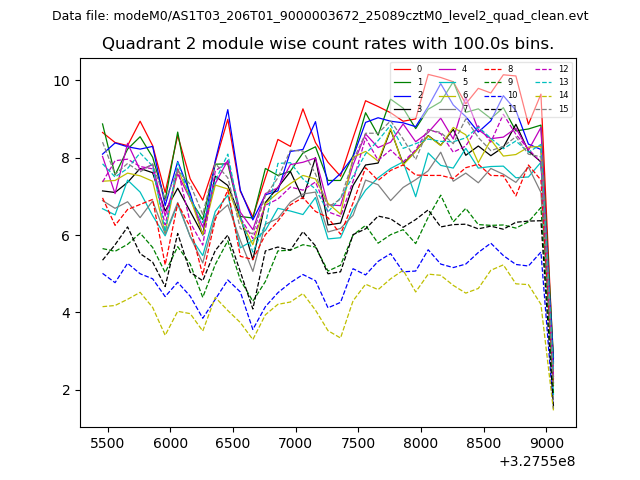
Module-wise count rates for Quadrant B
Data is divided into 100 sec bins |
 |
 |
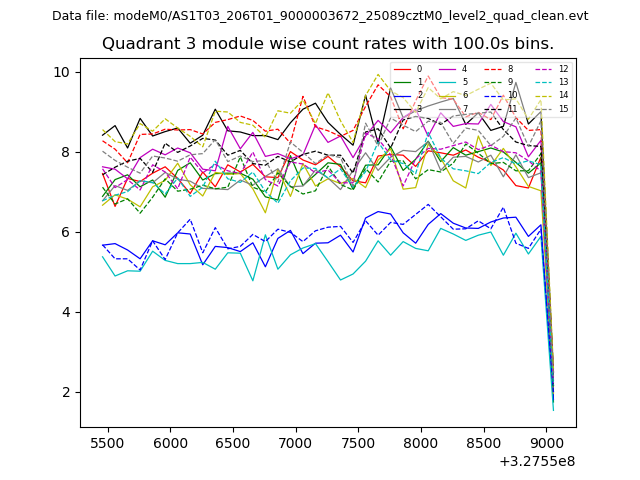
Module-wise count rates for Quadrant C
Data is divided into 100 sec bins |
 |
 |
Module-wise count rates for Quadrant D
Data is divided into 100 sec bins |
 |
 |
Housekeeping plots
| Parameter |
Plot |
| CZT HV Monitor | 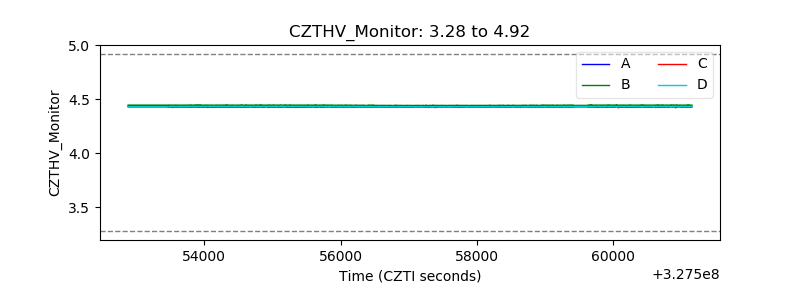 |
|---|
| D_VDD | 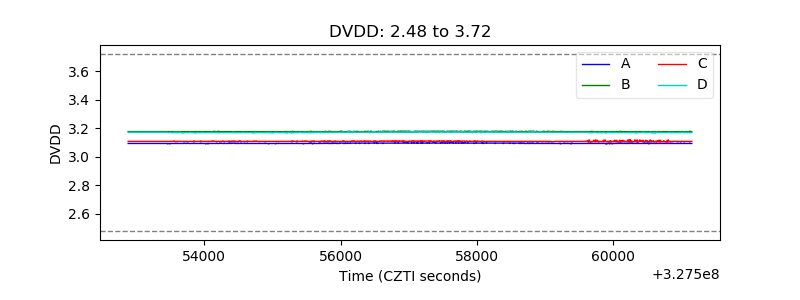 |
|---|
| Temperature 1 | 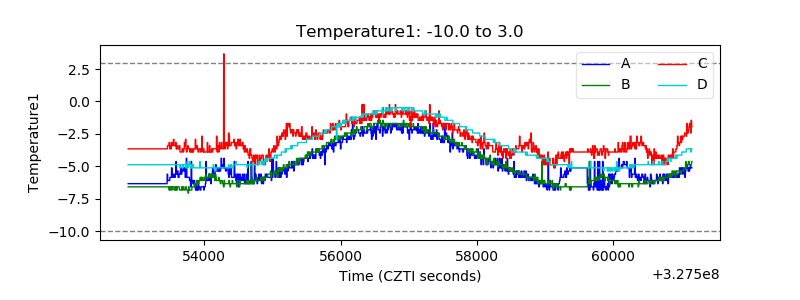 |
|---|
| Veto HV Monitor | 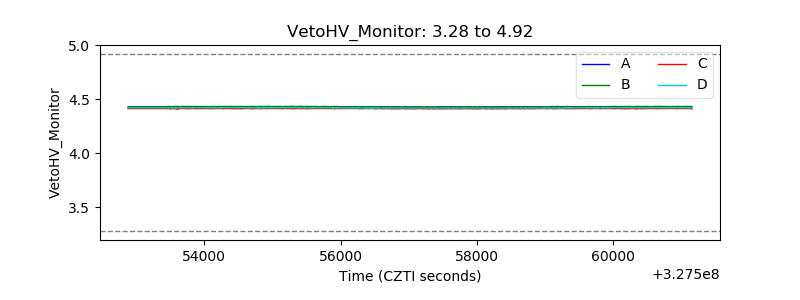 |
|---|
| Veto LLD | 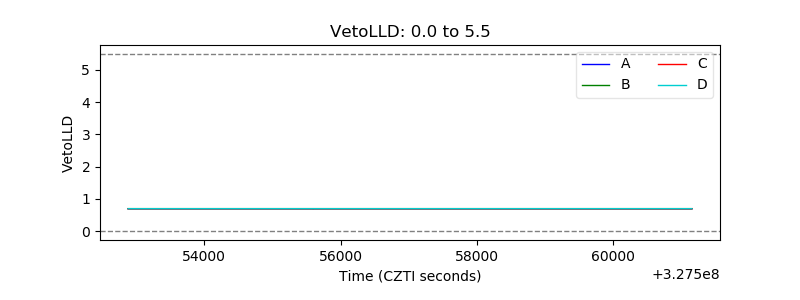 |
|---|
| Alpha Counter | 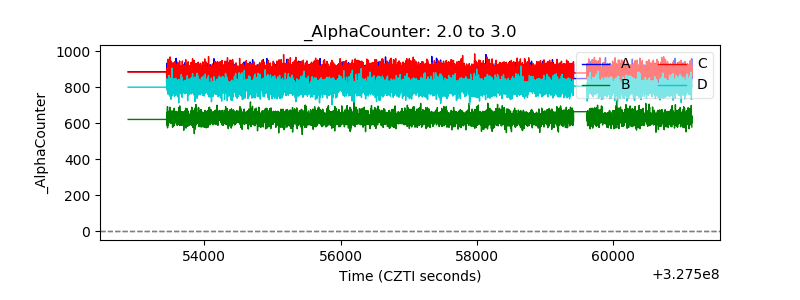 |
|---|
| _CPM_Rate | 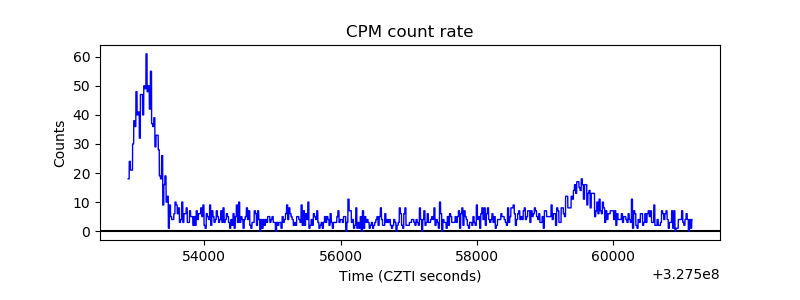 |
|---|
| CZT Counter | 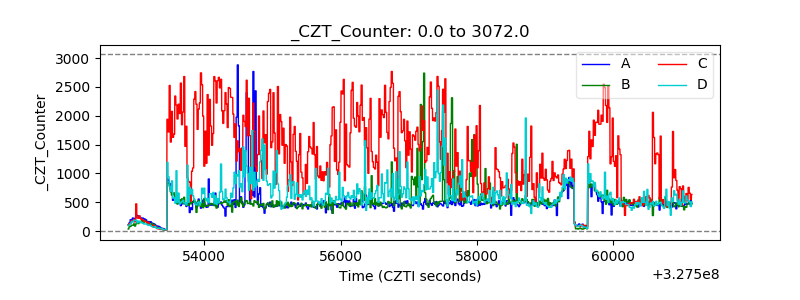 |
|---|
| +2.5 Volts monitor |  |
|---|
| +5 Volts monitor |  |
|---|
| _ROLL_ROT | 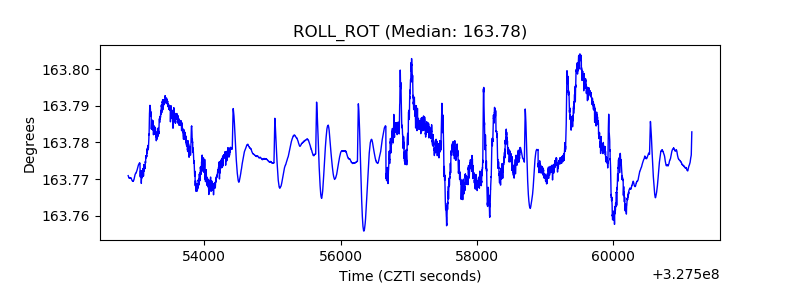 |
|---|
| _Roll_DEC | 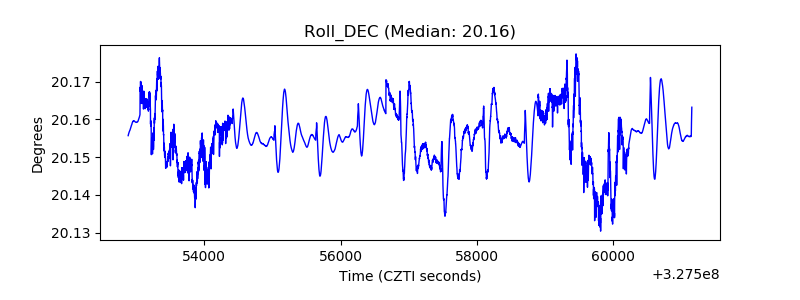 |
|---|
| _Roll_RA | 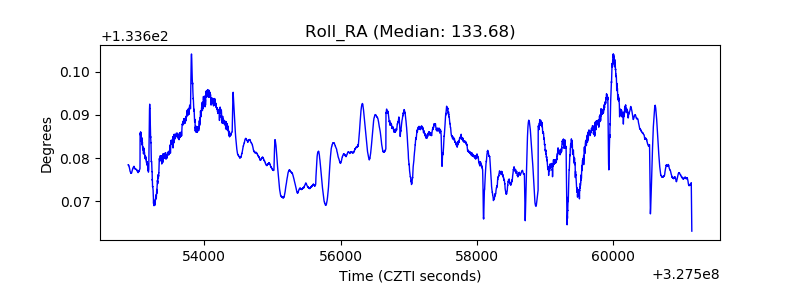 |
|---|
| Veto Counter | 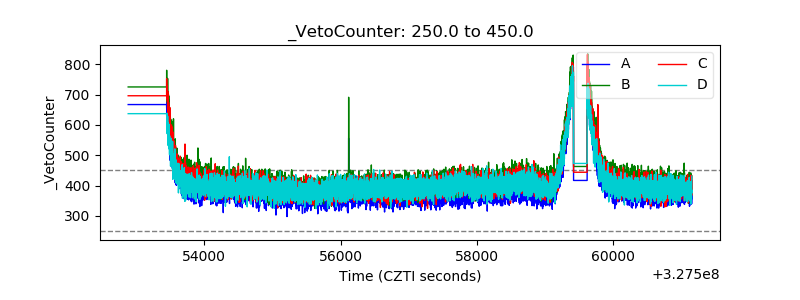 |
|---|