| Param | Original file | Final file |
|---|---|---|
| Filename | modeM0/AS1T03_206T01_9000003672_25090cztM0_level2.evt | modeM0/AS1T03_206T01_9000003672_25090cztM0_level2_quad_clean.evt |
| Size (bytes) | 795,119,040 | 80,844,480 |
| Size | 758.3 MB | 77.1 MB |
| Events in quadrant A | 3,723,404 | 509,287 |
| Events in quadrant B | 3,682,871 | 519,398 |
| Events in quadrant C | 10,470,566 | 417,136 |
| Events in quadrant D | 5,689,187 | 472,502 |
| Mode M9 | |||
|---|---|---|---|
| Quadrant | BADHDUFLAG | Total packets | Discarded packets |
| A | 0 | 2 | 0 |
| B | 0 | 2 | 0 |
| C | 0 | 2 | 0 |
| D | 0 | 2 | 0 |
| Mode SS | |||
|---|---|---|---|
| Quadrant | BADHDUFLAG | Total packets | Discarded packets |
| A | 0 | 154 | 77 |
| B | 0 | 154 | 77 |
| C | 0 | 154 | 77 |
| D | 0 | 154 | 77 |
| Mode M0 | |||
|---|---|---|---|
| Quadrant | BADHDUFLAG | Total packets | Discarded packets |
| A | 0 | 15610 | 0 |
| B | 0 | 15690 | 0 |
| C | 0 | 36261 | 0 |
| D | 0 | 22081 | 0 |
| Quadrant | Total seconds | Saturated seconds | Saturation percentage |
|---|---|---|---|
| A | 7603 | 166 | 2.183349% |
| B | 7603 | 187 | 2.459555% |
| C | 7604 | 2829 | 37.204103% |
| D | 7603 | 293 | 3.853742% |
Noise dominated data is calculated using 1-second bins in cleaned event files. If a bin has >2000 counts, and if more than 50% of those come from <1% of pixels, then it is considered to be noise-dominated and hence unusable.
| Quadrant | # 1 sec bins | Bins with >0 counts | Bins with >2000 counts | High rate bins dominated by noise | Noise dominated (total time) | Noise dominated (detector-on time) | Marked lightcurve |
|---|---|---|---|---|---|---|---|
| A | 7848 | 7603 | 0 | 0 | 0.00% | 0.00% | 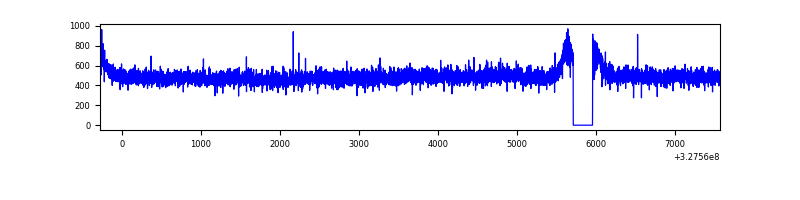 |
| B | 7848 | 7604 | 2 | 2 | 0.03% | 0.03% | 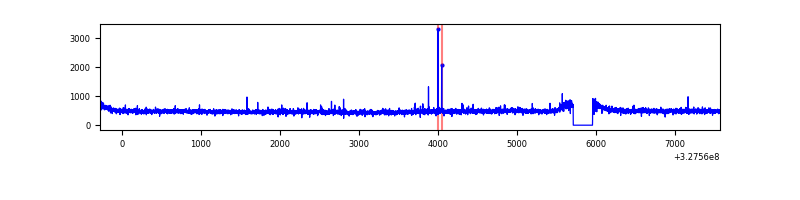 |
| C | 7849 | 7604 | 1847 | 1847 | 23.53% | 24.29% | 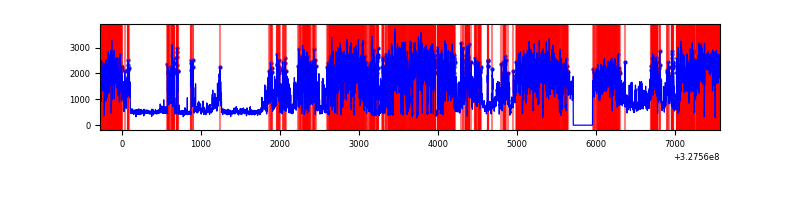 |
| D | 7848 | 7603 | 99 | 99 | 1.26% | 1.30% | 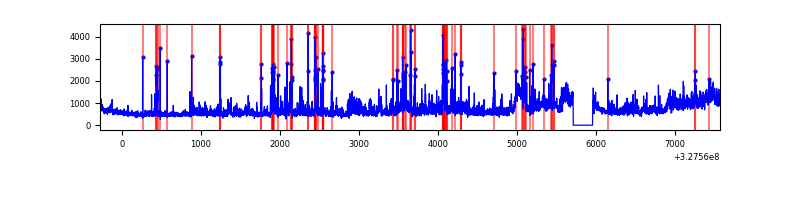 |
Top three noisy pixels from each quadrant. If the there are fewer than three noisy pixels in the level2.evt file, extra rows are filled as -1
| Pixel properties | Quadrant properties | ||||||
|---|---|---|---|---|---|---|---|
| Quadrant | DetID | PixID | Counts | Sigma | Mean | Median | Sigma |
| A | 10 | 17 | 116535 | 607.38 | 935 | 912 | 190.4 |
| A | 13 | 254 | 12413 | 60.41 | 935 | 912 | 190.4 |
| A | 3 | 137 | 8728 | 41.06 | 935 | 912 | 190.4 |
| B | 12 | 111 | 22358 | 118.53 | 934 | 906 | 181.0 |
| B | 11 | 111 | 20192 | 106.56 | 934 | 906 | 181.0 |
| B | 14 | 111 | 17564 | 92.04 | 934 | 906 | 181.0 |
| C | 7 | 247 | 7216714 | 38593.41 | 795 | 799 | 187.0 |
| C | 14 | 238 | 125283 | 665.79 | 795 | 799 | 187.0 |
| C | 7 | 226 | 18587 | 95.14 | 795 | 799 | 187.0 |
| D | 8 | 195 | 756357 | 3440.13 | 895 | 867 | 219.6 |
| D | 12 | 33 | 695199 | 3161.65 | 895 | 867 | 219.6 |
| D | 1 | 52 | 406979 | 1849.24 | 895 | 867 | 219.6 |
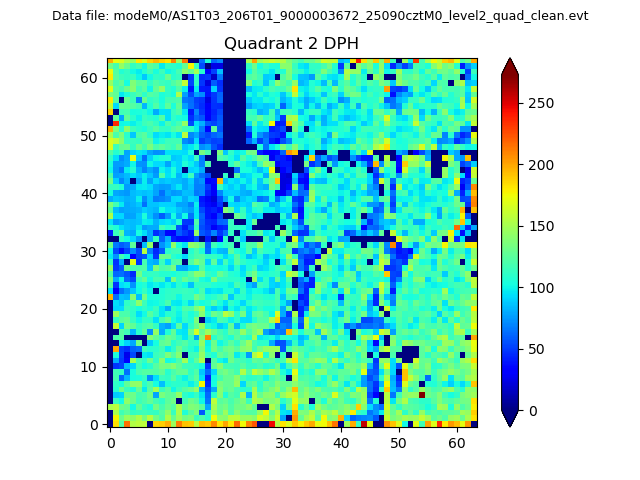
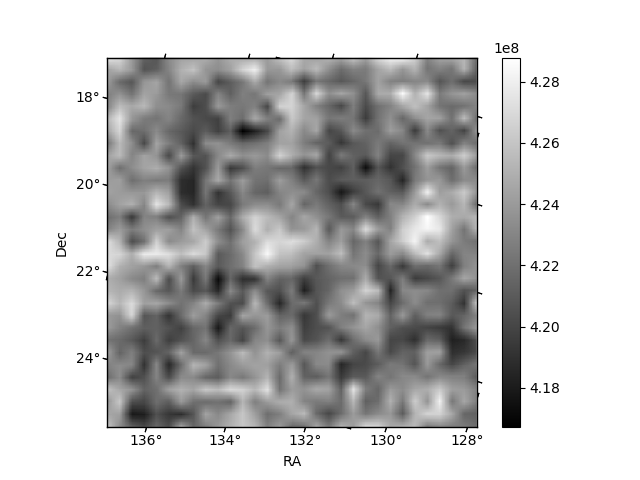
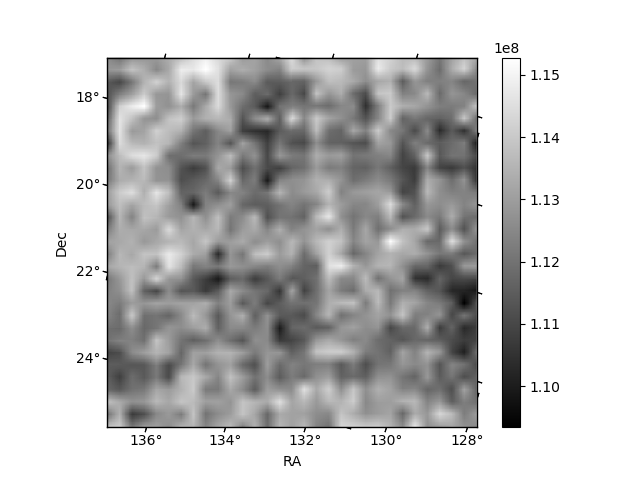
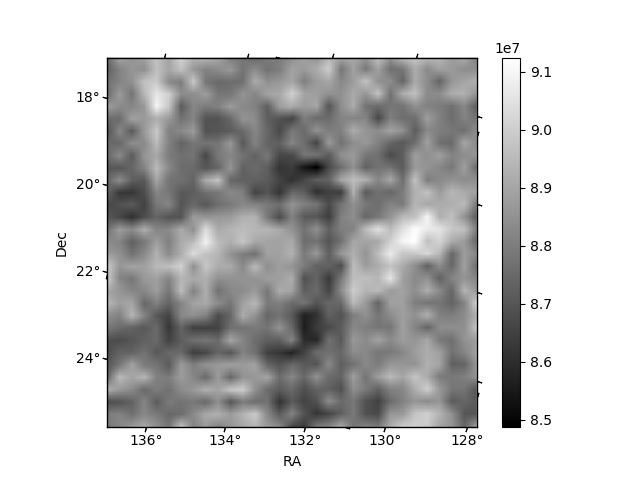
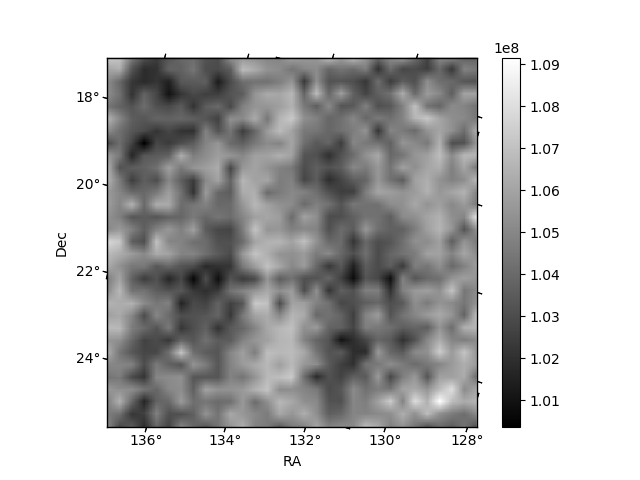
Histogram calculated using DETX and DETY for each event in the final _common_clean file
| Quadrant A | 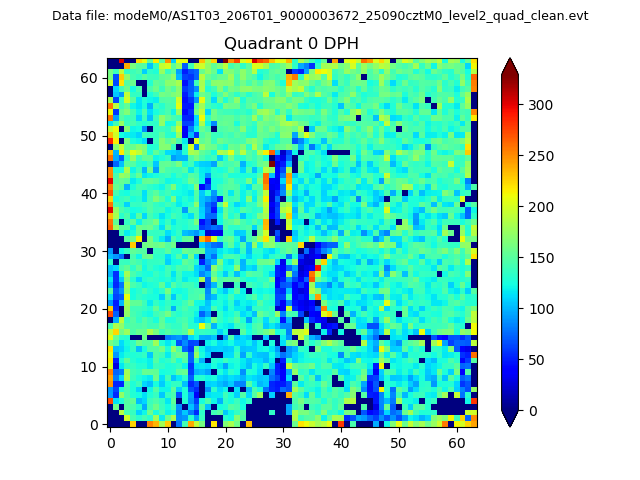 |
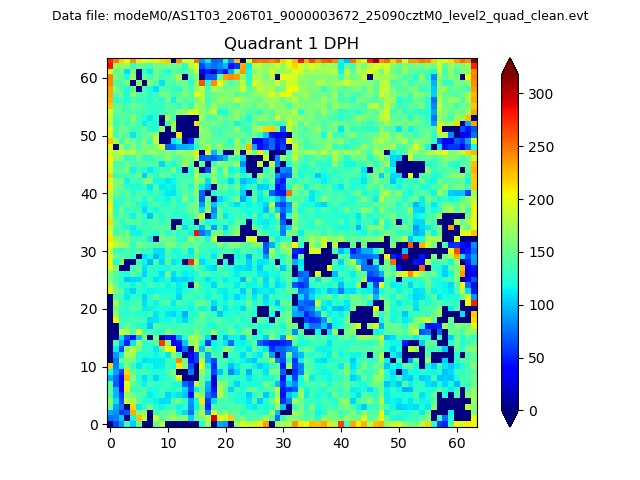 |
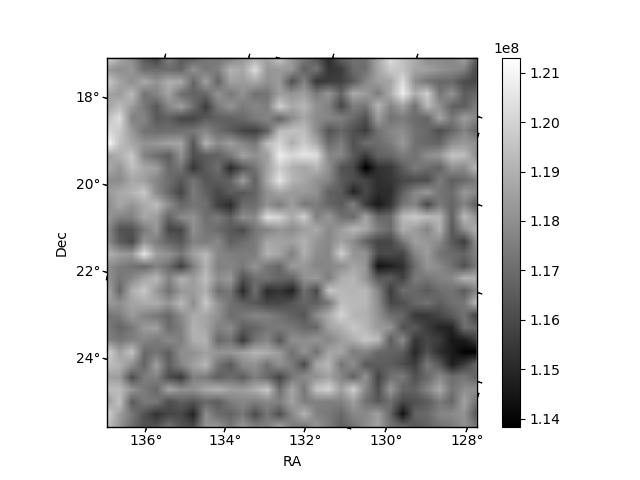
Quadrant B |
|---|---|---|---|
| Quadrant D | 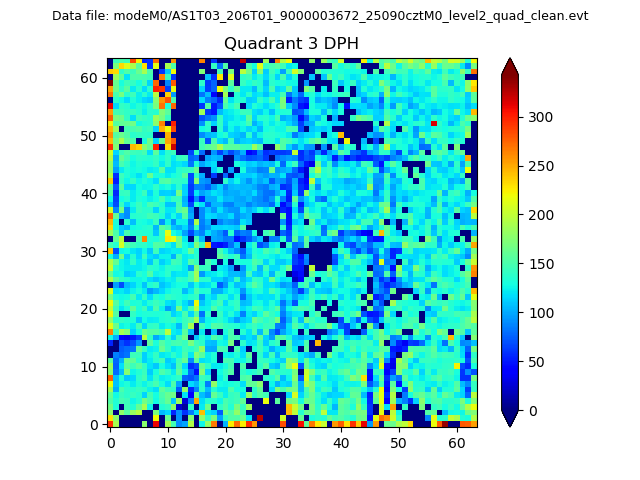 |
 |
Quadrant C |
| Plot type | Count rate plots | Images |
|---|---|---|
| Comparison with Poisson distribution Blue bars denote a histogram of data divided into 1 sec bins. Red curve is a Poisson curve with rate = median count rate of data. |
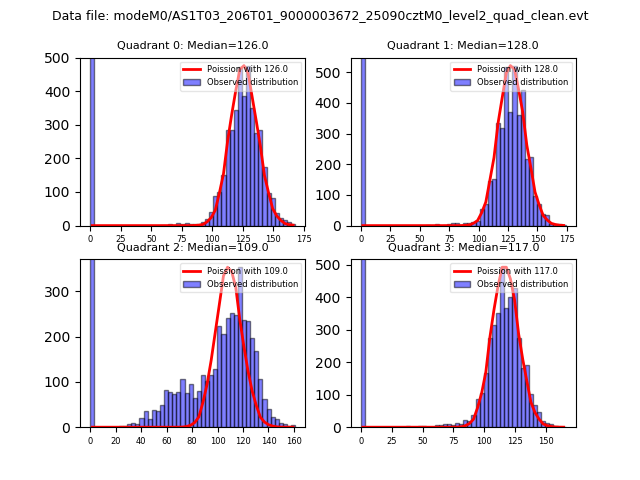 |
 |
| Quadrant-wise count rates Data is divided into 100 sec bins |
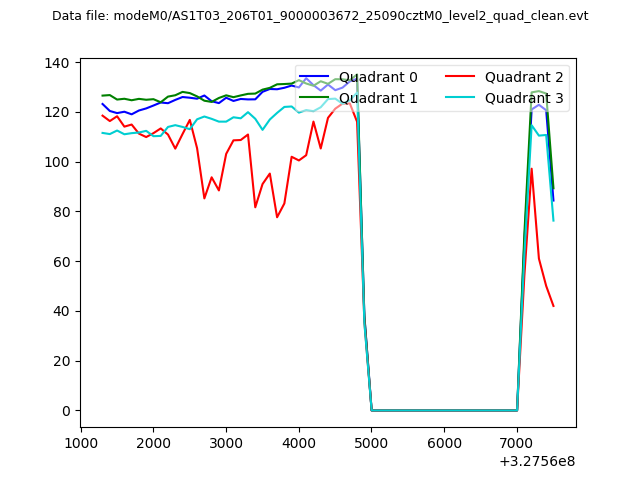 |
|
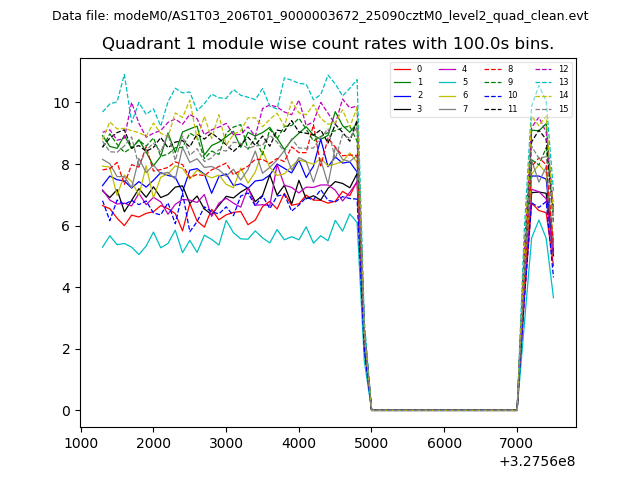
| Module-wise count rates for Quadrant A Data is divided into 100 sec bins |
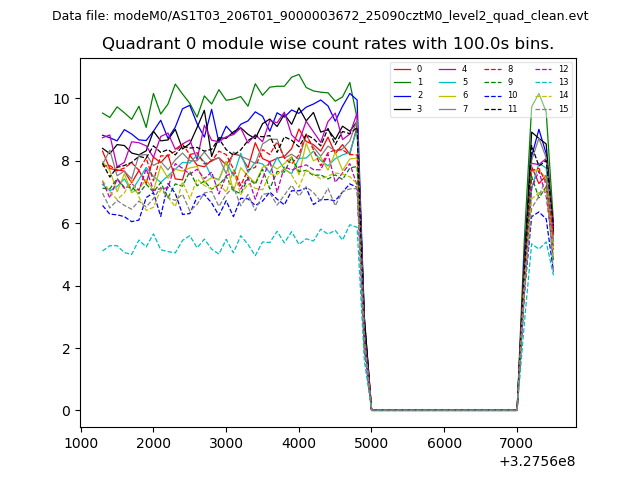 |
 |
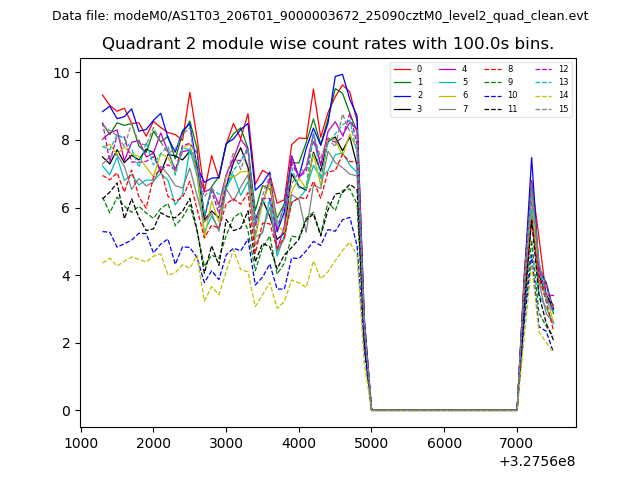
| Module-wise count rates for Quadrant B Data is divided into 100 sec bins |
 |
 |
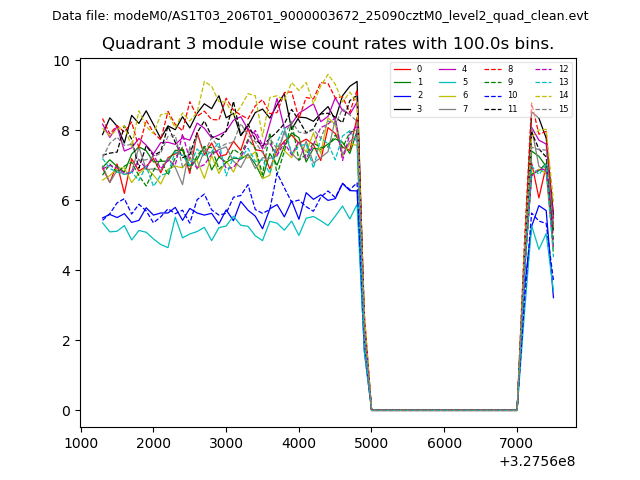
| Module-wise count rates for Quadrant C Data is divided into 100 sec bins |
 |
 |
| Module-wise count rates for Quadrant D Data is divided into 100 sec bins |
 |
 |
| Parameter | Plot |
|---|---|
| CZT HV Monitor | 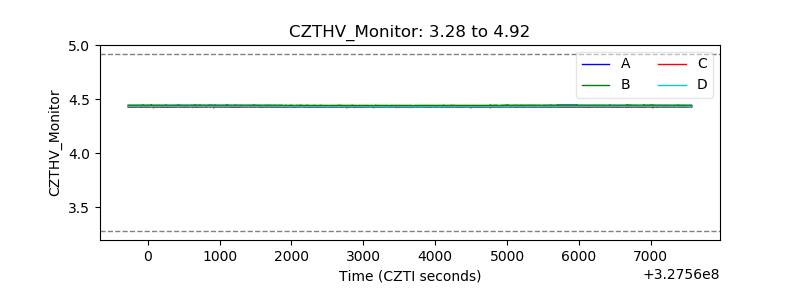 |
| D_VDD | 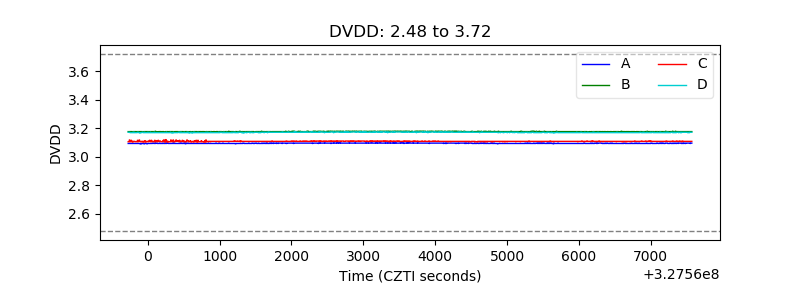 |
| Temperature 1 | 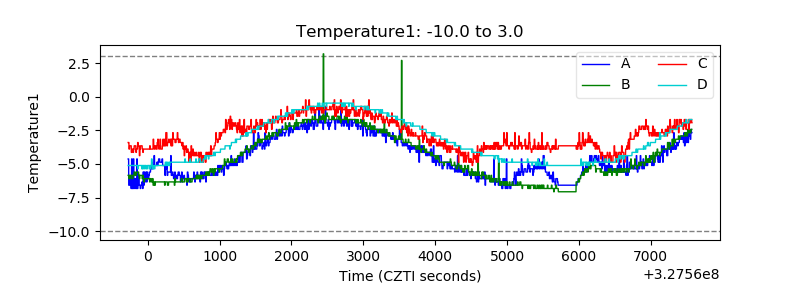 |
| Veto HV Monitor | 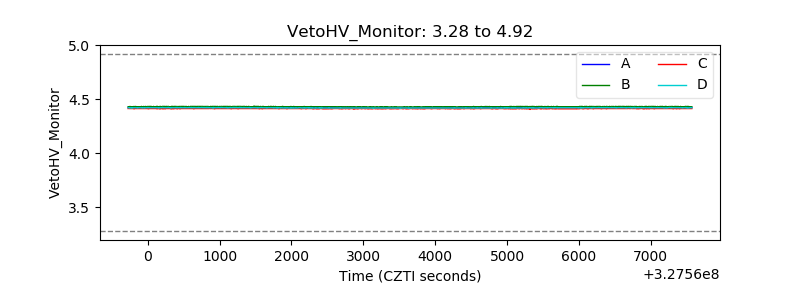 |
| Veto LLD | 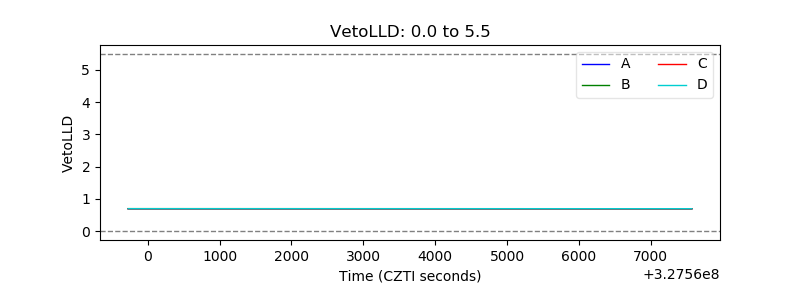 |
| Alpha Counter | 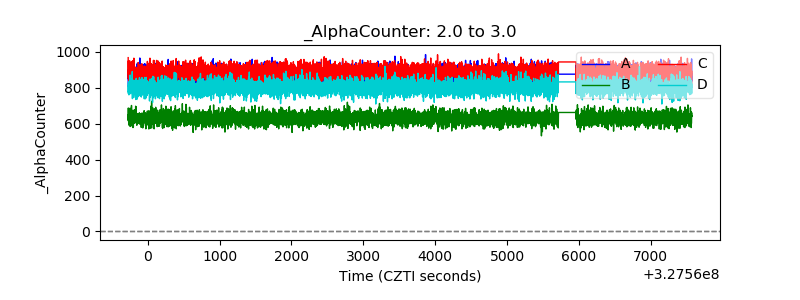 |
| _CPM_Rate | 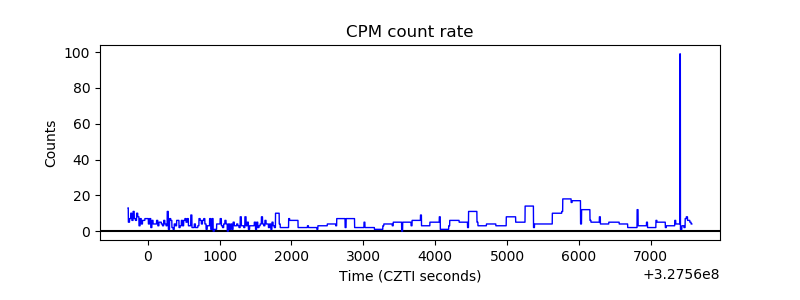 |
| CZT Counter | 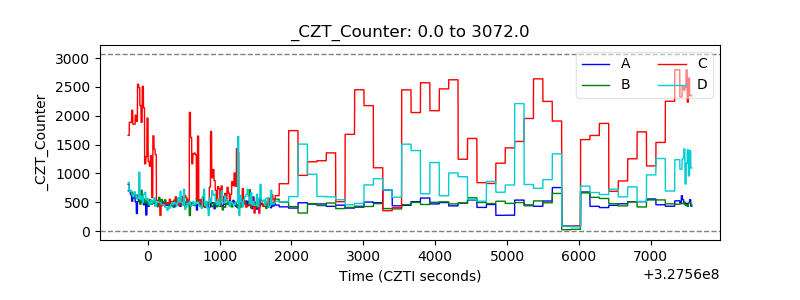 |
| +2.5 Volts monitor | 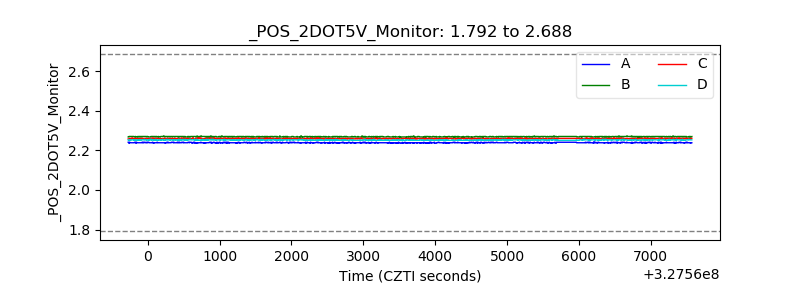 |
| +5 Volts monitor |  |
| _ROLL_ROT | 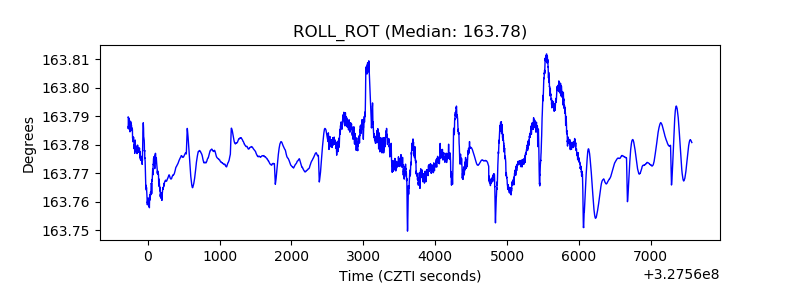 |
| _Roll_DEC | 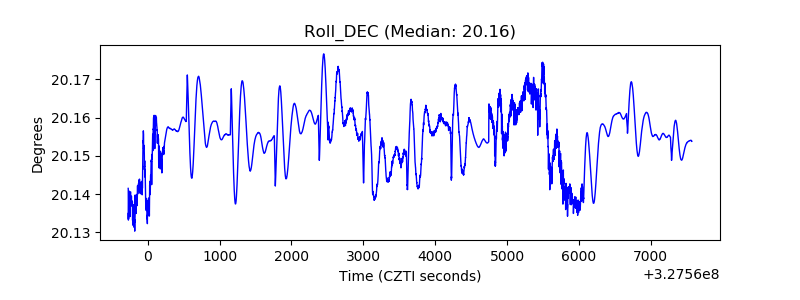 |
| _Roll_RA | 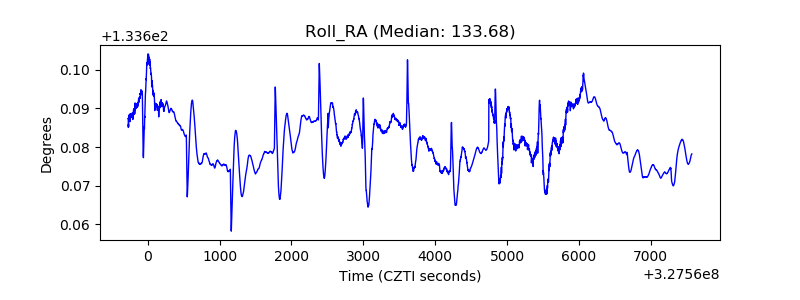 |
| Veto Counter | 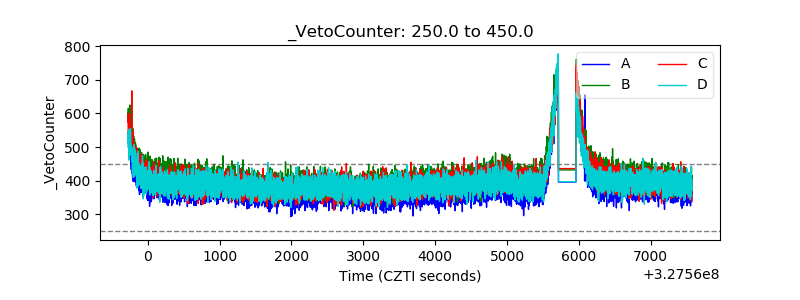 |