| Param | Original file | Final file |
|---|---|---|
| Filename | modeM0/AS1T03_206T01_9000003672_25093cztM0_level2.evt | modeM0/AS1T03_206T01_9000003672_25093cztM0_level2_quad_clean.evt |
| Size (bytes) | 1,917,325,440 | 233,447,040 |
| Size | 1.8 GB | 222.6 MB |
| Events in quadrant A | 9,018,479 | 1,549,718 |
| Events in quadrant B | 9,132,808 | 1,567,156 |
| Events in quadrant C | 12,678,985 | 1,448,789 |
| Events in quadrant D | 25,992,308 | 1,228,536 |
| Mode M9 | |||
|---|---|---|---|
| Quadrant | BADHDUFLAG | Total packets | Discarded packets |
| A | 0 | 18 | 0 |
| B | 0 | 18 | 0 |
| C | 0 | 18 | 0 |
| D | 0 | 18 | 0 |
| Mode M0 | |||
|---|---|---|---|
| Quadrant | BADHDUFLAG | Total packets | Discarded packets |
| A | 0 | 37909 | 0 |
| B | 0 | 38668 | 0 |
| C | 0 | 49513 | 0 |
| D | 0 | 90245 | 0 |
| Quadrant | Total seconds | Saturated seconds | Saturation percentage |
|---|---|---|---|
| A | 18494 | 245 | 1.324754% |
| B | 18495 | 265 | 1.432820% |
| C | 18495 | 1275 | 6.893755% |
| D | 18494 | 4387 | 23.721207% |
Noise dominated data is calculated using 1-second bins in cleaned event files. If a bin has >2000 counts, and if more than 50% of those come from <1% of pixels, then it is considered to be noise-dominated and hence unusable.
| Quadrant | # 1 sec bins | Bins with >0 counts | Bins with >2000 counts | High rate bins dominated by noise | Noise dominated (total time) | Noise dominated (detector-on time) | Marked lightcurve |
|---|---|---|---|---|---|---|---|
| A | 20254 | 18494 | 0 | 0 | 0.00% | 0.00% | 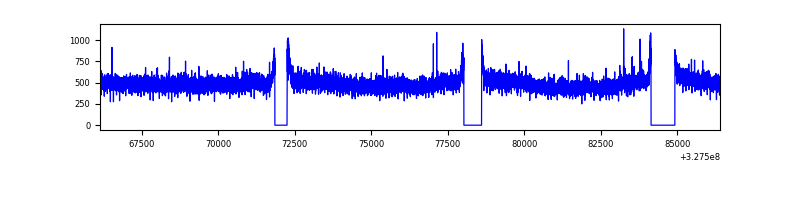 |
| B | 20255 | 18497 | 11 | 11 | 0.05% | 0.06% | 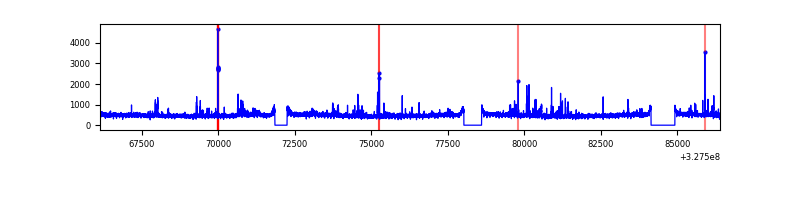 |
| C | 20255 | 18496 | 646 | 646 | 3.19% | 3.49% | 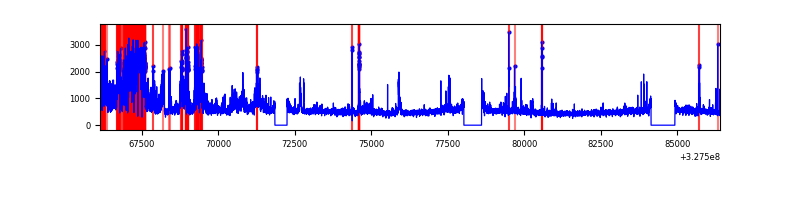 |
| D | 20254 | 18495 | 4243 | 4243 | 20.95% | 22.94% | 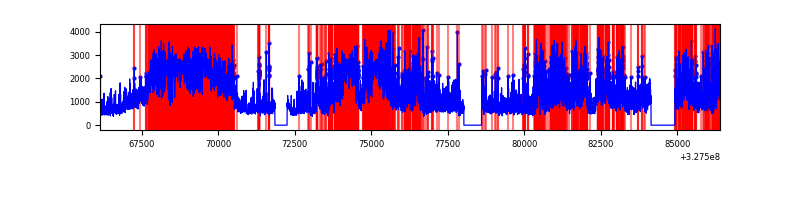 |
Top three noisy pixels from each quadrant. If the there are fewer than three noisy pixels in the level2.evt file, extra rows are filled as -1
| Pixel properties | Quadrant properties | ||||||
|---|---|---|---|---|---|---|---|
| Quadrant | DetID | PixID | Counts | Sigma | Mean | Median | Sigma |
| A | 10 | 17 | 325111 | 710.98 | 2252 | 2203 | 454.2 |
| A | 13 | 254 | 30793 | 62.95 | 2252 | 2203 | 454.2 |
| A | 3 | 137 | 20761 | 40.86 | 2252 | 2203 | 454.2 |
| B | 0 | 229 | 117226 | 270.54 | 2237 | 2180 | 425.3 |
| B | 0 | 190 | 86627 | 198.58 | 2237 | 2180 | 425.3 |
| B | 3 | 209 | 83025 | 190.11 | 2237 | 2180 | 425.3 |
| C | 7 | 247 | 3895162 | 7871.74 | 2112 | 2121 | 494.6 |
| C | 14 | 238 | 334868 | 672.81 | 2112 | 2121 | 494.6 |
| C | 2 | 16 | 95985 | 189.79 | 2112 | 2121 | 494.6 |
| D | 12 | 33 | 12035175 | 22918.75 | 1992 | 1947 | 525.0 |
| D | 8 | 195 | 3938323 | 7497.31 | 1992 | 1947 | 525.0 |
| D | 1 | 52 | 1046987 | 1990.41 | 1992 | 1947 | 525.0 |
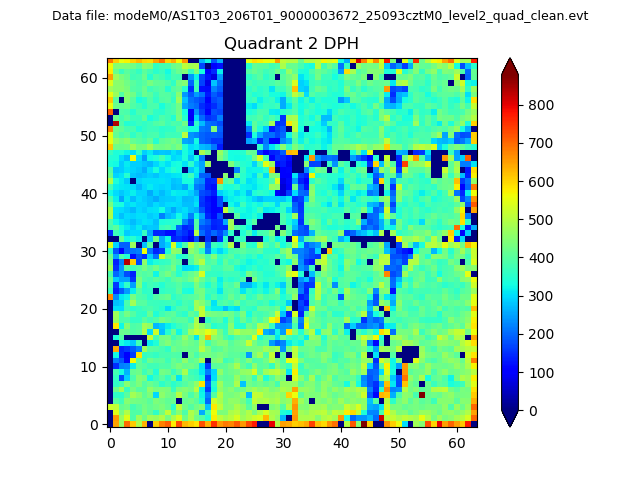
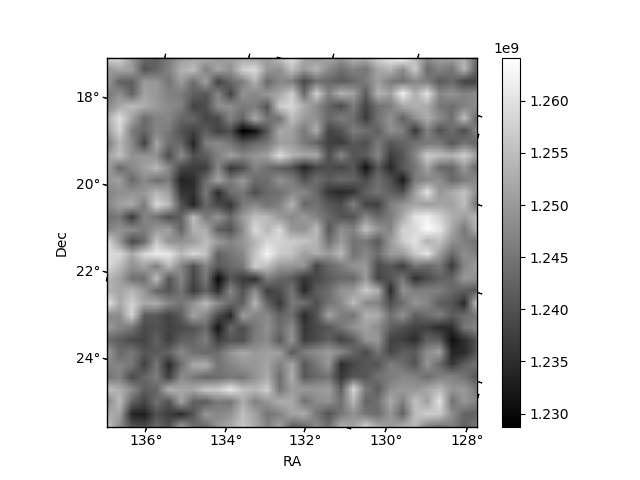
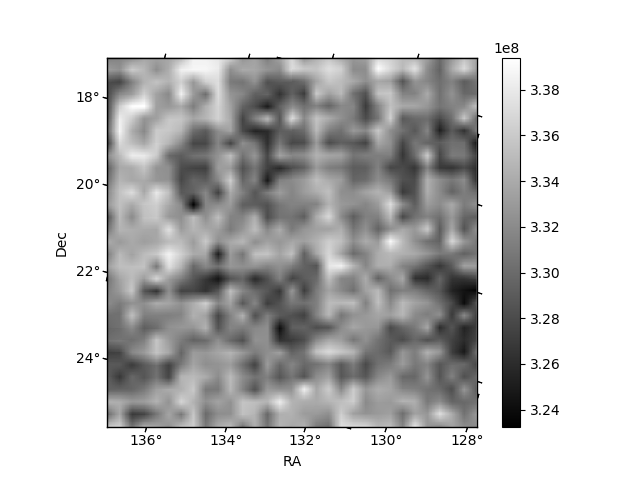
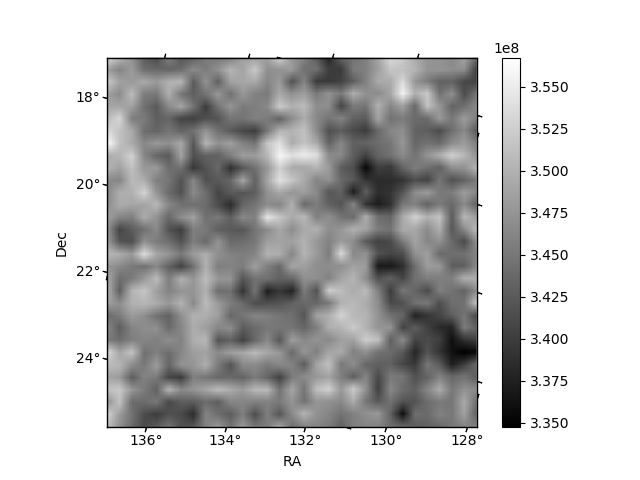
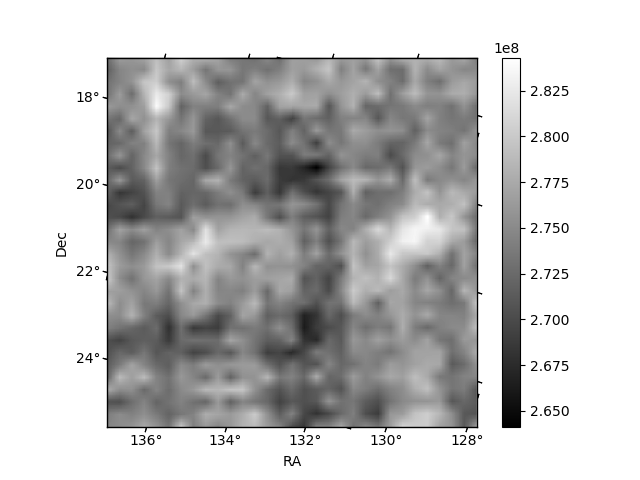
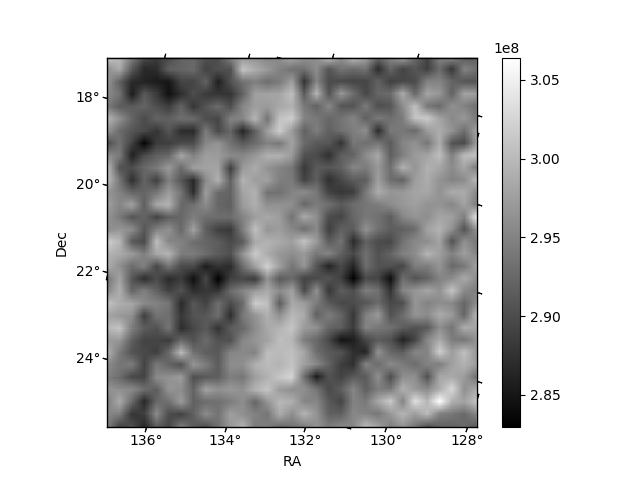
Histogram calculated using DETX and DETY for each event in the final _common_clean file
| Quadrant A | 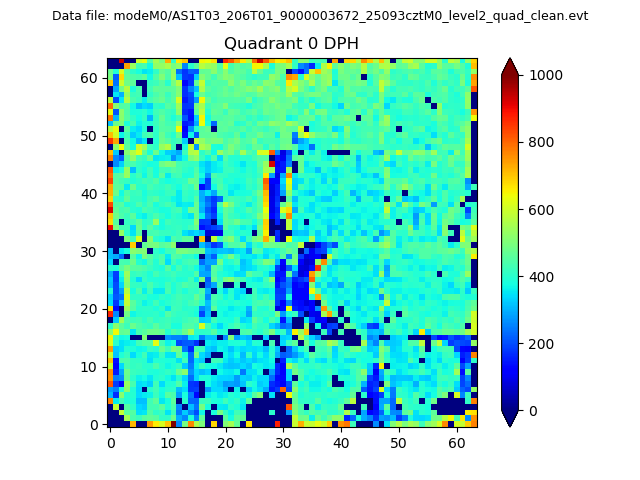 |
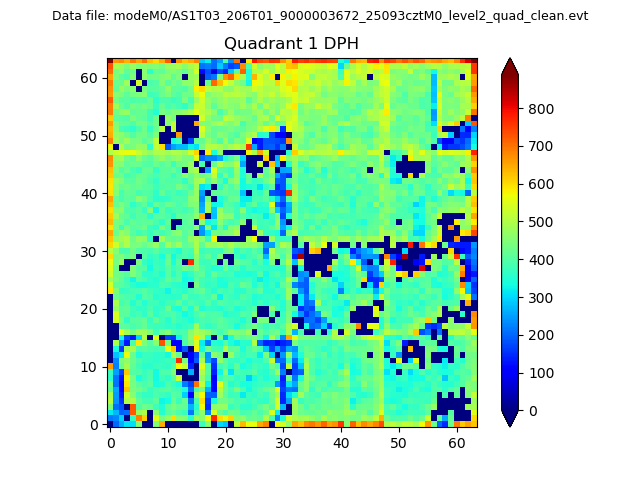 |
Quadrant B |
|---|---|---|---|
| Quadrant D | 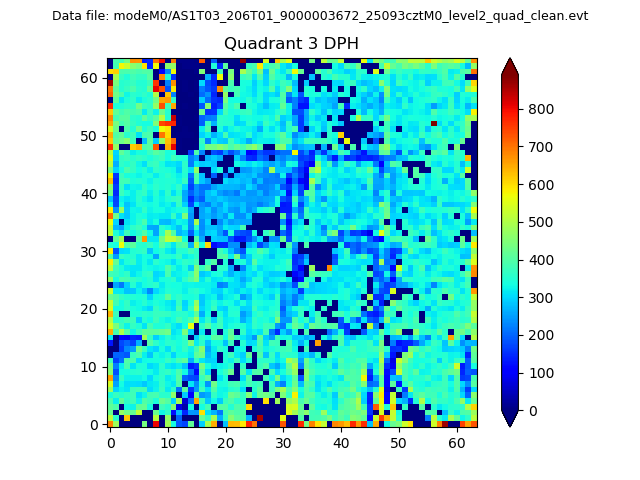 |
 |
Quadrant C |
| Plot type | Count rate plots | Images |
|---|---|---|
| Comparison with Poisson distribution Blue bars denote a histogram of data divided into 1 sec bins. Red curve is a Poisson curve with rate = median count rate of data. |
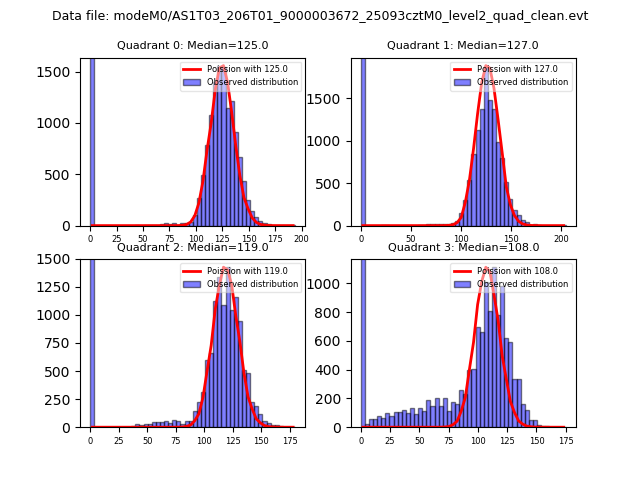 |
 |
| Quadrant-wise count rates Data is divided into 100 sec bins |
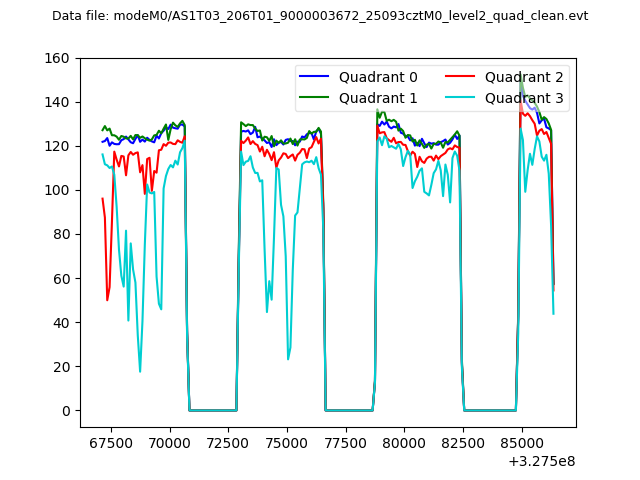 |
|
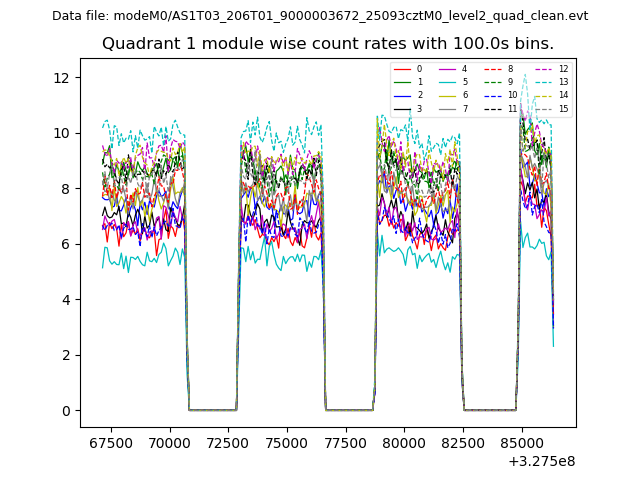
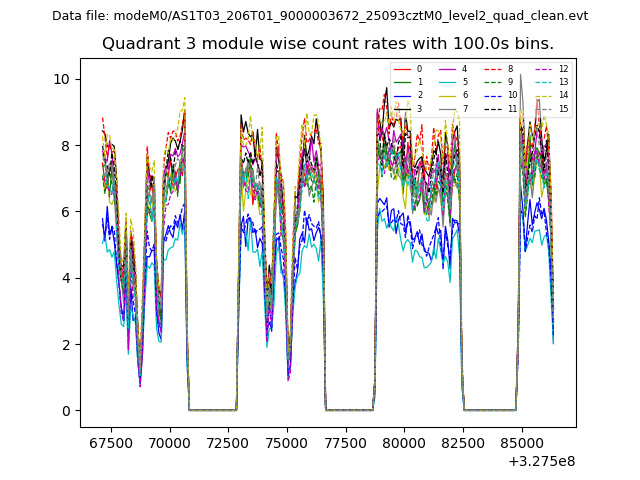
| Module-wise count rates for Quadrant A Data is divided into 100 sec bins |
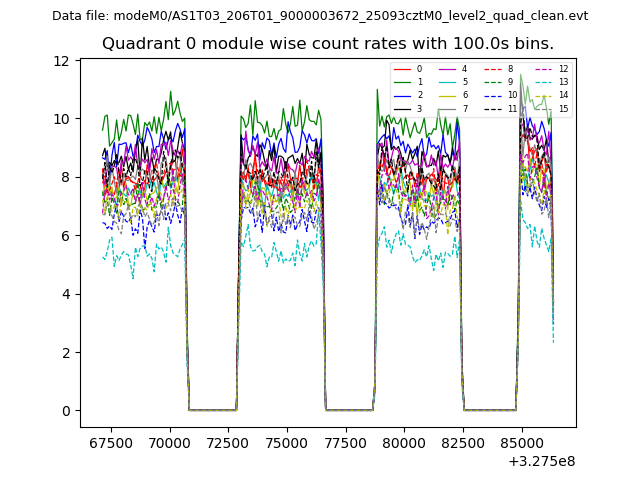 |
 |
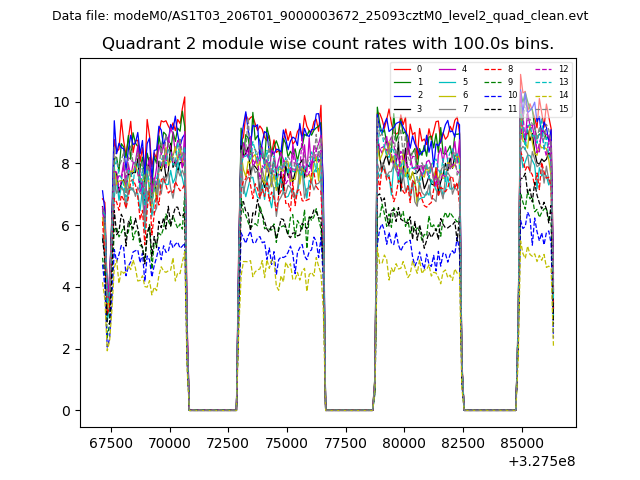
| Module-wise count rates for Quadrant B Data is divided into 100 sec bins |
 |
 |
| Module-wise count rates for Quadrant C Data is divided into 100 sec bins |
 |
 |
| Module-wise count rates for Quadrant D Data is divided into 100 sec bins |
 |
 |
| Parameter | Plot |
|---|---|
| CZT HV Monitor | 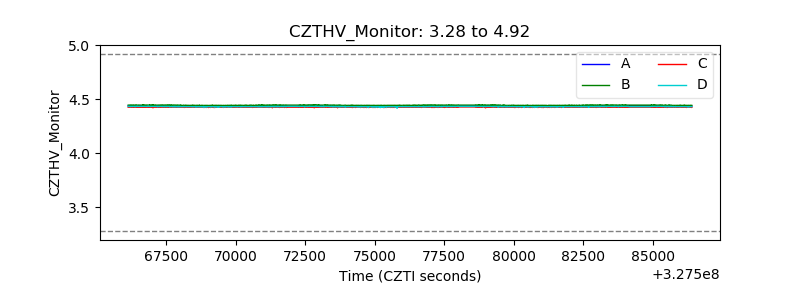 |
| D_VDD | 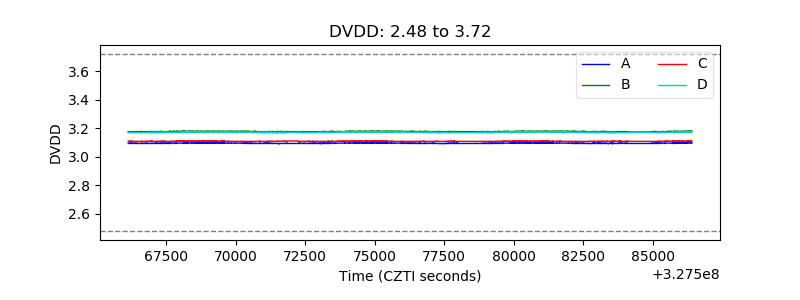 |
| Temperature 1 | 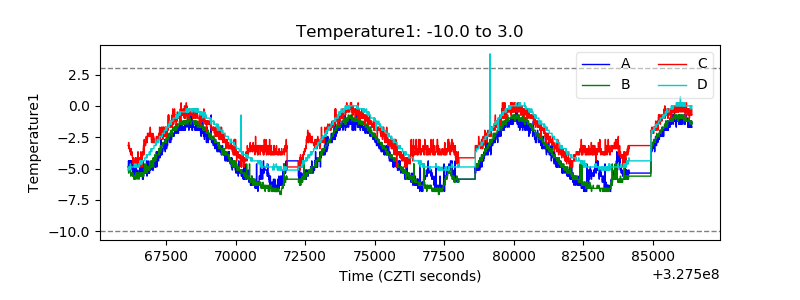 |
| Veto HV Monitor | 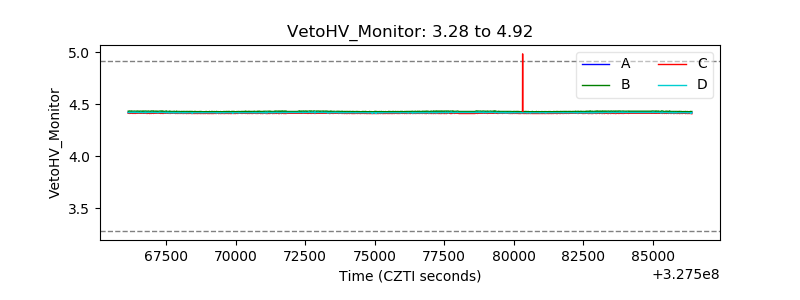 |
| Veto LLD | 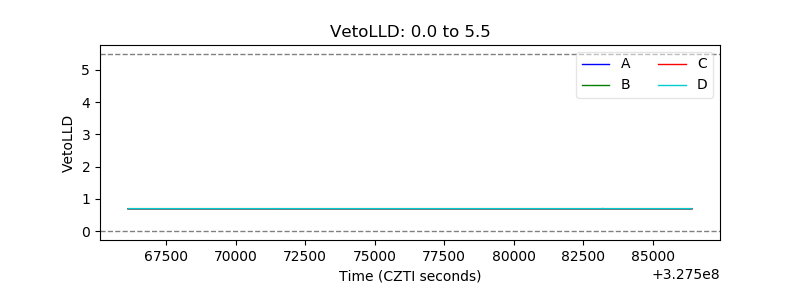 |
| Alpha Counter | 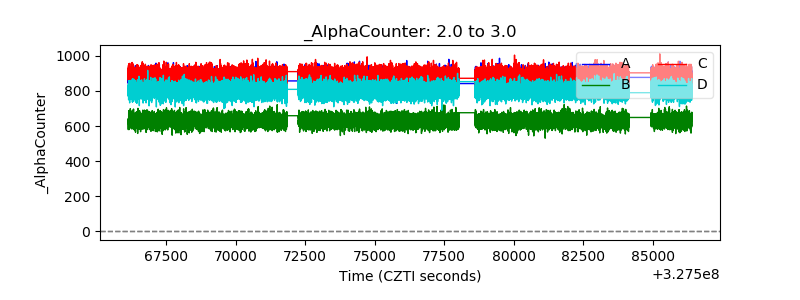 |
| _CPM_Rate | 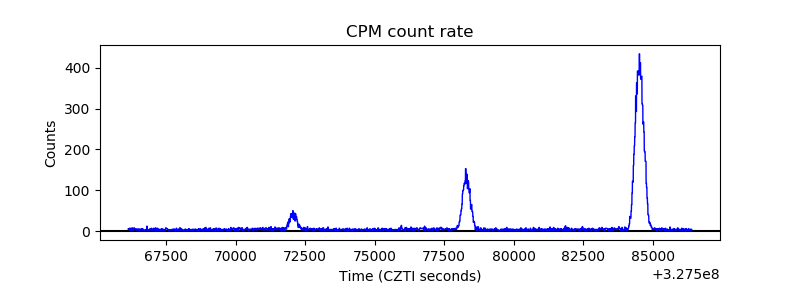 |
| CZT Counter | 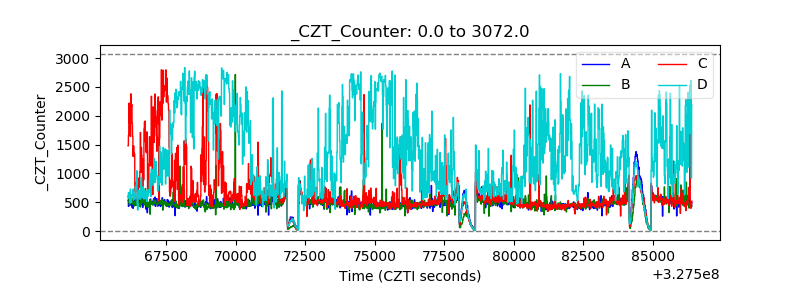 |
| +2.5 Volts monitor |  |
| +5 Volts monitor | 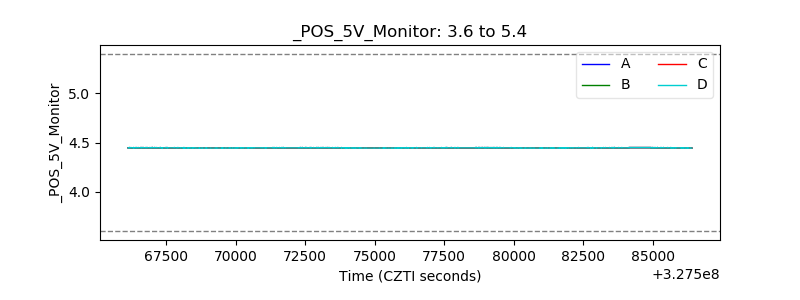 |
| _ROLL_ROT | 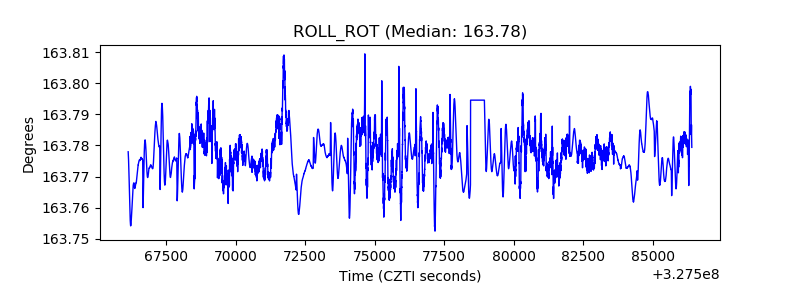 |
| _Roll_DEC | 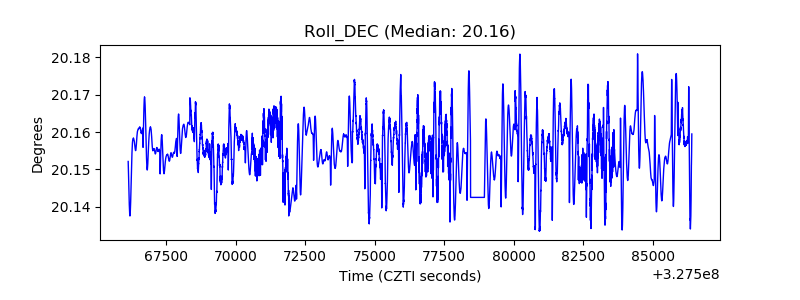 |
| _Roll_RA | 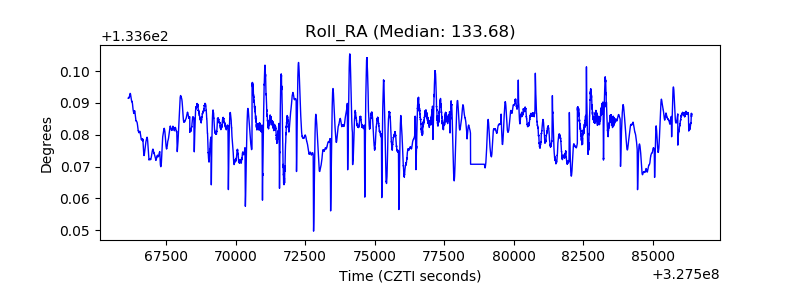 |
| Veto Counter | 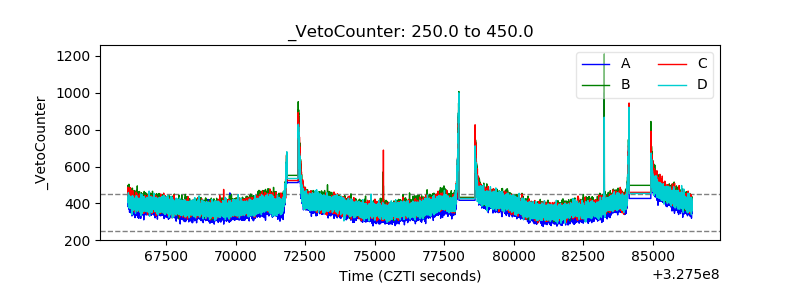 |