| Param | Original file | Final file |
|---|---|---|
| Filename | modeM0/AS1T03_206T01_9000003672_25094cztM0_level2.evt | modeM0/AS1T03_206T01_9000003672_25094cztM0_level2_quad_clean.evt |
| Size (bytes) | 566,248,320 | 86,420,160 |
| Size | 540.0 MB | 82.4 MB |
| Events in quadrant A | 3,122,248 | 571,053 |
| Events in quadrant B | 3,159,774 | 579,259 |
| Events in quadrant C | 3,856,822 | 537,252 |
| Events in quadrant D | 6,582,231 | 488,286 |
| Mode M9 | |||
|---|---|---|---|
| Quadrant | BADHDUFLAG | Total packets | Discarded packets |
| A | 0 | 9 | 0 |
| B | 0 | 9 | 0 |
| C | 0 | 9 | 0 |
| D | 0 | 9 | 0 |
| Mode SS | |||
|---|---|---|---|
| Quadrant | BADHDUFLAG | Total packets | Discarded packets |
| A | 0 | 64 | 0 |
| B | 0 | 64 | 0 |
| C | 0 | 64 | 0 |
| D | 0 | 64 | 0 |
| Mode M0 | |||
|---|---|---|---|
| Quadrant | BADHDUFLAG | Total packets | Discarded packets |
| A | 0 | 13141 | 0 |
| B | 0 | 13478 | 0 |
| C | 0 | 15552 | 0 |
| D | 0 | 24060 | 0 |
| Quadrant | Total seconds | Saturated seconds | Saturation percentage |
|---|---|---|---|
| A | 6318 | 67 | 1.060462% |
| B | 6318 | 84 | 1.329535% |
| C | 6318 | 195 | 3.086420% |
| D | 6318 | 816 | 12.915480% |
Noise dominated data is calculated using 1-second bins in cleaned event files. If a bin has >2000 counts, and if more than 50% of those come from <1% of pixels, then it is considered to be noise-dominated and hence unusable.
| Quadrant | # 1 sec bins | Bins with >0 counts | Bins with >2000 counts | High rate bins dominated by noise | Noise dominated (total time) | Noise dominated (detector-on time) | Marked lightcurve |
|---|---|---|---|---|---|---|---|
| A | 7223 | 6318 | 0 | 0 | 0.00% | 0.00% | 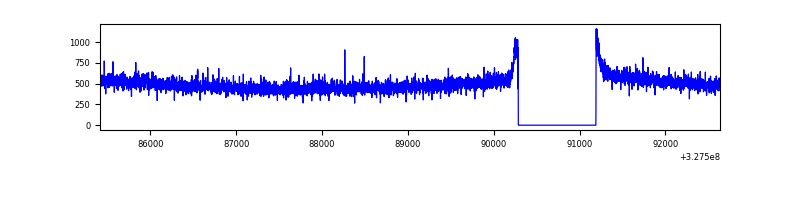 |
| B | 7223 | 6318 | 6 | 6 | 0.08% | 0.09% | 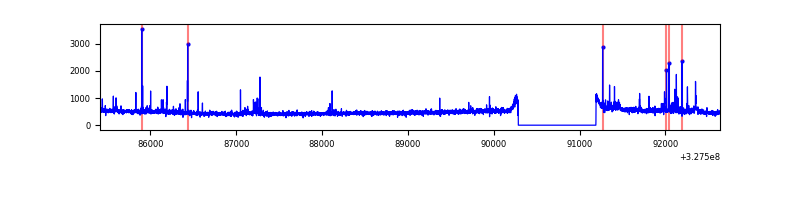 |
| C | 7223 | 6318 | 53 | 53 | 0.73% | 0.84% | 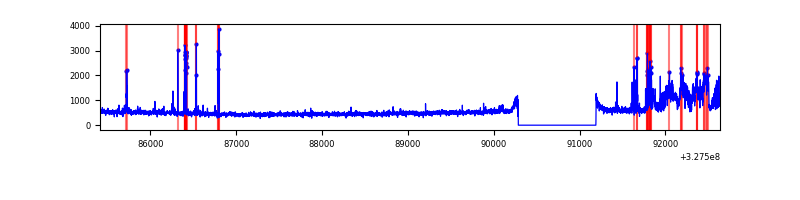 |
| D | 7223 | 6318 | 689 | 689 | 9.54% | 10.91% | 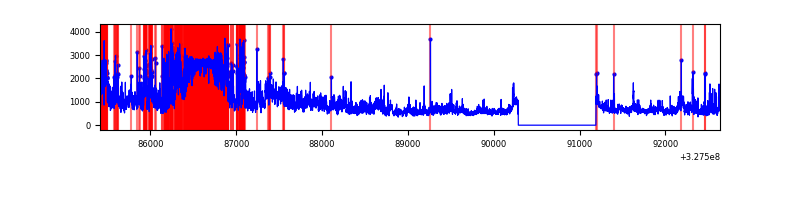 |
Top three noisy pixels from each quadrant. If the there are fewer than three noisy pixels in the level2.evt file, extra rows are filled as -1
| Pixel properties | Quadrant properties | ||||||
|---|---|---|---|---|---|---|---|
| Quadrant | DetID | PixID | Counts | Sigma | Mean | Median | Sigma |
| A | 10 | 17 | 125751 | 793.3 | 777 | 759 | 157.6 |
| A | 13 | 254 | 10171 | 59.74 | 777 | 759 | 157.6 |
| A | 3 | 137 | 6841 | 38.6 | 777 | 759 | 157.6 |
| B | 5 | 172 | 60510 | 403.3 | 771 | 752 | 148.2 |
| B | 0 | 229 | 44061 | 292.29 | 771 | 752 | 148.2 |
| B | 0 | 190 | 37824 | 250.19 | 771 | 752 | 148.2 |
| C | 7 | 247 | 682847 | 3913.81 | 737 | 742 | 174.3 |
| C | 14 | 238 | 116074 | 661.76 | 737 | 742 | 174.3 |
| C | 0 | 207 | 110706 | 630.96 | 737 | 742 | 174.3 |
| D | 8 | 195 | 1303758 | 7349.56 | 723 | 701 | 177.3 |
| D | 12 | 33 | 1290768 | 7276.3 | 723 | 701 | 177.3 |
| D | 12 | 233 | 548326 | 3088.74 | 723 | 701 | 177.3 |
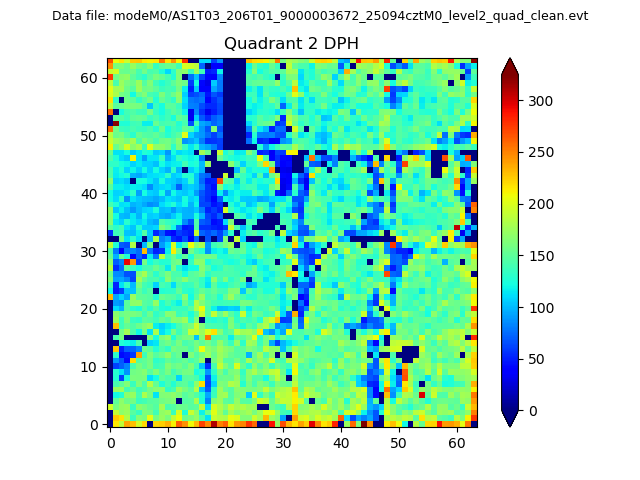
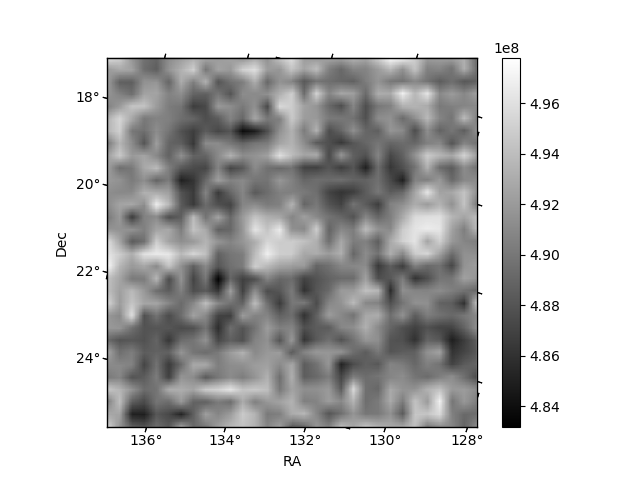
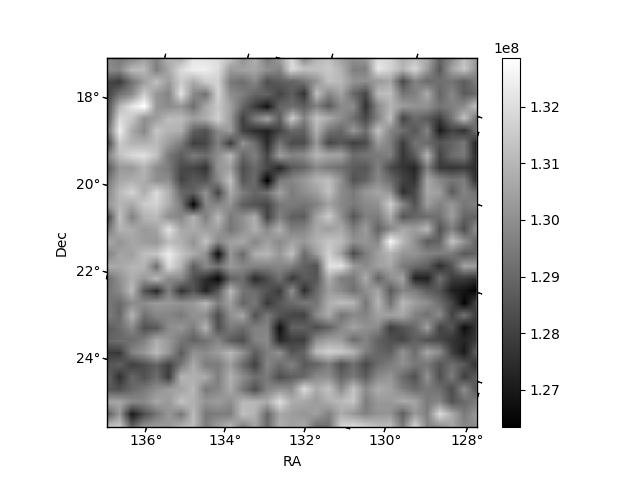
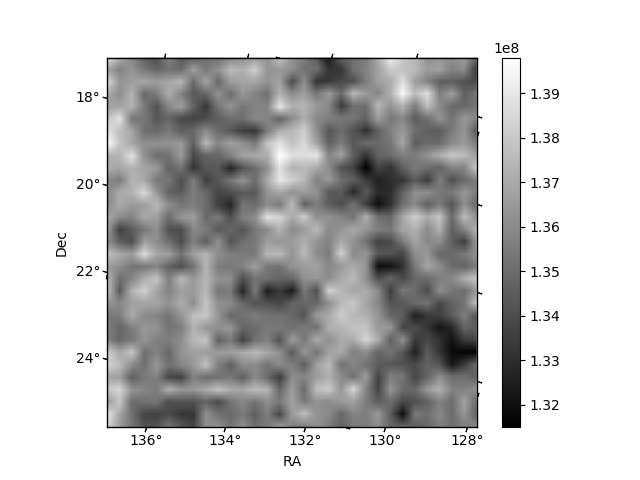
Histogram calculated using DETX and DETY for each event in the final _common_clean file
| Quadrant A | 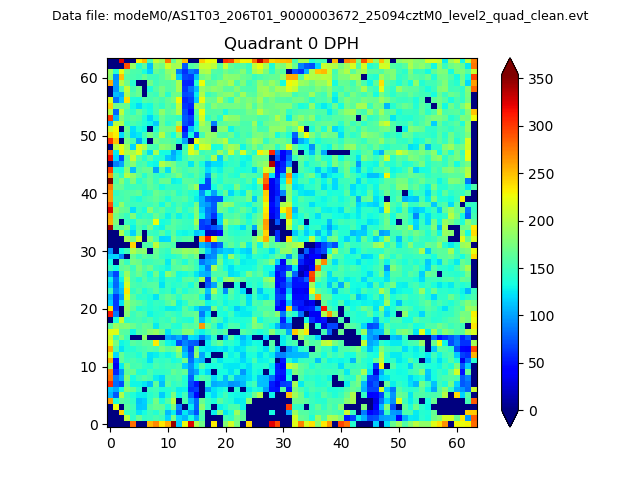 |
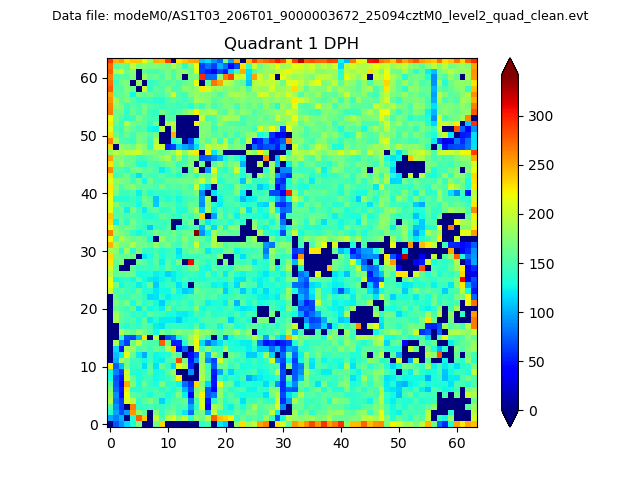 |
Quadrant B |
|---|---|---|---|
| Quadrant D | 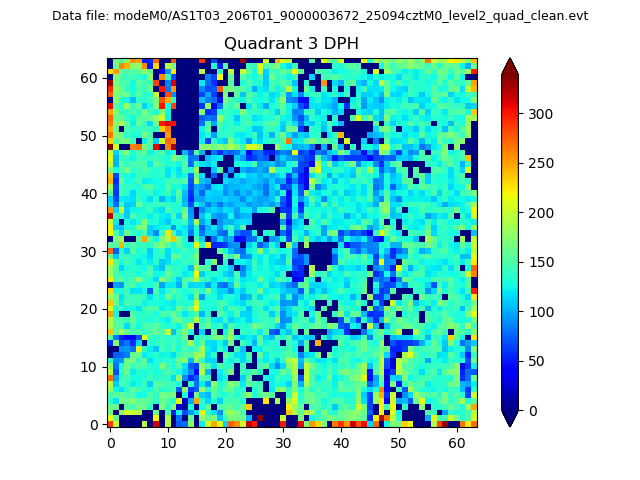 |
 |
Quadrant C |
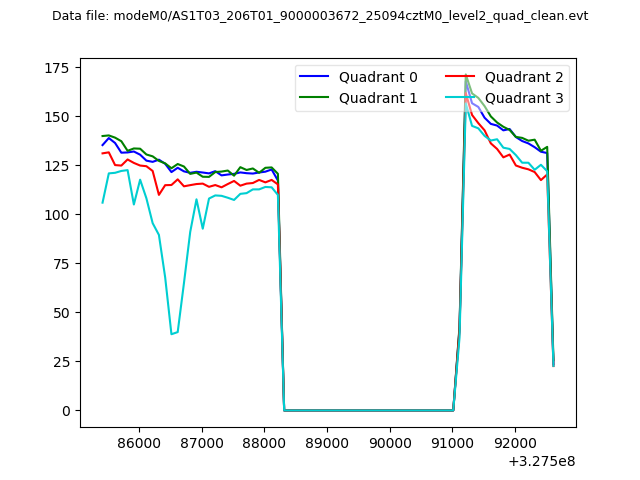
| Plot type | Count rate plots | Images |
|---|---|---|
| Comparison with Poisson distribution Blue bars denote a histogram of data divided into 1 sec bins. Red curve is a Poisson curve with rate = median count rate of data. |
 |
 |
| Quadrant-wise count rates Data is divided into 100 sec bins |
 |
|
| Module-wise count rates for Quadrant A Data is divided into 100 sec bins |
 |
 |
| Module-wise count rates for Quadrant B Data is divided into 100 sec bins |
 |
 |
| Module-wise count rates for Quadrant C Data is divided into 100 sec bins |
 |
 |
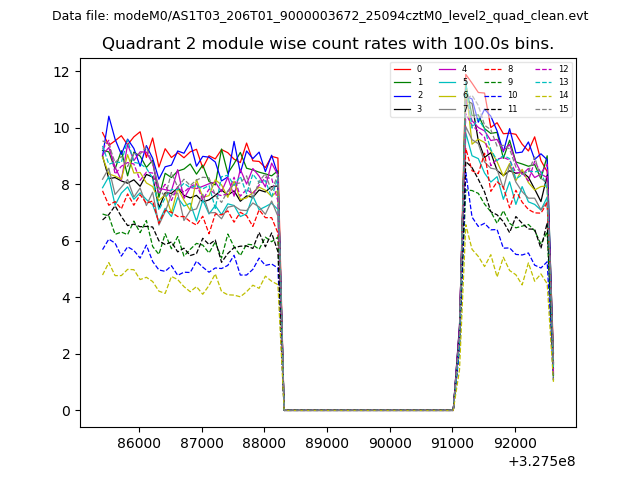
| Module-wise count rates for Quadrant D Data is divided into 100 sec bins |
 |
 |
| Parameter | Plot |
|---|---|
| CZT HV Monitor | 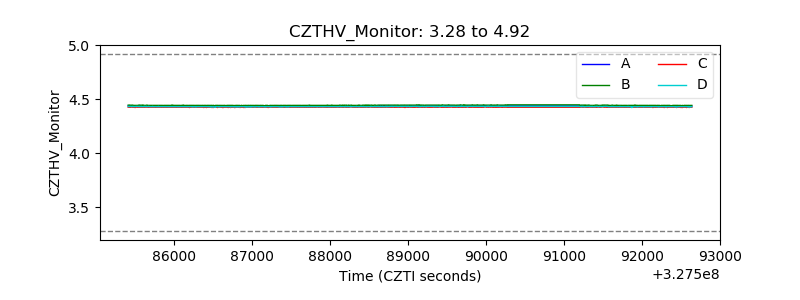 |
| D_VDD | 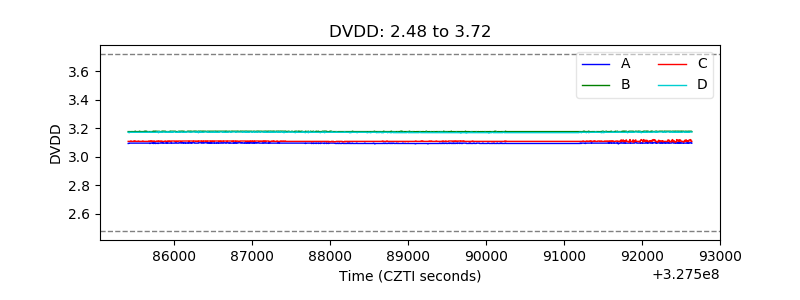 |
| Temperature 1 | 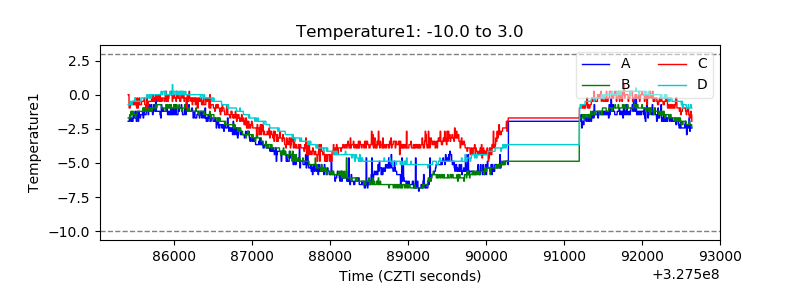 |
| Veto HV Monitor | 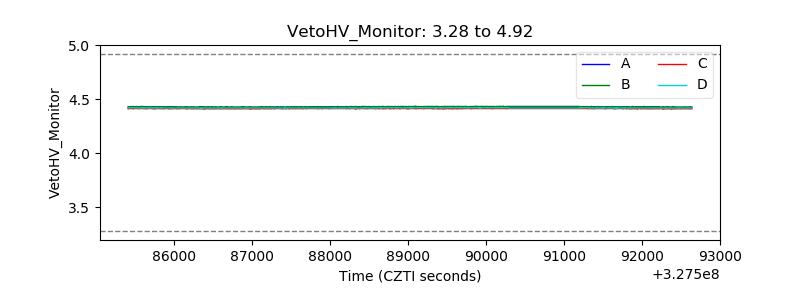 |
| Veto LLD | 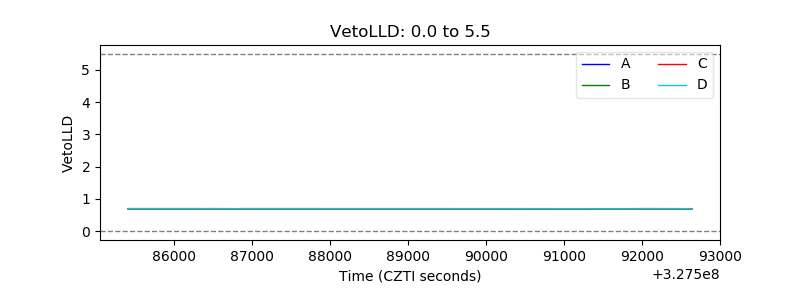 |
| Alpha Counter | 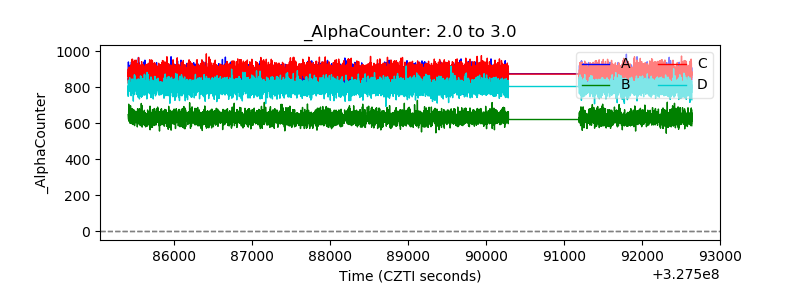 |
| _CPM_Rate | 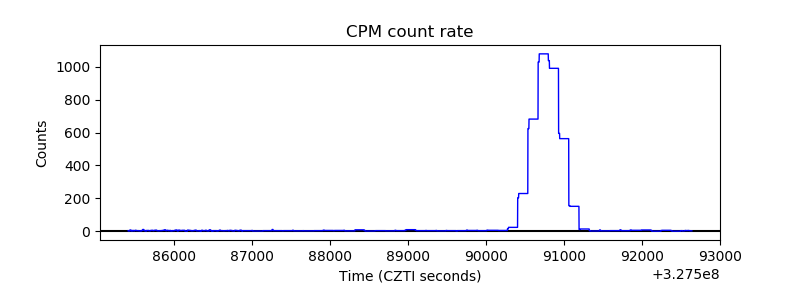 |
| CZT Counter | 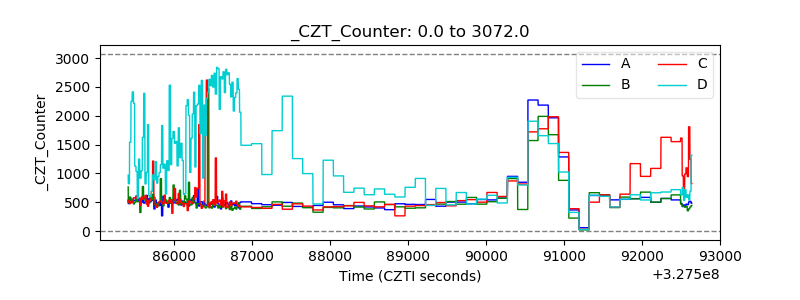 |
| +2.5 Volts monitor |  |
| +5 Volts monitor |  |
| _ROLL_ROT | 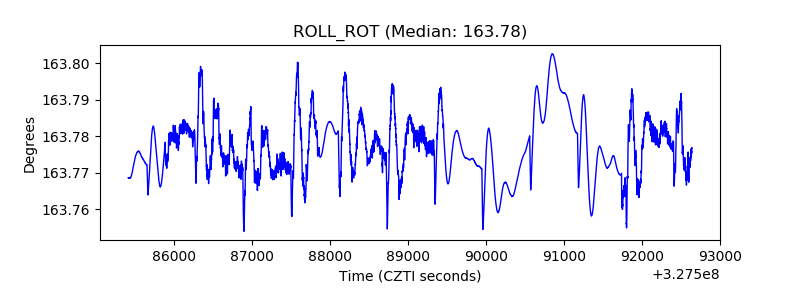 |
| _Roll_DEC |  |
| _Roll_RA | 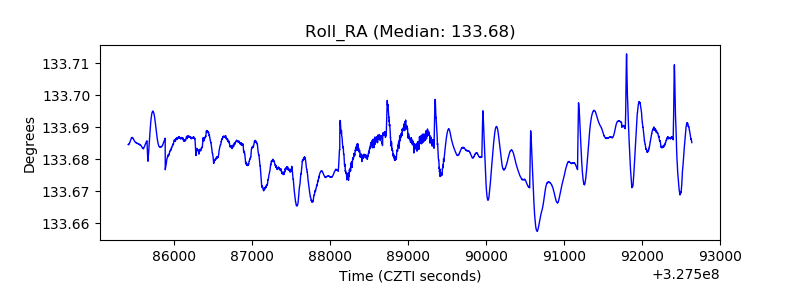 |
| Veto Counter |  |