| Param | Original file | Final file |
|---|---|---|
| Filename | modeM0/AS1T03_206T01_9000003672_25096cztM0_level2.evt | modeM0/AS1T03_206T01_9000003672_25096cztM0_level2_quad_clean.evt |
| Size (bytes) | 550,869,120 | 84,876,480 |
| Size | 525.3 MB | 80.9 MB |
| Events in quadrant A | 3,065,263 | 558,292 |
| Events in quadrant B | 3,365,830 | 565,227 |
| Events in quadrant C | 4,186,579 | 524,800 |
| Events in quadrant D | 5,642,867 | 486,217 |
| Mode M9 | |||
|---|---|---|---|
| Quadrant | BADHDUFLAG | Total packets | Discarded packets |
| A | 0 | 11 | 0 |
| B | 0 | 11 | 0 |
| C | 0 | 11 | 0 |
| D | 0 | 11 | 0 |
| Mode SS | |||
|---|---|---|---|
| Quadrant | BADHDUFLAG | Total packets | Discarded packets |
| A | 0 | 126 | 63 |
| B | 0 | 126 | 63 |
| C | 0 | 126 | 63 |
| D | 0 | 126 | 63 |
| Mode M0 | |||
|---|---|---|---|
| Quadrant | BADHDUFLAG | Total packets | Discarded packets |
| A | 0 | 13051 | 1 |
| B | 0 | 14038 | 1 |
| C | 0 | 16454 | 1 |
| D | 0 | 20966 | 1 |
| Quadrant | Total seconds | Saturated seconds | Saturation percentage |
|---|---|---|---|
| A | 6240 | 40 | 0.641026% |
| B | 6241 | 85 | 1.361961% |
| C | 6240 | 155 | 2.483974% |
| D | 6240 | 829 | 13.285256% |
Noise dominated data is calculated using 1-second bins in cleaned event files. If a bin has >2000 counts, and if more than 50% of those come from <1% of pixels, then it is considered to be noise-dominated and hence unusable.
| Quadrant | # 1 sec bins | Bins with >0 counts | Bins with >2000 counts | High rate bins dominated by noise | Noise dominated (total time) | Noise dominated (detector-on time) | Marked lightcurve |
|---|---|---|---|---|---|---|---|
| A | 7330 | 6240 | 0 | 0 | 0.00% | 0.00% | 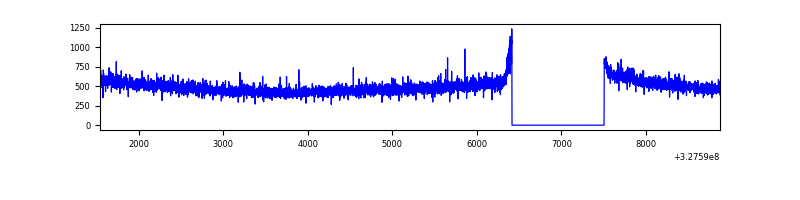 |
| B | 7331 | 6242 | 31 | 31 | 0.42% | 0.50% | 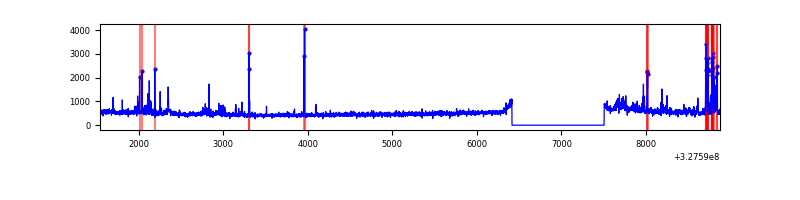 |
| C | 7330 | 6240 | 29 | 29 | 0.40% | 0.46% | 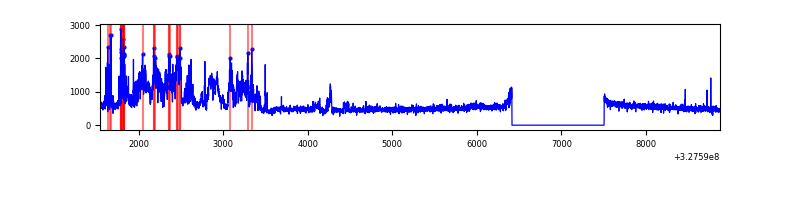 |
| D | 7330 | 6240 | 586 | 586 | 7.99% | 9.39% | 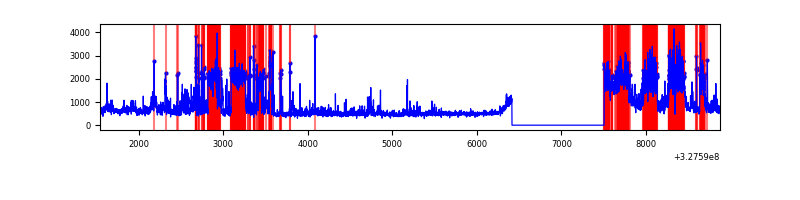 |
Top three noisy pixels from each quadrant. If the there are fewer than three noisy pixels in the level2.evt file, extra rows are filled as -1
| Pixel properties | Quadrant properties | ||||||
|---|---|---|---|---|---|---|---|
| Quadrant | DetID | PixID | Counts | Sigma | Mean | Median | Sigma |
| A | 10 | 17 | 78234 | 495.11 | 774 | 757 | 156.5 |
| A | 13 | 254 | 9490 | 55.81 | 774 | 757 | 156.5 |
| A | 0 | 226 | 6924 | 39.41 | 774 | 757 | 156.5 |
| B | 0 | 229 | 148306 | 999.33 | 773 | 753 | 147.7 |
| B | 5 | 172 | 89184 | 598.92 | 773 | 753 | 147.7 |
| B | 0 | 190 | 55264 | 369.19 | 773 | 753 | 147.7 |
| C | 7 | 247 | 1112250 | 6420.28 | 738 | 744 | 173.1 |
| C | 14 | 238 | 118112 | 677.94 | 738 | 744 | 173.1 |
| C | 2 | 16 | 46079 | 261.86 | 738 | 744 | 173.1 |
| D | 1 | 52 | 847670 | 4818.36 | 729 | 709 | 175.8 |
| D | 1 | 3 | 620080 | 3523.6 | 729 | 709 | 175.8 |
| D | 8 | 195 | 365730 | 2076.6 | 729 | 709 | 175.8 |
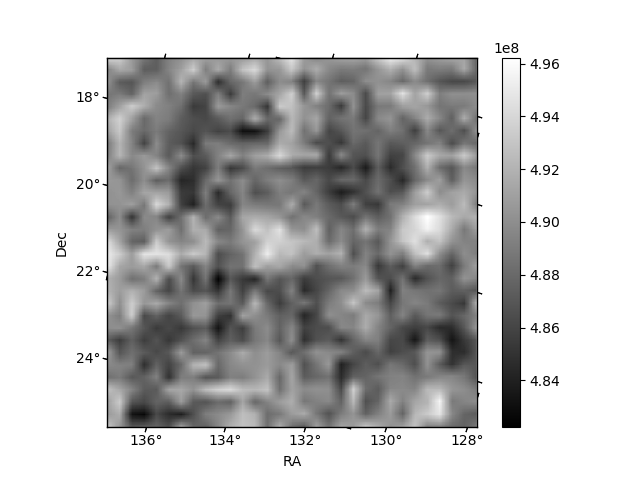
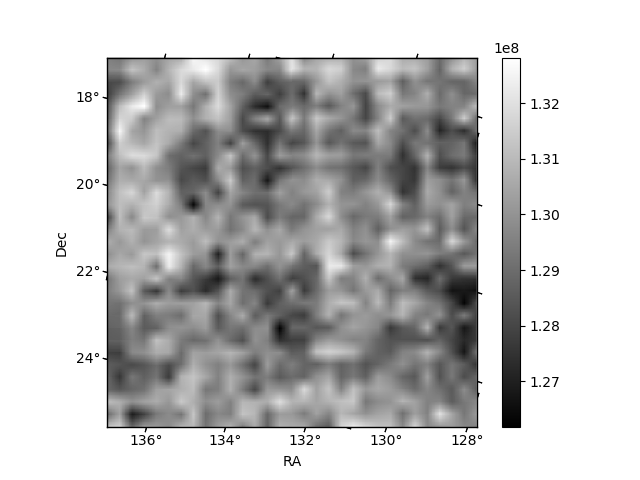
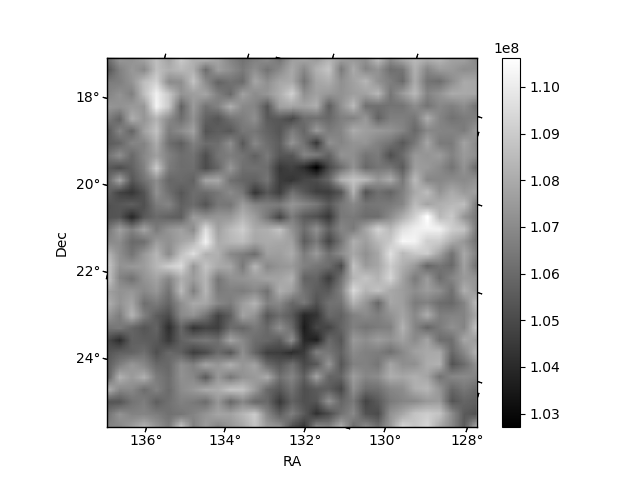
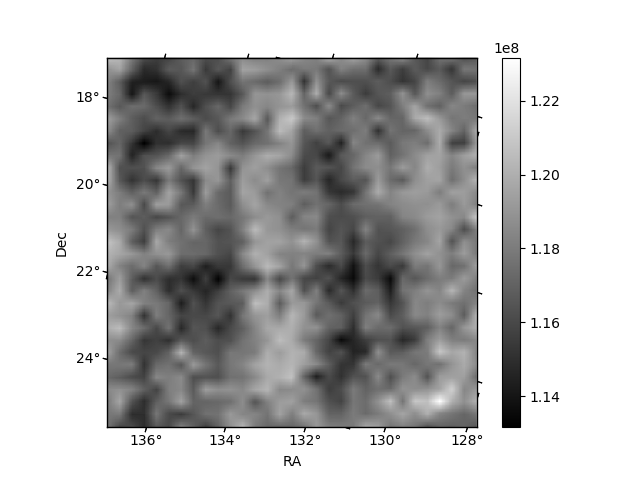
Histogram calculated using DETX and DETY for each event in the final _common_clean file
| Quadrant A | 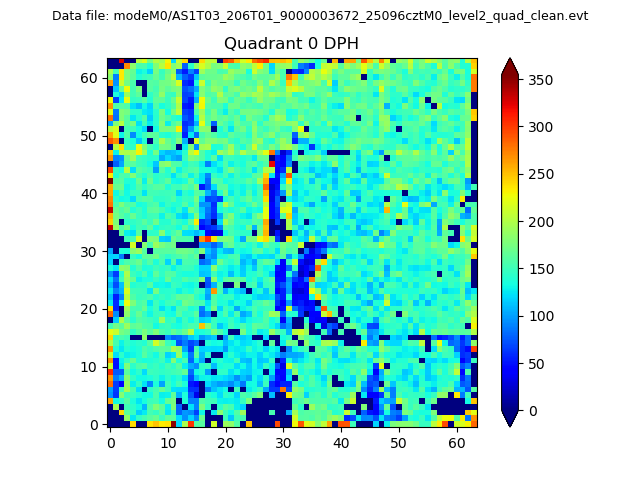 |
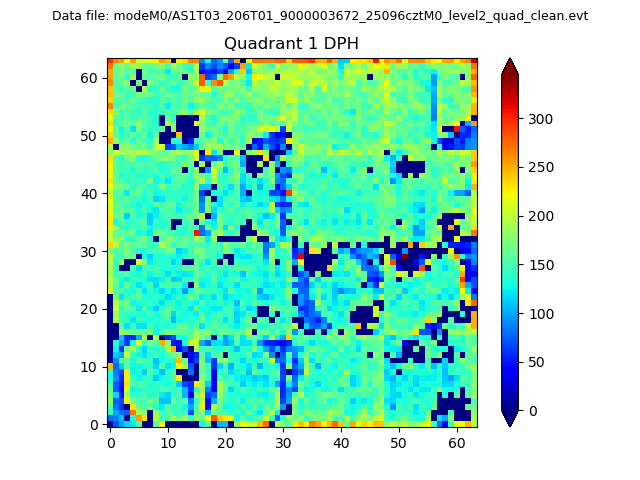 |
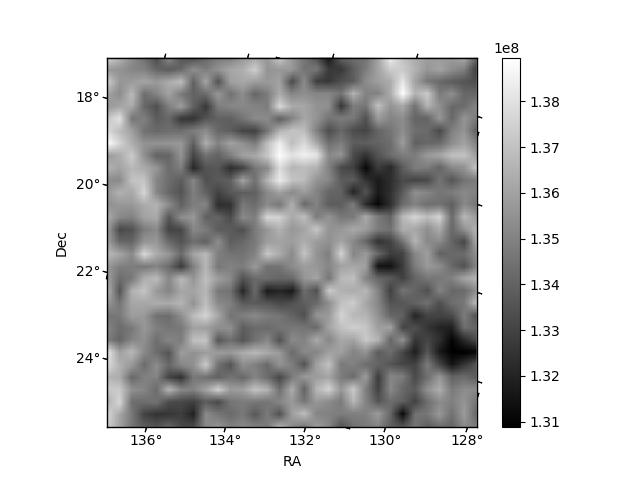
Quadrant B |
|---|---|---|---|
| Quadrant D | 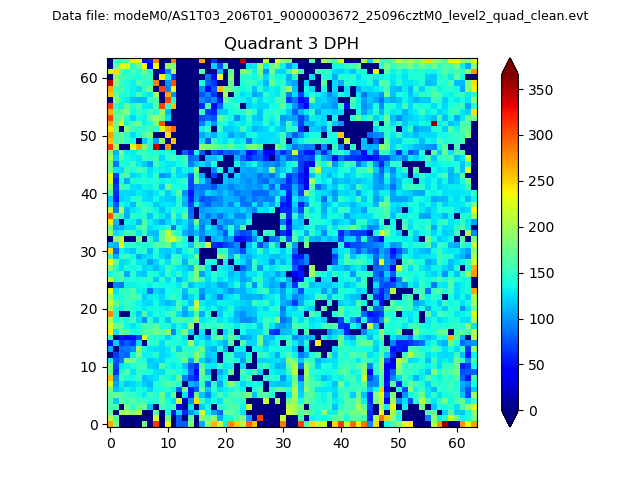 |
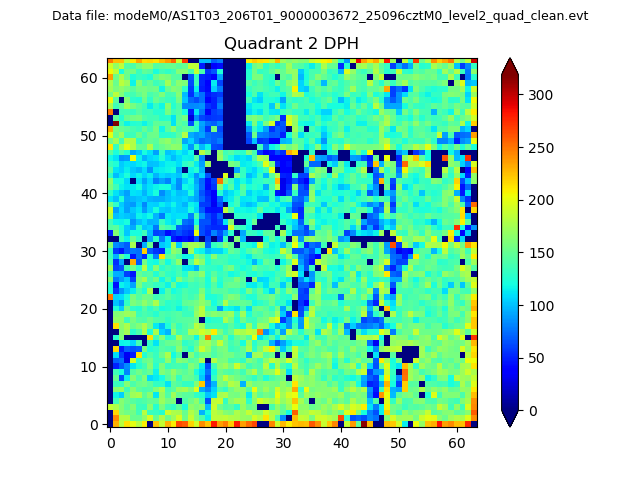 |
Quadrant C |
| Plot type | Count rate plots | Images |
|---|---|---|
| Comparison with Poisson distribution Blue bars denote a histogram of data divided into 1 sec bins. Red curve is a Poisson curve with rate = median count rate of data. |
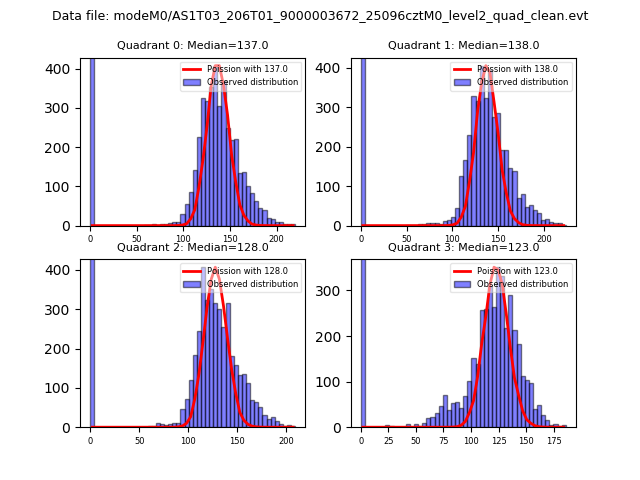 |
 |
| Quadrant-wise count rates Data is divided into 100 sec bins |
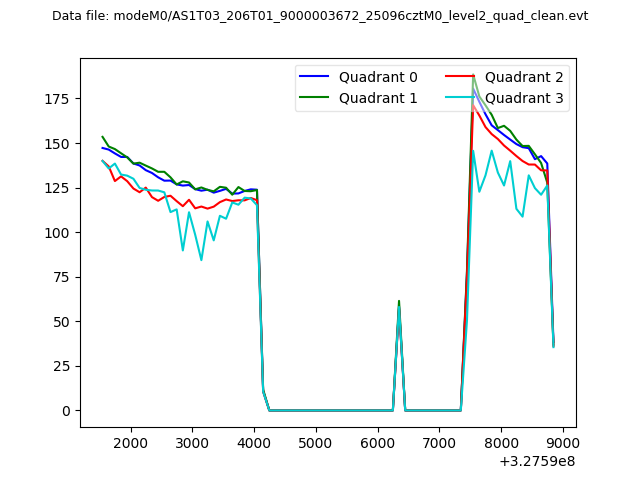 |
|
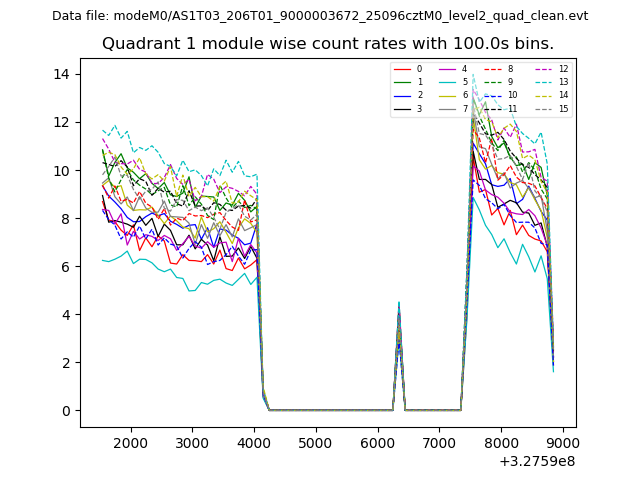
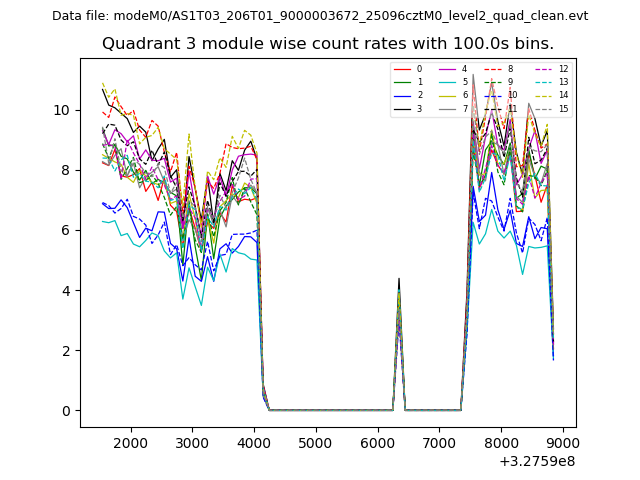
| Module-wise count rates for Quadrant A Data is divided into 100 sec bins |
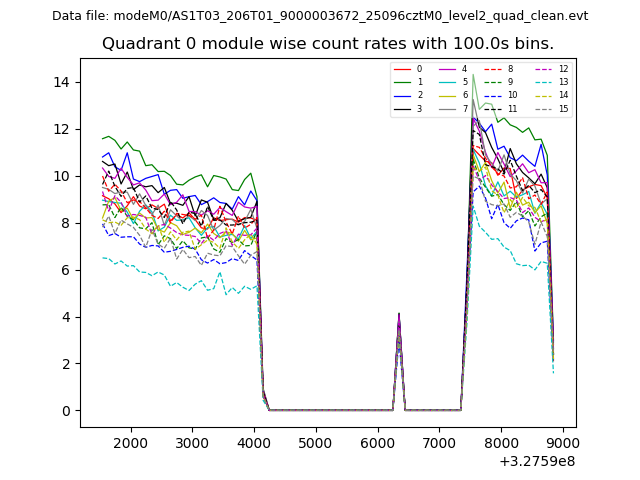 |
 |
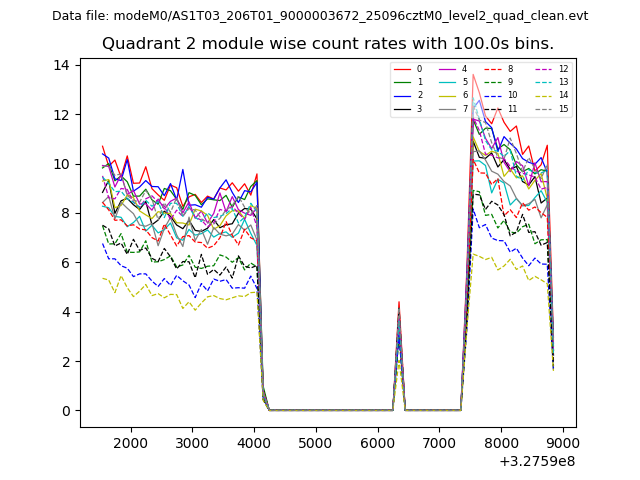
| Module-wise count rates for Quadrant B Data is divided into 100 sec bins |
 |
 |
| Module-wise count rates for Quadrant C Data is divided into 100 sec bins |
 |
 |
| Module-wise count rates for Quadrant D Data is divided into 100 sec bins |
 |
 |
| Parameter | Plot |
|---|---|
| CZT HV Monitor | 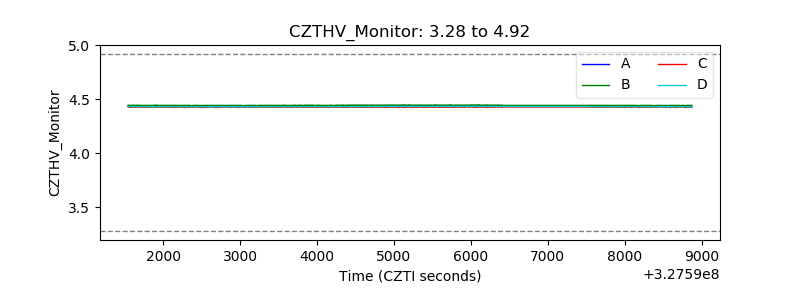 |
| D_VDD | 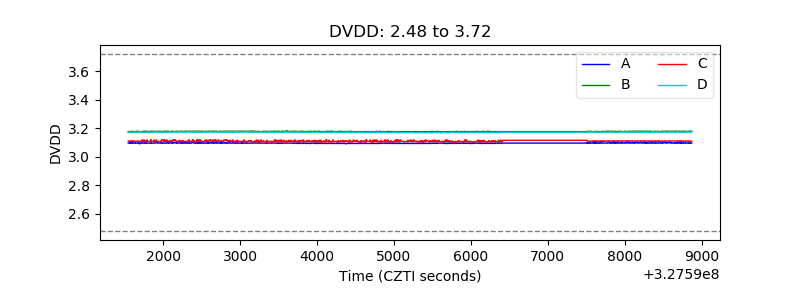 |
| Temperature 1 | 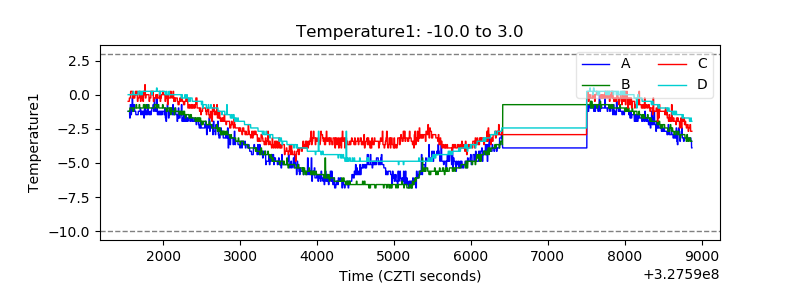 |
| Veto HV Monitor | 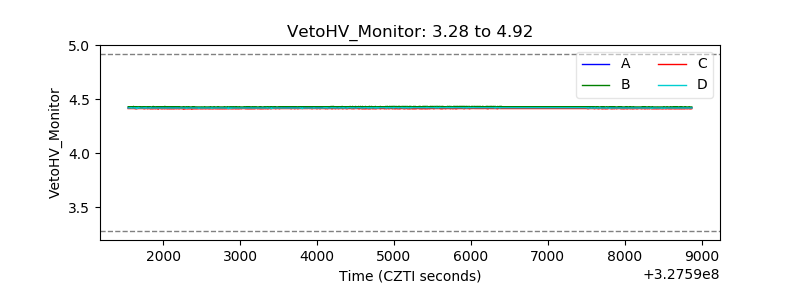 |
| Veto LLD | 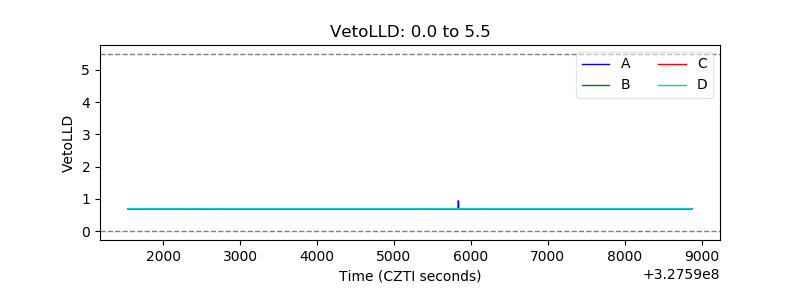 |
| Alpha Counter | 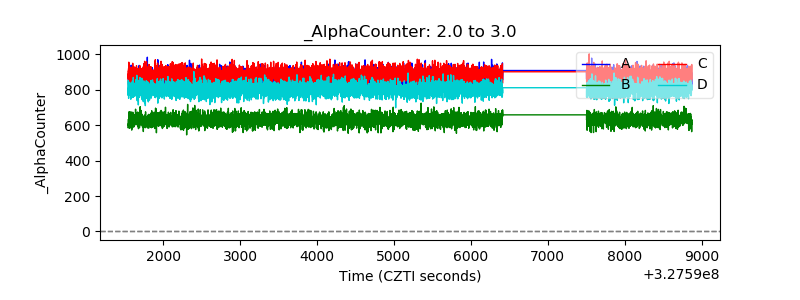 |
| _CPM_Rate | 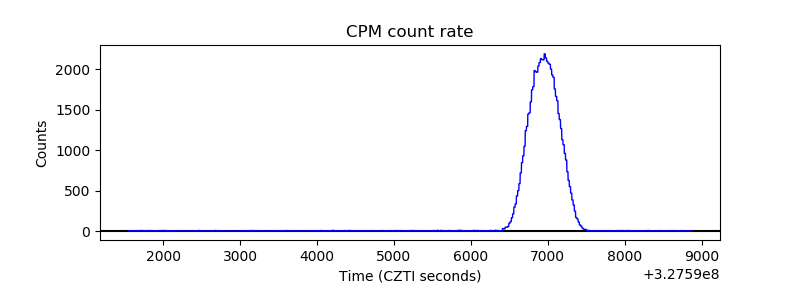 |
| CZT Counter | 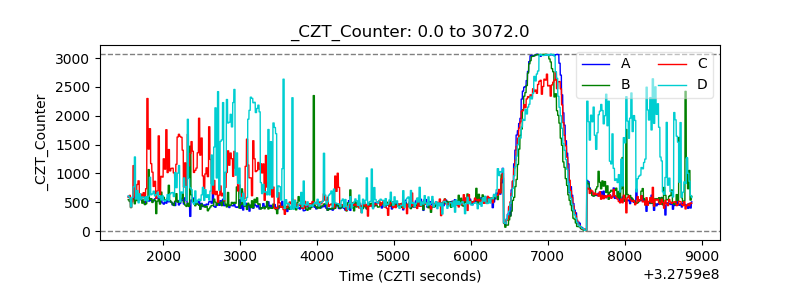 |
| +2.5 Volts monitor |  |
| +5 Volts monitor |  |
| _ROLL_ROT | 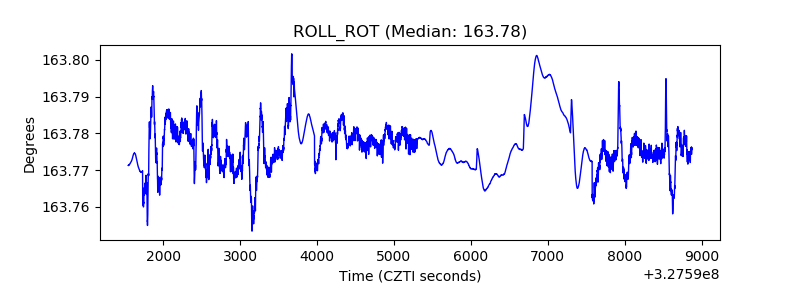 |
| _Roll_DEC | 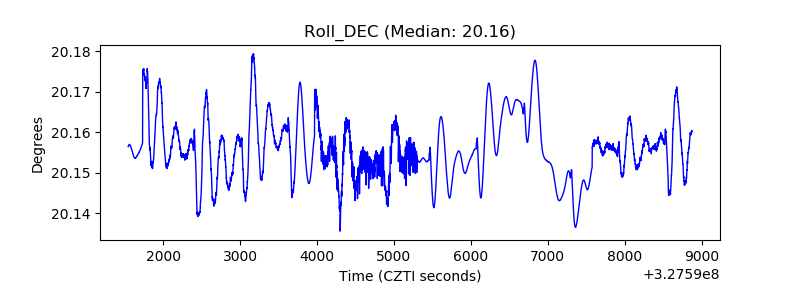 |
| _Roll_RA | 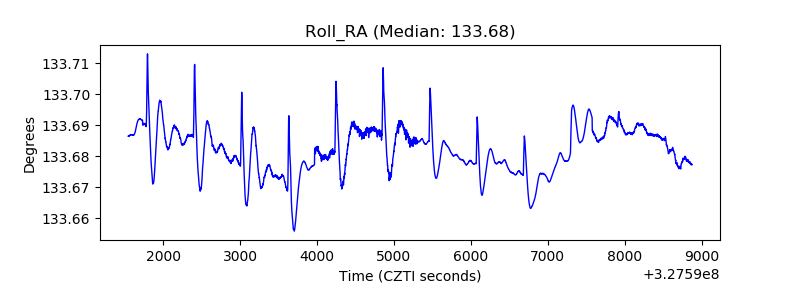 |
| Veto Counter | 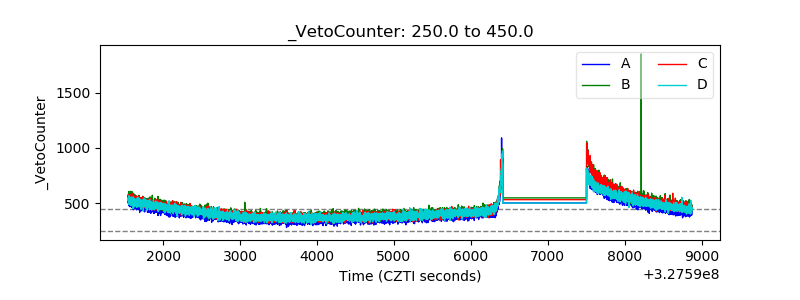 |