| Param | Original file | Final file |
|---|---|---|
| Filename | modeM0/AS1T03_206T01_9000003672_25097cztM0_level2.evt | modeM0/AS1T03_206T01_9000003672_25097cztM0_level2_quad_clean.evt |
| Size (bytes) | 476,680,320 | 87,099,840 |
| Size | 454.6 MB | 83.1 MB |
| Events in quadrant A | 3,036,958 | 572,330 |
| Events in quadrant B | 3,395,887 | 581,496 |
| Events in quadrant C | 3,097,126 | 546,663 |
| Events in quadrant D | 4,495,258 | 514,152 |
| Mode M9 | |||
|---|---|---|---|
| Quadrant | BADHDUFLAG | Total packets | Discarded packets |
| A | 0 | 13 | 0 |
| B | 0 | 13 | 0 |
| C | 0 | 13 | 0 |
| D | 0 | 13 | 0 |
| Mode M0 | |||
|---|---|---|---|
| Quadrant | BADHDUFLAG | Total packets | Discarded packets |
| A | 0 | 12793 | 0 |
| B | 0 | 14031 | 0 |
| C | 0 | 12965 | 0 |
| D | 0 | 17429 | 0 |
| Quadrant | Total seconds | Saturated seconds | Saturation percentage |
|---|---|---|---|
| A | 6060 | 43 | 0.709571% |
| B | 6061 | 102 | 1.682891% |
| C | 6061 | 96 | 1.583897% |
| D | 6061 | 357 | 5.890117% |
Noise dominated data is calculated using 1-second bins in cleaned event files. If a bin has >2000 counts, and if more than 50% of those come from <1% of pixels, then it is considered to be noise-dominated and hence unusable.
| Quadrant | # 1 sec bins | Bins with >0 counts | Bins with >2000 counts | High rate bins dominated by noise | Noise dominated (total time) | Noise dominated (detector-on time) | Marked lightcurve |
|---|---|---|---|---|---|---|---|
| A | 7265 | 6061 | 0 | 0 | 0.00% | 0.00% | 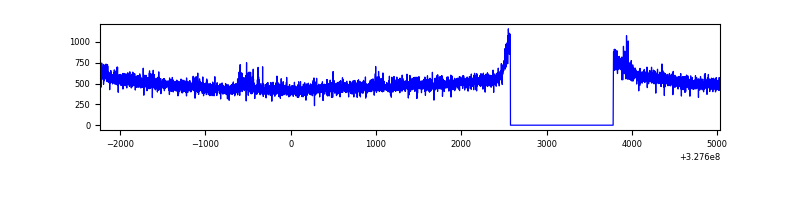 |
| B | 7266 | 6062 | 37 | 37 | 0.51% | 0.61% | 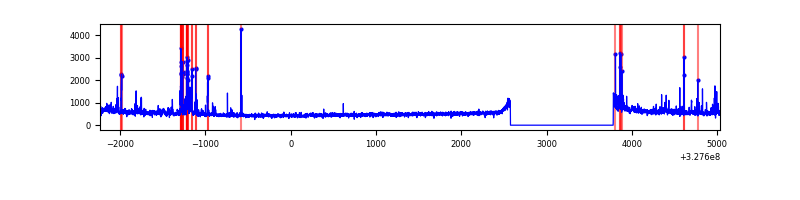 |
| C | 7266 | 6062 | 8 | 8 | 0.11% | 0.13% | 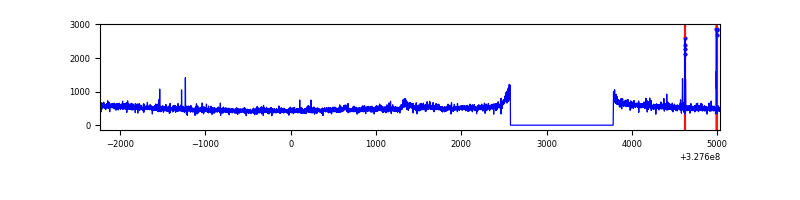 |
| D | 7266 | 6062 | 286 | 286 | 3.94% | 4.72% | 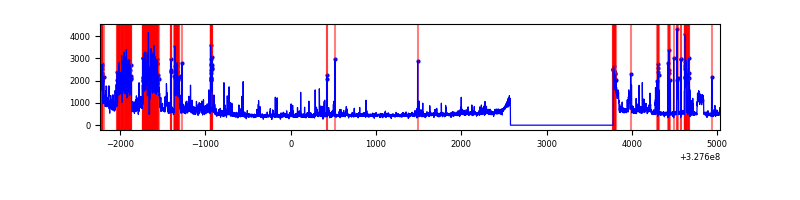 |
Top three noisy pixels from each quadrant. If the there are fewer than three noisy pixels in the level2.evt file, extra rows are filled as -1
| Pixel properties | Quadrant properties | ||||||
|---|---|---|---|---|---|---|---|
| Quadrant | DetID | PixID | Counts | Sigma | Mean | Median | Sigma |
| A | 10 | 17 | 28359 | 177.57 | 772 | 757 | 155.4 |
| A | 15 | 223 | 26830 | 167.74 | 772 | 757 | 155.4 |
| A | 13 | 254 | 9814 | 58.27 | 772 | 757 | 155.4 |
| B | 0 | 229 | 188048 | 1281.39 | 772 | 751 | 146.2 |
| B | 5 | 172 | 83282 | 564.63 | 772 | 751 | 146.2 |
| B | 0 | 190 | 60403 | 408.11 | 772 | 751 | 146.2 |
| C | 14 | 238 | 118660 | 684.94 | 740 | 745 | 172.2 |
| C | 7 | 247 | 49986 | 286.03 | 740 | 745 | 172.2 |
| C | 0 | 207 | 31338 | 177.71 | 740 | 745 | 172.2 |
| D | 1 | 3 | 724128 | 4032.88 | 738 | 718 | 179.4 |
| D | 8 | 195 | 244759 | 1360.48 | 738 | 718 | 179.4 |
| D | 2 | 244 | 208320 | 1157.34 | 738 | 718 | 179.4 |
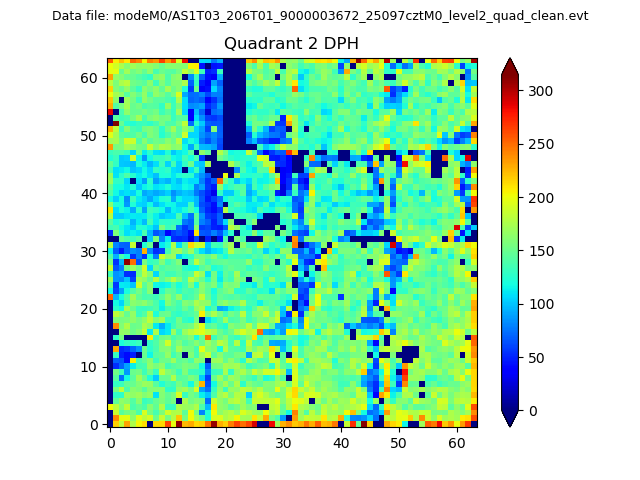
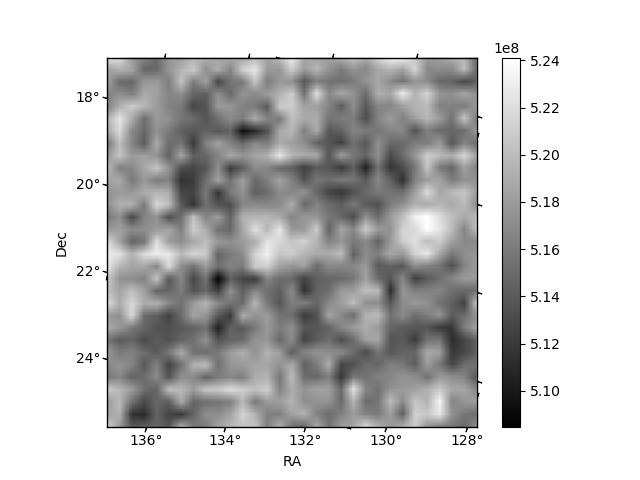
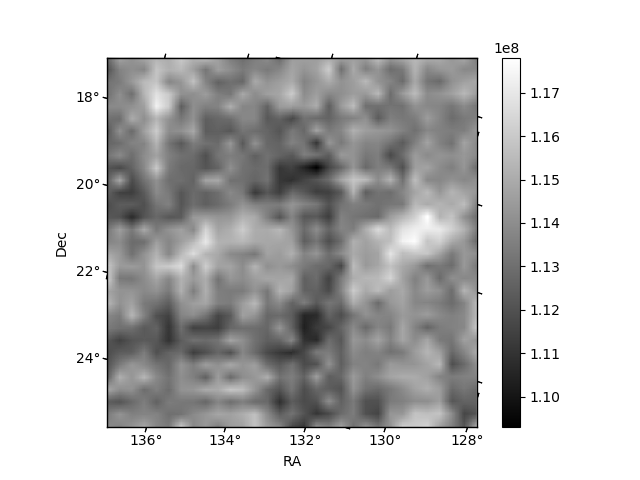
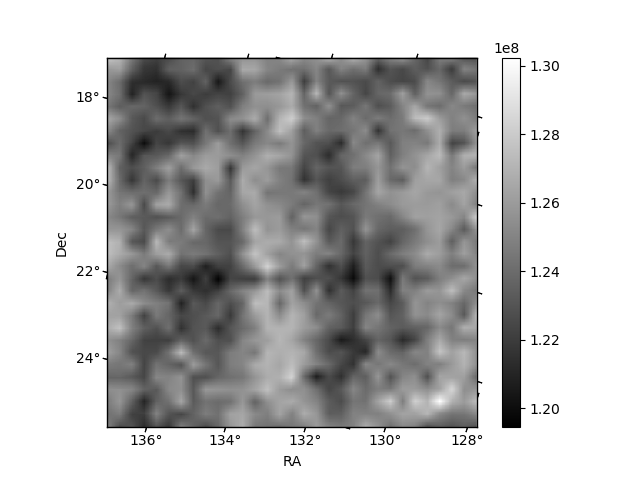
Histogram calculated using DETX and DETY for each event in the final _common_clean file
| Quadrant A | 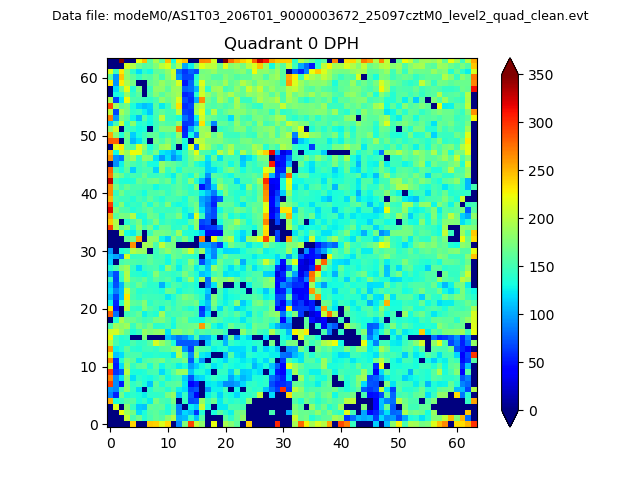 |
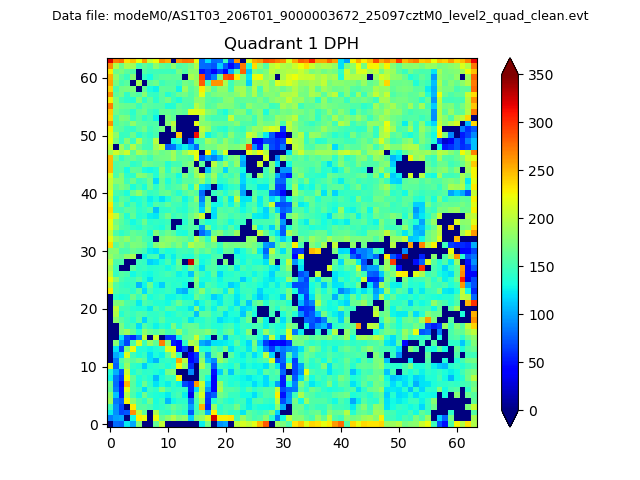 |
Quadrant B |
|---|---|---|---|
| Quadrant D | 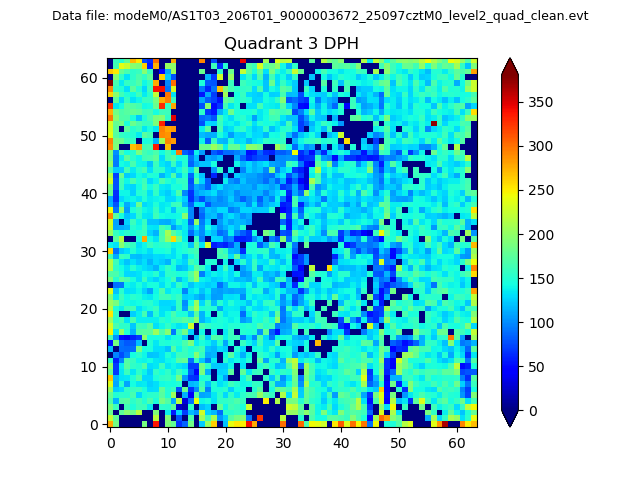 |
 |
Quadrant C |
| Plot type | Count rate plots | Images |
|---|---|---|
| Comparison with Poisson distribution Blue bars denote a histogram of data divided into 1 sec bins. Red curve is a Poisson curve with rate = median count rate of data. |
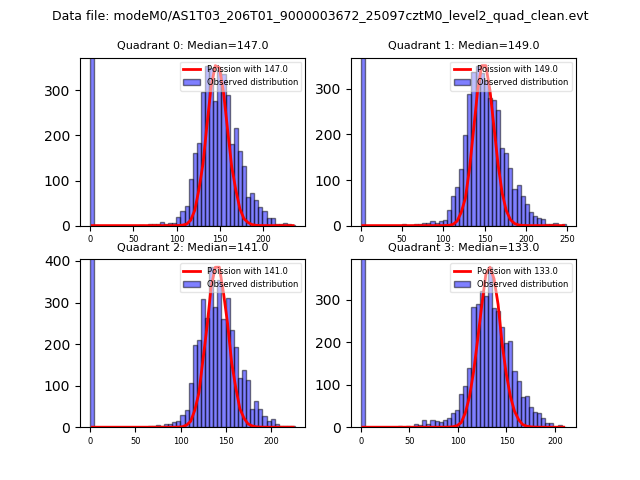 |
 |
| Quadrant-wise count rates Data is divided into 100 sec bins |
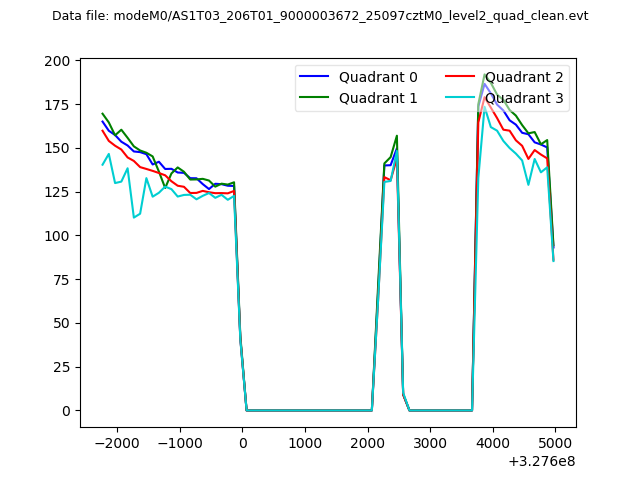 |
|
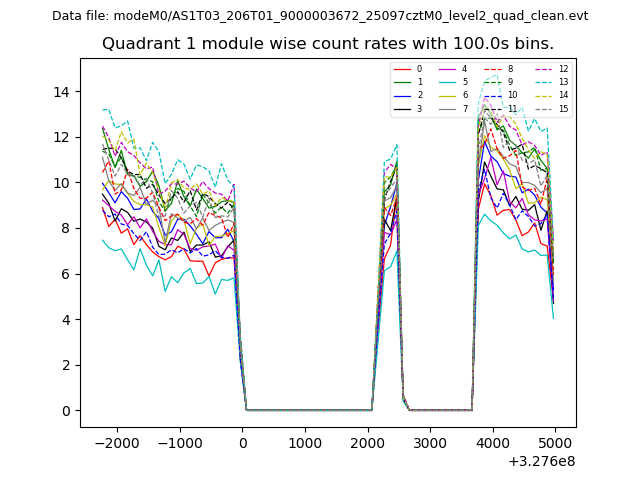
| Module-wise count rates for Quadrant A Data is divided into 100 sec bins |
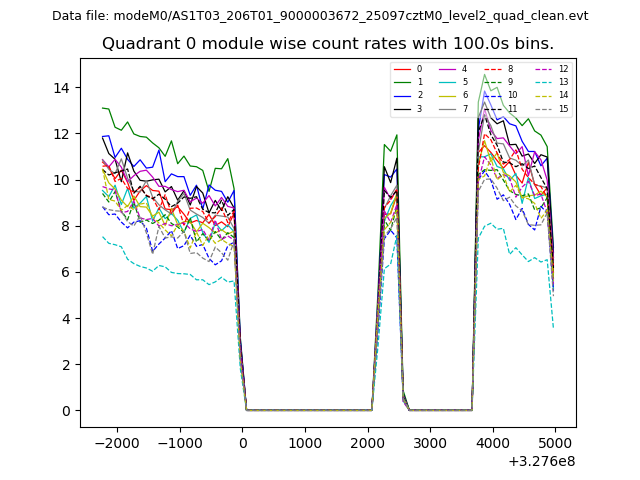 |
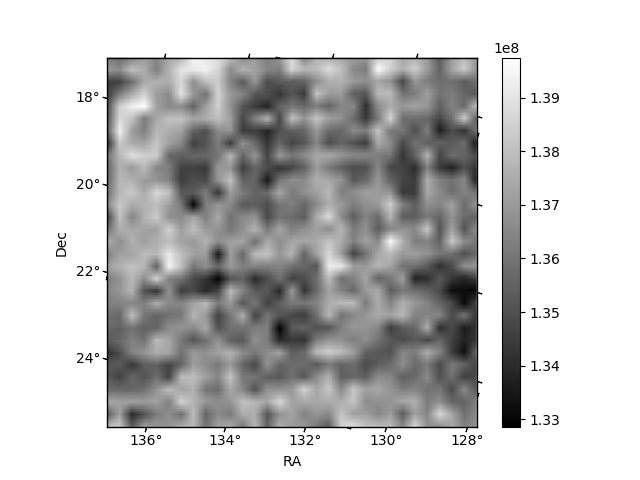 |
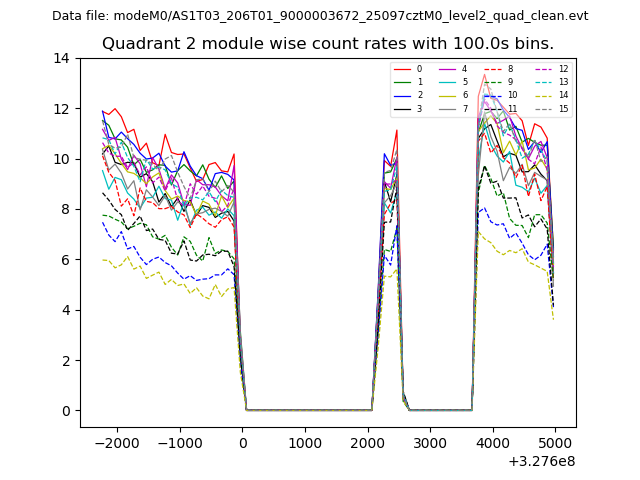
| Module-wise count rates for Quadrant B Data is divided into 100 sec bins |
 |
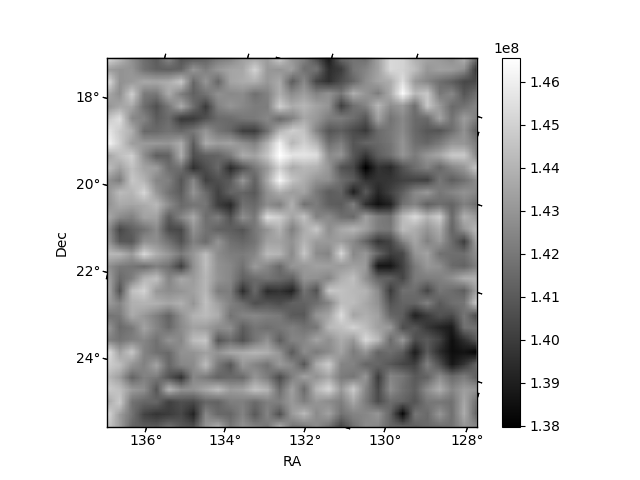 |
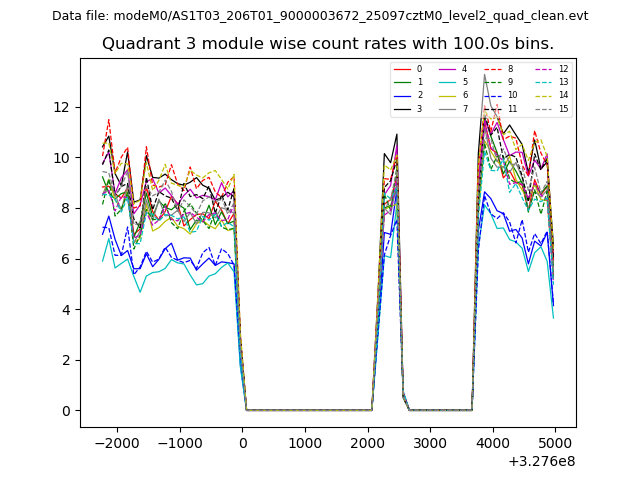
| Module-wise count rates for Quadrant C Data is divided into 100 sec bins |
 |
 |
| Module-wise count rates for Quadrant D Data is divided into 100 sec bins |
 |
 |
| Parameter | Plot |
|---|---|
| CZT HV Monitor | 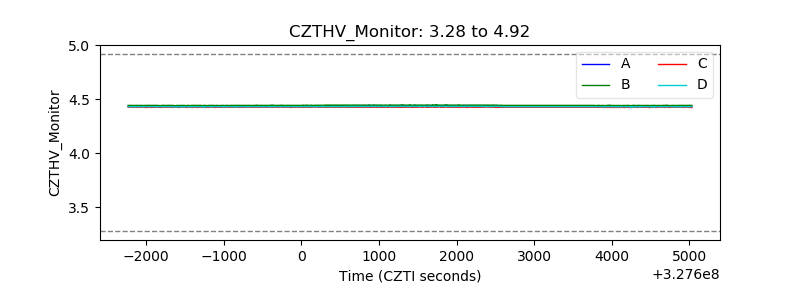 |
| D_VDD | 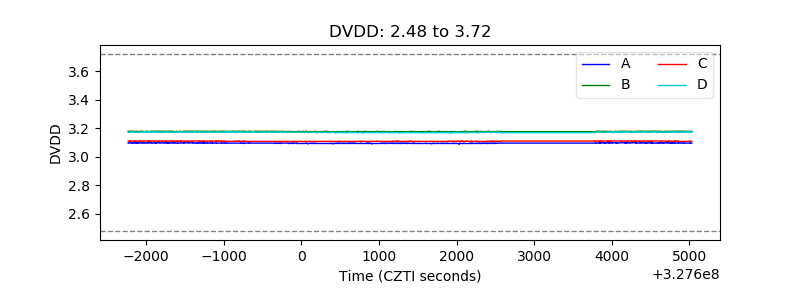 |
| Temperature 1 | 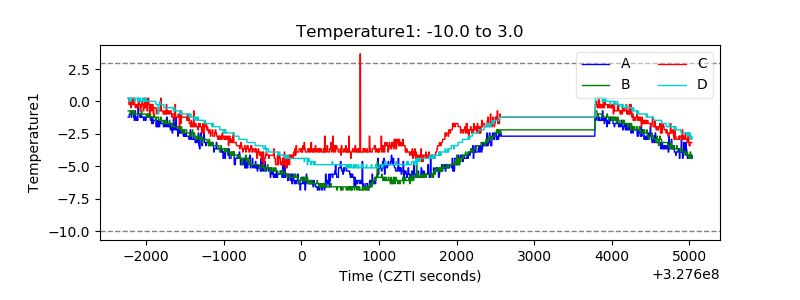 |
| Veto HV Monitor | 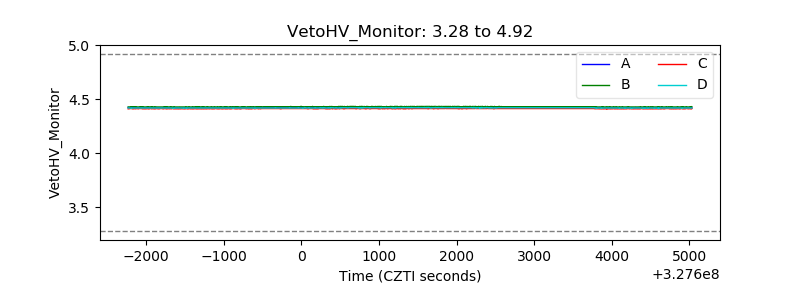 |
| Veto LLD | 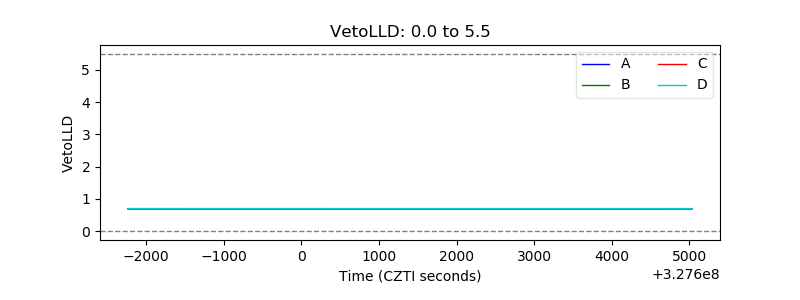 |
| Alpha Counter | 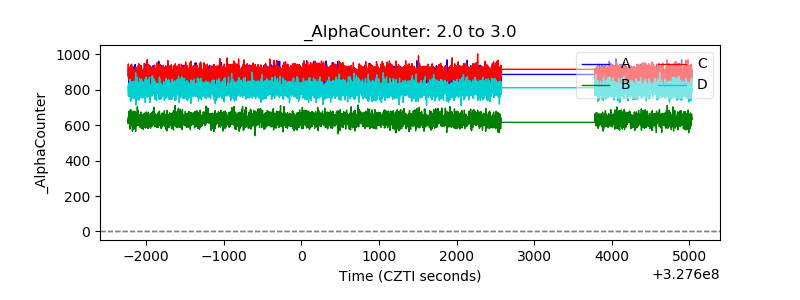 |
| _CPM_Rate | 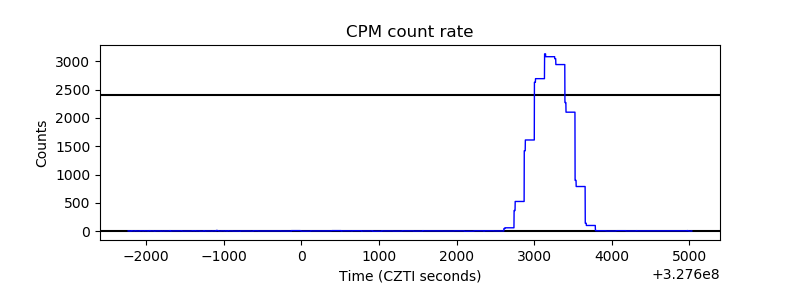 |
| CZT Counter | 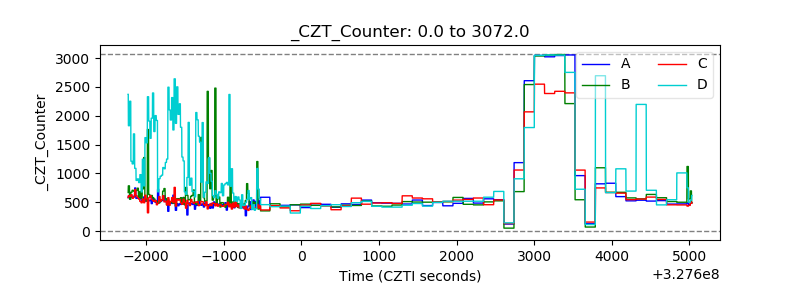 |
| +2.5 Volts monitor |  |
| +5 Volts monitor |  |
| _ROLL_ROT | 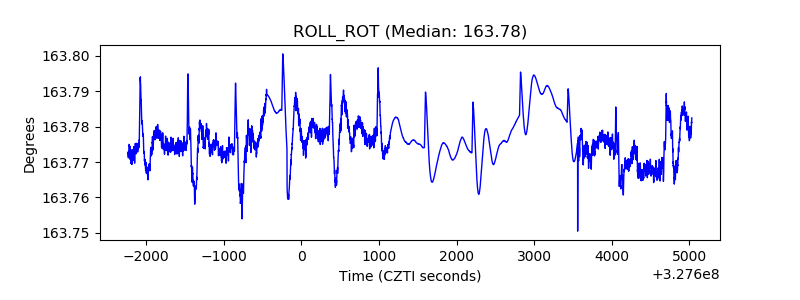 |
| _Roll_DEC |  |
| _Roll_RA | 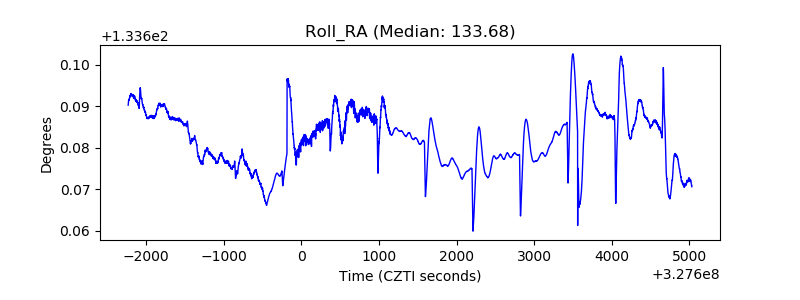 |
| Veto Counter | 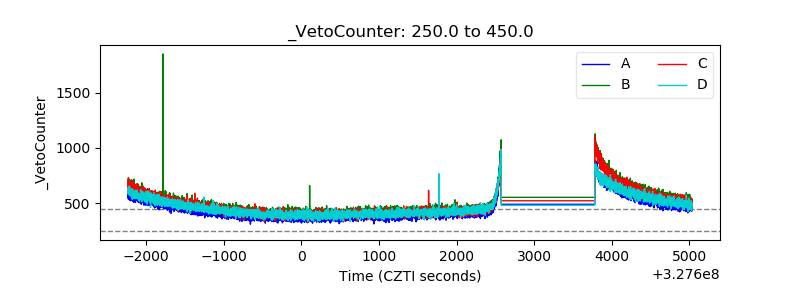 |