| Param | Original file | Final file |
|---|---|---|
| Filename | modeM0/AS1T03_206T01_9000003672_25098cztM0_level2.evt | modeM0/AS1T03_206T01_9000003672_25098cztM0_level2_quad_clean.evt |
| Size (bytes) | 454,642,560 | 85,919,040 |
| Size | 433.6 MB | 81.9 MB |
| Events in quadrant A | 2,939,757 | 564,944 |
| Events in quadrant B | 3,192,606 | 583,400 |
| Events in quadrant C | 3,174,535 | 536,942 |
| Events in quadrant D | 4,065,681 | 508,435 |
| Mode M9 | |||
|---|---|---|---|
| Quadrant | BADHDUFLAG | Total packets | Discarded packets |
| A | 0 | 13 | 0 |
| B | 0 | 13 | 0 |
| C | 0 | 13 | 0 |
| D | 0 | 13 | 0 |
| Mode M0 | |||
|---|---|---|---|
| Quadrant | BADHDUFLAG | Total packets | Discarded packets |
| A | 0 | 12279 | 0 |
| B | 0 | 13139 | 0 |
| C | 0 | 12946 | 0 |
| D | 0 | 15934 | 0 |
| Quadrant | Total seconds | Saturated seconds | Saturation percentage |
|---|---|---|---|
| A | 5845 | 20 | 0.342173% |
| B | 5844 | 39 | 0.667351% |
| C | 5844 | 81 | 1.386037% |
| D | 5844 | 120 | 2.053388% |
Noise dominated data is calculated using 1-second bins in cleaned event files. If a bin has >2000 counts, and if more than 50% of those come from <1% of pixels, then it is considered to be noise-dominated and hence unusable.
| Quadrant | # 1 sec bins | Bins with >0 counts | Bins with >2000 counts | High rate bins dominated by noise | Noise dominated (total time) | Noise dominated (detector-on time) | Marked lightcurve |
|---|---|---|---|---|---|---|---|
| A | 7160 | 5846 | 0 | 0 | 0.00% | 0.00% | 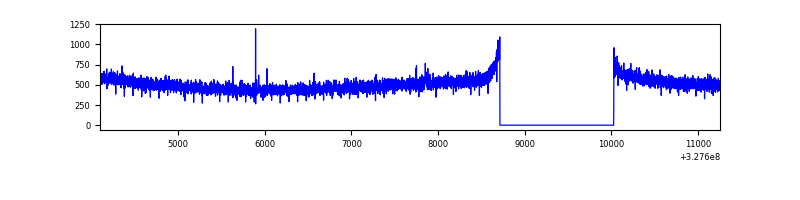 |
| B | 7159 | 5845 | 6 | 6 | 0.08% | 0.10% | 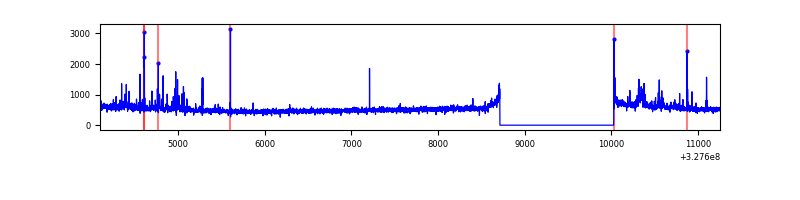 |
| C | 7159 | 5845 | 15 | 15 | 0.21% | 0.26% | 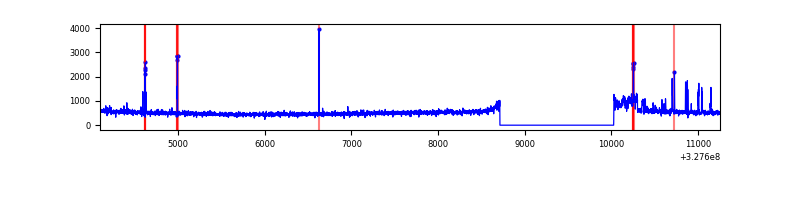 |
| D | 7159 | 5845 | 93 | 93 | 1.30% | 1.59% | 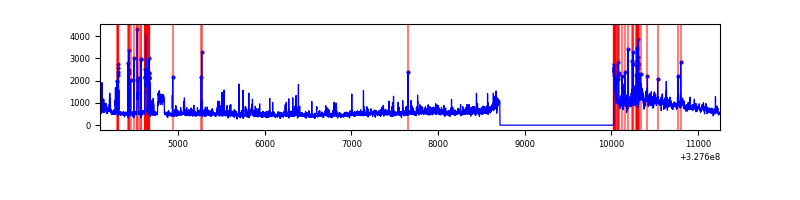 |
Top three noisy pixels from each quadrant. If the there are fewer than three noisy pixels in the level2.evt file, extra rows are filled as -1
| Pixel properties | Quadrant properties | ||||||
|---|---|---|---|---|---|---|---|
| Quadrant | DetID | PixID | Counts | Sigma | Mean | Median | Sigma |
| A | 13 | 254 | 10170 | 61.72 | 760 | 748 | 152.7 |
| A | 0 | 226 | 6780 | 39.51 | 760 | 748 | 152.7 |
| A | 3 | 137 | 6505 | 37.71 | 760 | 748 | 152.7 |
| B | 0 | 229 | 78729 | 541.69 | 767 | 751 | 144.0 |
| B | 0 | 190 | 58696 | 402.52 | 767 | 751 | 144.0 |
| B | 5 | 172 | 36187 | 246.16 | 767 | 751 | 144.0 |
| C | 7 | 247 | 168075 | 990.68 | 726 | 735 | 168.9 |
| C | 14 | 238 | 117594 | 691.83 | 726 | 735 | 168.9 |
| C | 0 | 207 | 42672 | 248.27 | 726 | 735 | 168.9 |
| D | 1 | 3 | 521476 | 2682.17 | 716 | 704 | 194.2 |
| D | 2 | 244 | 291164 | 1495.98 | 716 | 704 | 194.2 |
| D | 8 | 195 | 210871 | 1082.44 | 716 | 704 | 194.2 |
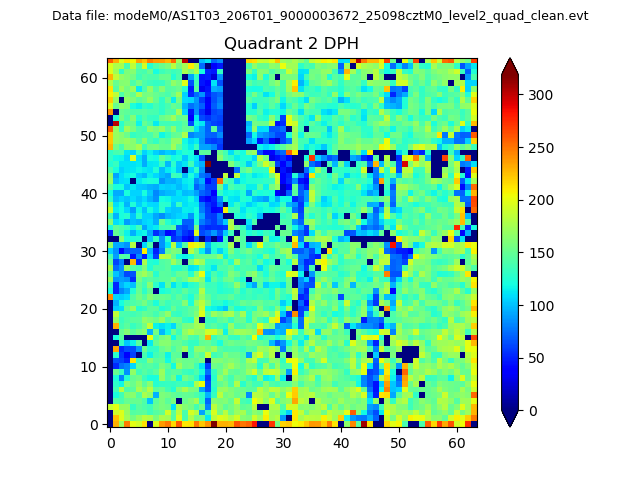
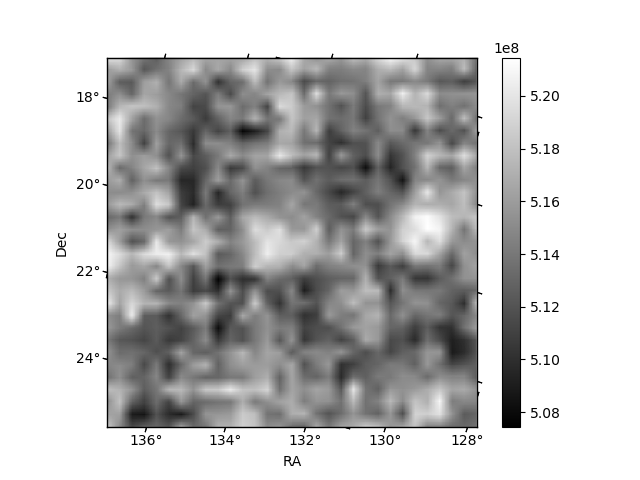
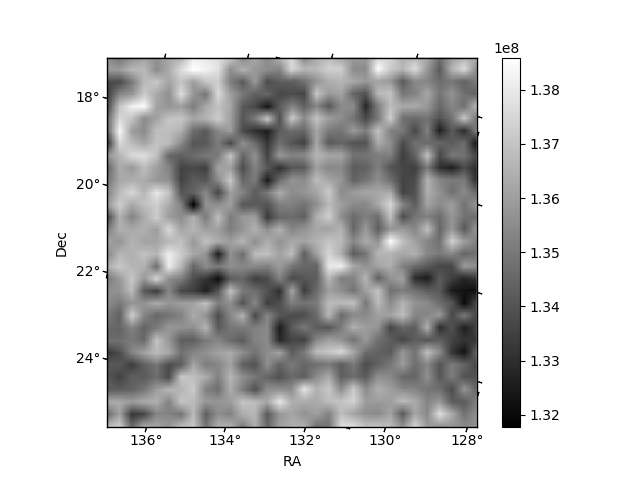
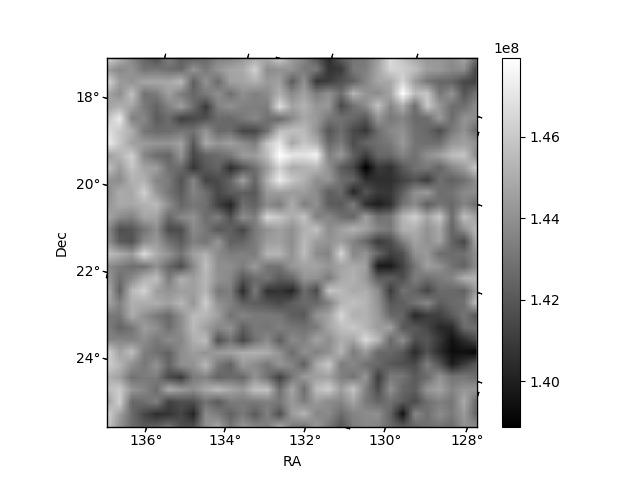
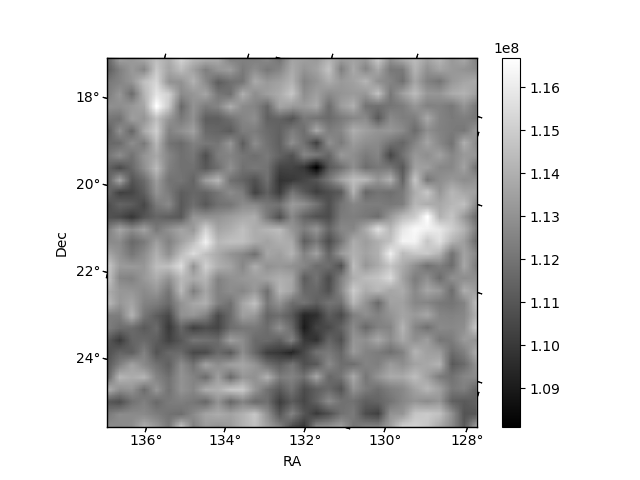
Histogram calculated using DETX and DETY for each event in the final _common_clean file
| Quadrant A | 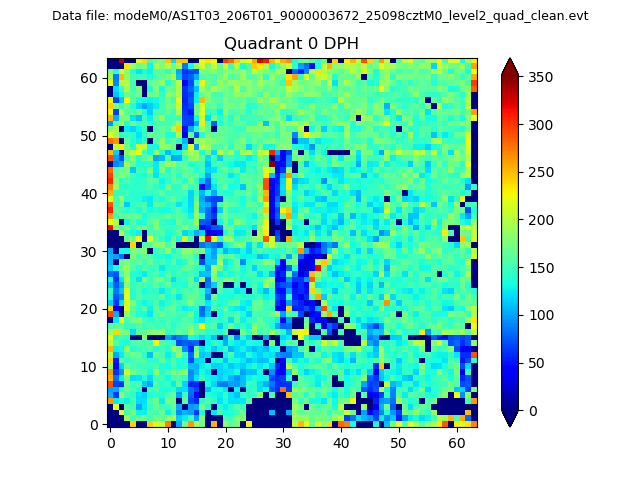 |
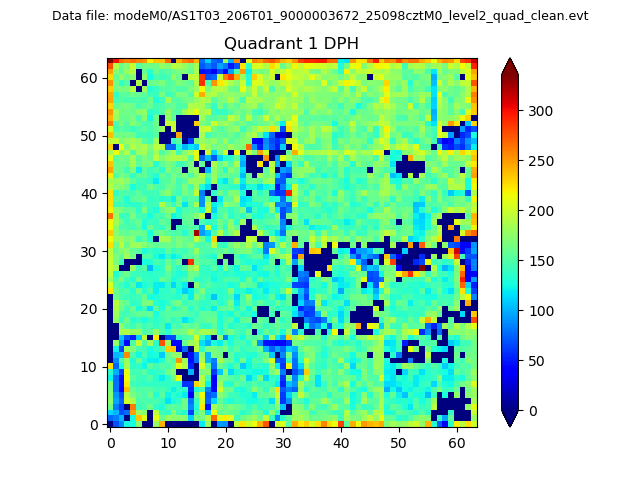 |
Quadrant B |
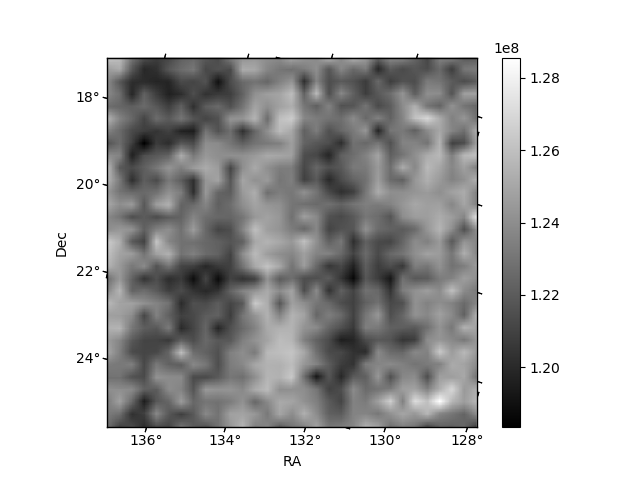
|---|---|---|---|
| Quadrant D | 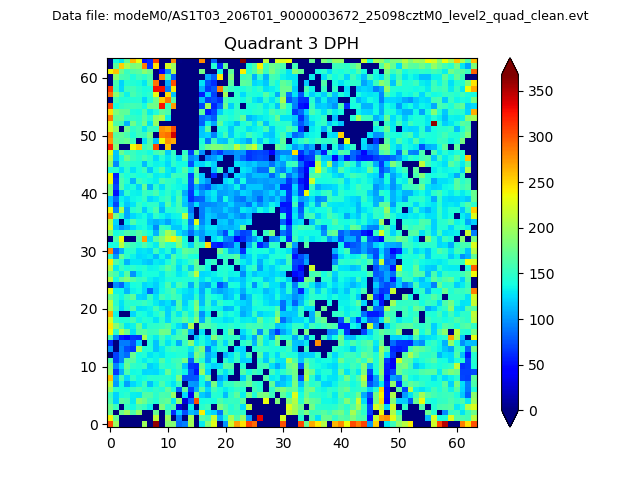 |
 |
Quadrant C |
| Plot type | Count rate plots | Images |
|---|---|---|
| Comparison with Poisson distribution Blue bars denote a histogram of data divided into 1 sec bins. Red curve is a Poisson curve with rate = median count rate of data. |
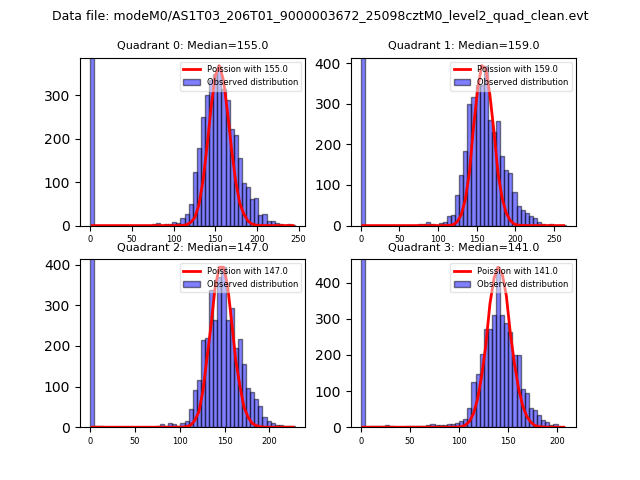 |
 |
| Quadrant-wise count rates Data is divided into 100 sec bins |
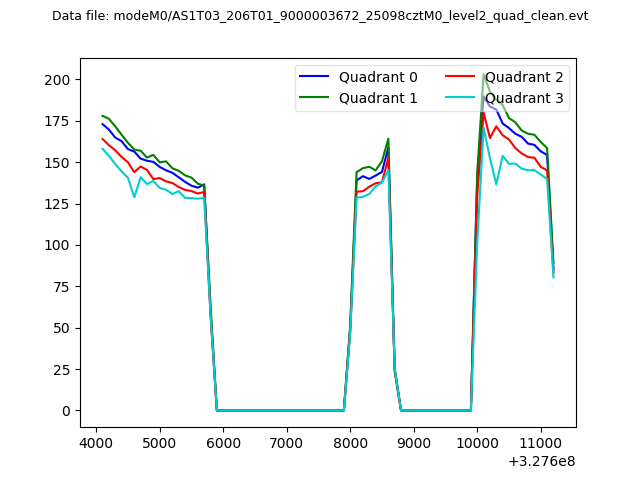 |
|
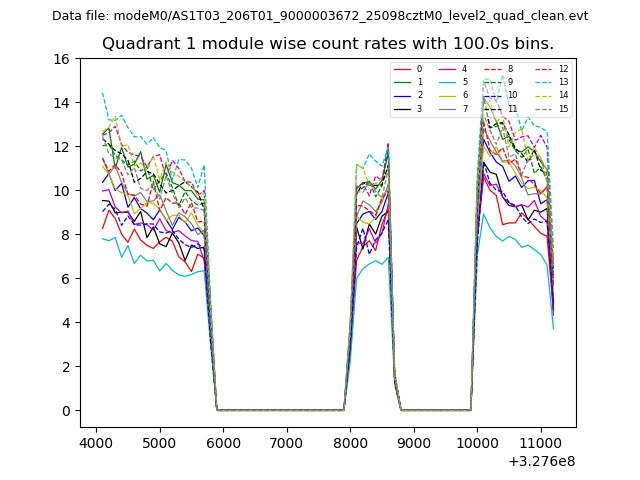
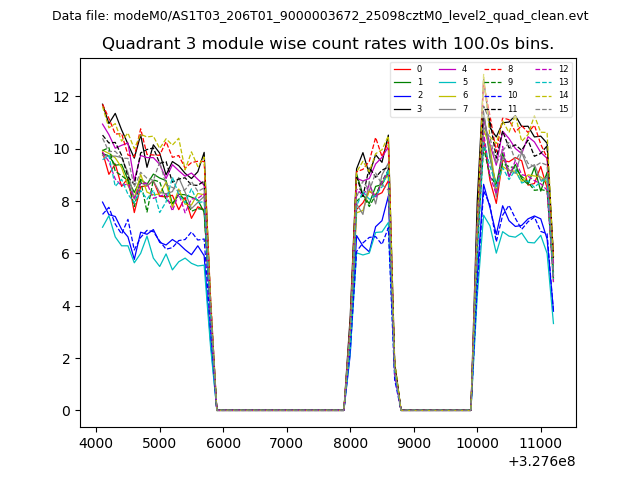
| Module-wise count rates for Quadrant A Data is divided into 100 sec bins |
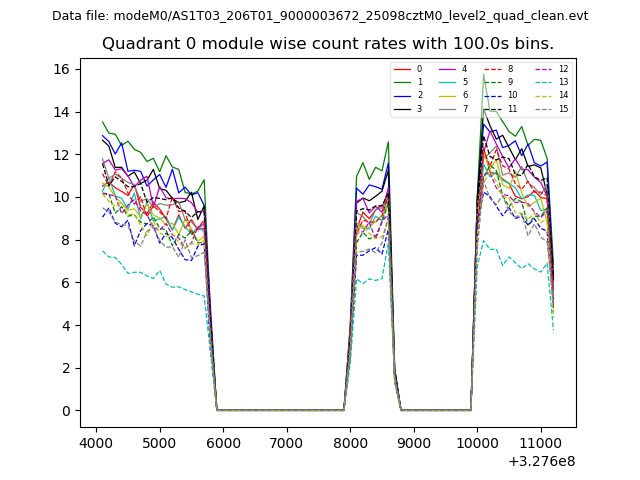 |
 |
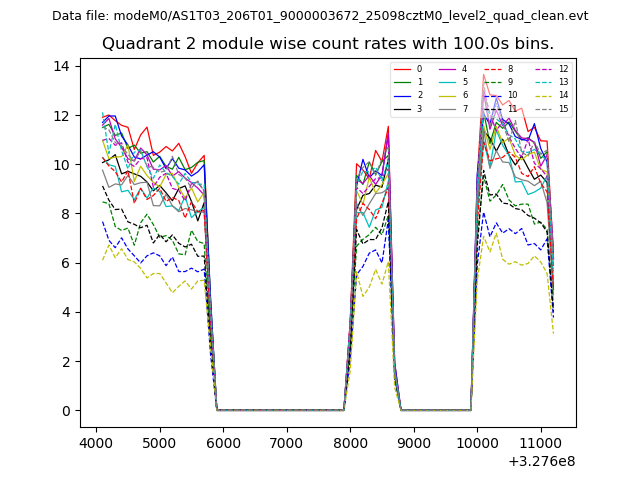
| Module-wise count rates for Quadrant B Data is divided into 100 sec bins |
 |
 |
| Module-wise count rates for Quadrant C Data is divided into 100 sec bins |
 |
 |
| Module-wise count rates for Quadrant D Data is divided into 100 sec bins |
 |
 |
| Parameter | Plot |
|---|---|
| CZT HV Monitor | 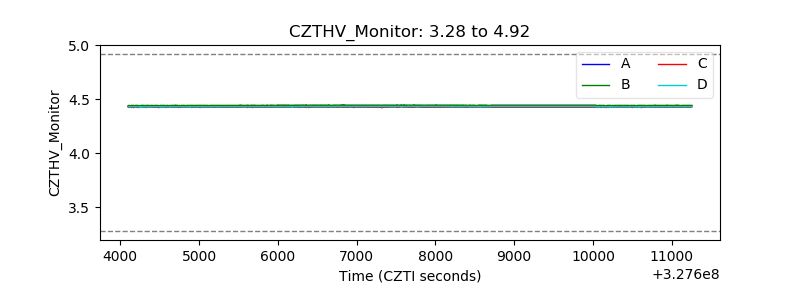 |
| D_VDD | 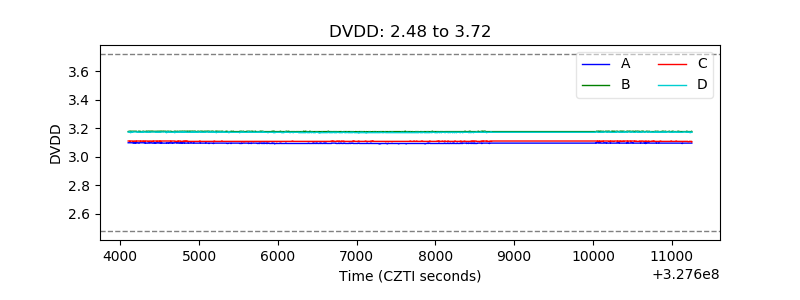 |
| Temperature 1 | 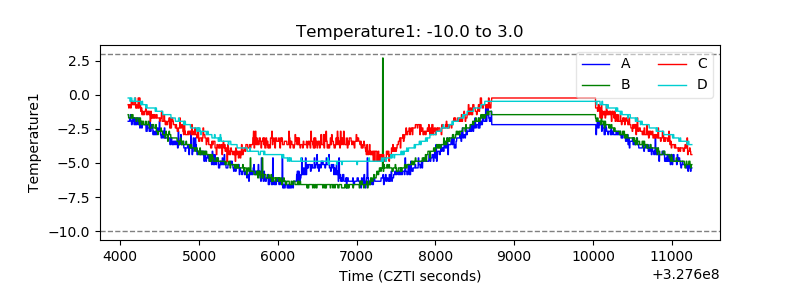 |
| Veto HV Monitor | 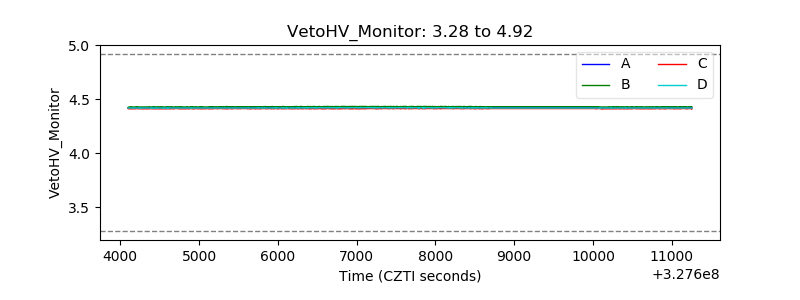 |
| Veto LLD | 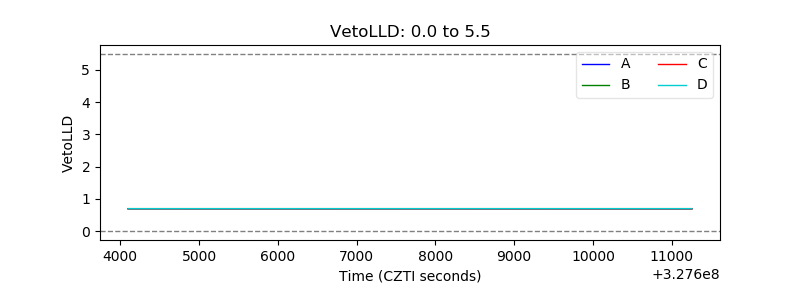 |
| Alpha Counter | 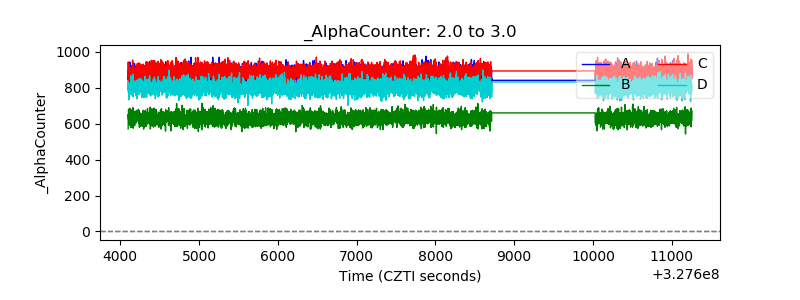 |
| _CPM_Rate | 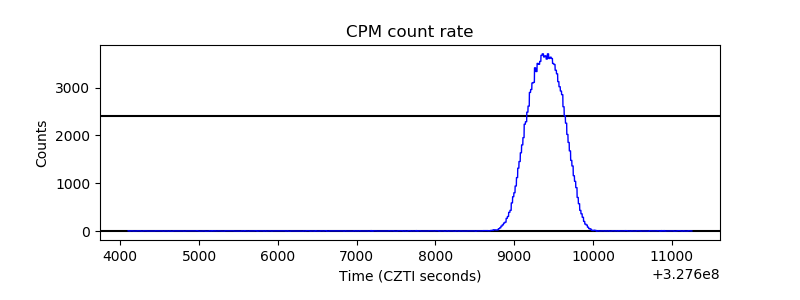 |
| CZT Counter | 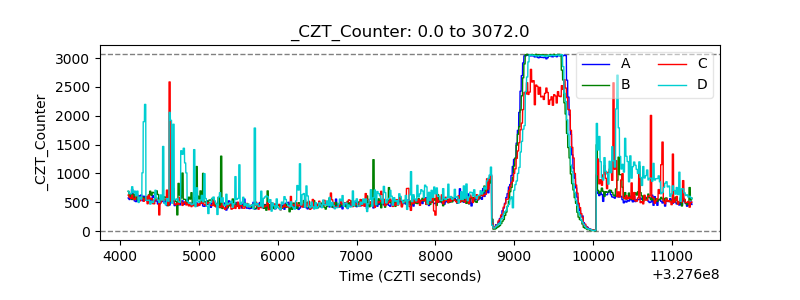 |
| +2.5 Volts monitor | 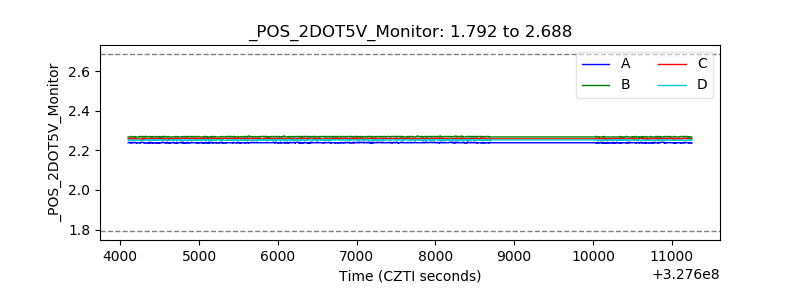 |
| +5 Volts monitor |  |
| _ROLL_ROT | 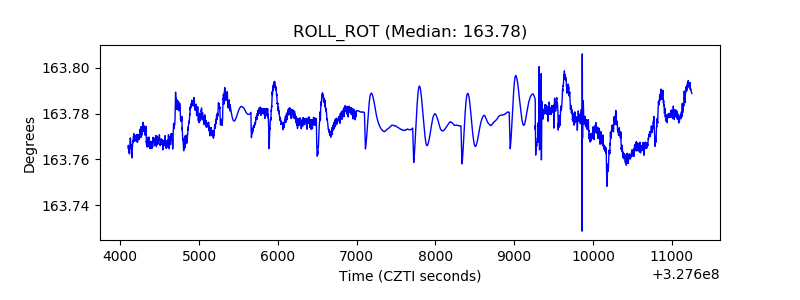 |
| _Roll_DEC | 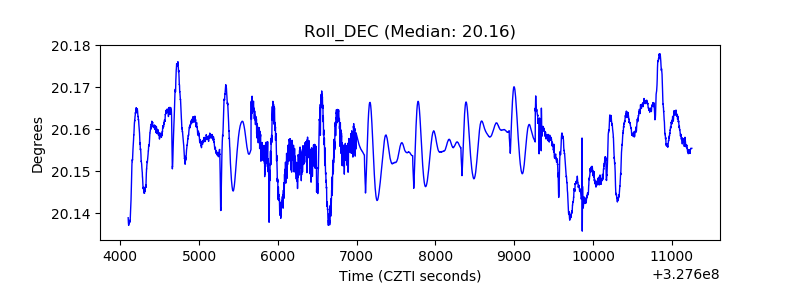 |
| _Roll_RA | 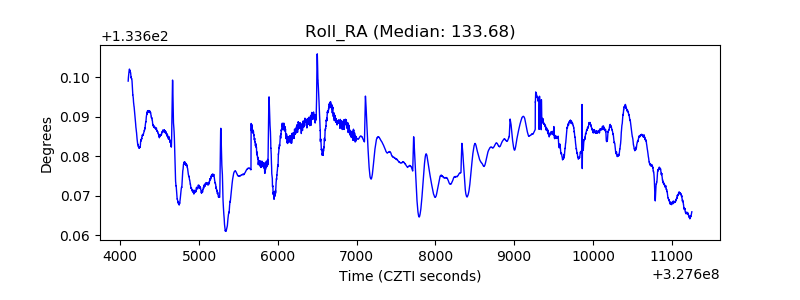 |
| Veto Counter | 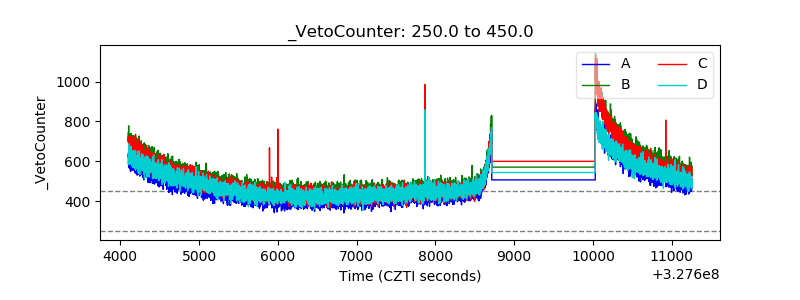 |