| Param | Original file | Final file |
|---|---|---|
| Filename | modeM0/AS1T03_206T01_9000003672_25099cztM0_level2.evt | modeM0/AS1T03_206T01_9000003672_25099cztM0_level2_quad_clean.evt |
| Size (bytes) | 489,314,880 | 93,983,040 |
| Size | 466.6 MB | 89.6 MB |
| Events in quadrant A | 3,138,031 | 624,694 |
| Events in quadrant B | 3,490,437 | 646,001 |
| Events in quadrant C | 3,491,176 | 593,076 |
| Events in quadrant D | 4,285,190 | 556,075 |
| Mode M9 | |||
|---|---|---|---|
| Quadrant | BADHDUFLAG | Total packets | Discarded packets |
| A | 0 | 18 | 0 |
| B | 0 | 19 | 0 |
| C | 0 | 19 | 0 |
| D | 0 | 19 | 0 |
| Mode M0 | |||
|---|---|---|---|
| Quadrant | BADHDUFLAG | Total packets | Discarded packets |
| A | 0 | 12965 | 0 |
| B | 0 | 14149 | 0 |
| C | 0 | 14020 | 0 |
| D | 0 | 16805 | 0 |
| Quadrant | Total seconds | Saturated seconds | Saturation percentage |
|---|---|---|---|
| A | 6108 | 14 | 0.229208% |
| B | 6108 | 38 | 0.622135% |
| C | 6107 | 73 | 1.195350% |
| D | 6107 | 110 | 1.801212% |
Noise dominated data is calculated using 1-second bins in cleaned event files. If a bin has >2000 counts, and if more than 50% of those come from <1% of pixels, then it is considered to be noise-dominated and hence unusable.
| Quadrant | # 1 sec bins | Bins with >0 counts | Bins with >2000 counts | High rate bins dominated by noise | Noise dominated (total time) | Noise dominated (detector-on time) | Marked lightcurve |
|---|---|---|---|---|---|---|---|
| A | 7488 | 6109 | 0 | 0 | 0.00% | 0.00% | 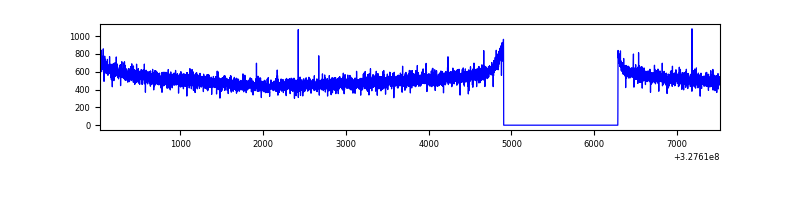 |
| B | 7488 | 6109 | 6 | 6 | 0.08% | 0.10% | 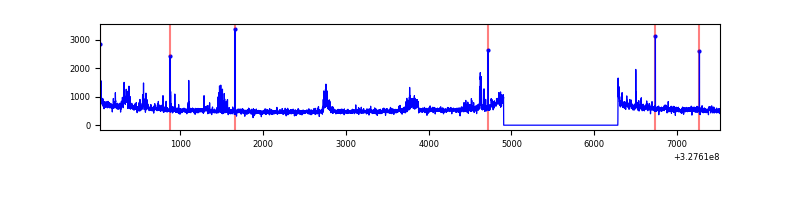 |
| C | 7487 | 6108 | 6 | 6 | 0.08% | 0.10% | 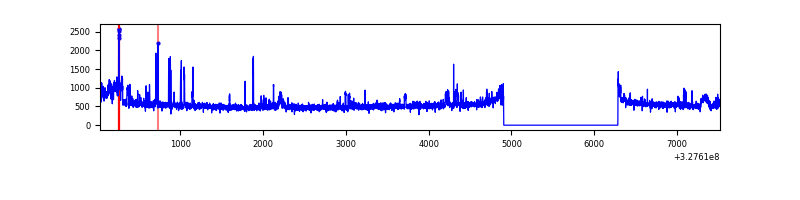 |
| D | 7487 | 6108 | 77 | 77 | 1.03% | 1.26% | 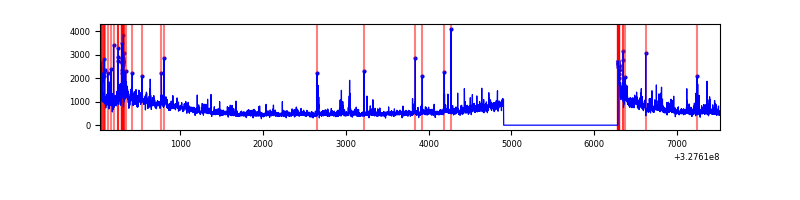 |
Top three noisy pixels from each quadrant. If the there are fewer than three noisy pixels in the level2.evt file, extra rows are filled as -1
| Pixel properties | Quadrant properties | ||||||
|---|---|---|---|---|---|---|---|
| Quadrant | DetID | PixID | Counts | Sigma | Mean | Median | Sigma |
| A | 13 | 254 | 10749 | 61.01 | 813 | 801 | 163.1 |
| A | 0 | 226 | 7088 | 38.56 | 813 | 801 | 163.1 |
| A | 3 | 137 | 6822 | 36.92 | 813 | 801 | 163.1 |
| B | 0 | 189 | 132711 | 869.43 | 820 | 802 | 151.7 |
| B | 0 | 190 | 50909 | 330.26 | 820 | 802 | 151.7 |
| B | 5 | 172 | 41949 | 271.21 | 820 | 802 | 151.7 |
| C | 7 | 247 | 305171 | 1683.54 | 776 | 784 | 180.8 |
| C | 14 | 238 | 126097 | 693.1 | 776 | 784 | 180.8 |
| C | 0 | 207 | 16272 | 85.66 | 776 | 784 | 180.8 |
| D | 1 | 3 | 604580 | 3284.06 | 767 | 746 | 183.9 |
| D | 2 | 244 | 280479 | 1521.38 | 767 | 746 | 183.9 |
| D | 8 | 195 | 272157 | 1476.12 | 767 | 746 | 183.9 |
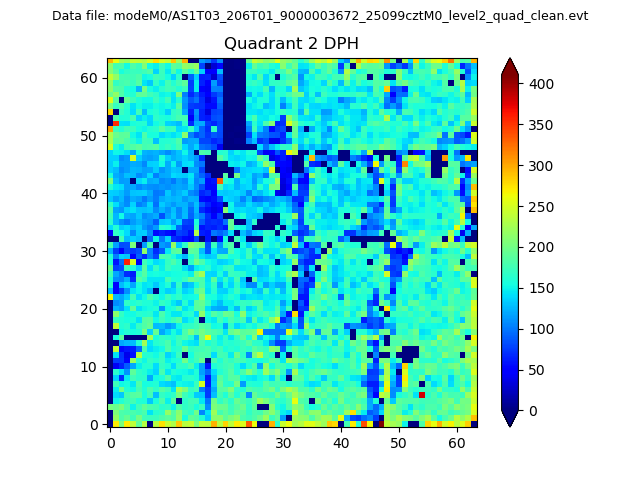
Histogram calculated using DETX and DETY for each event in the final _common_clean file
| Quadrant A | 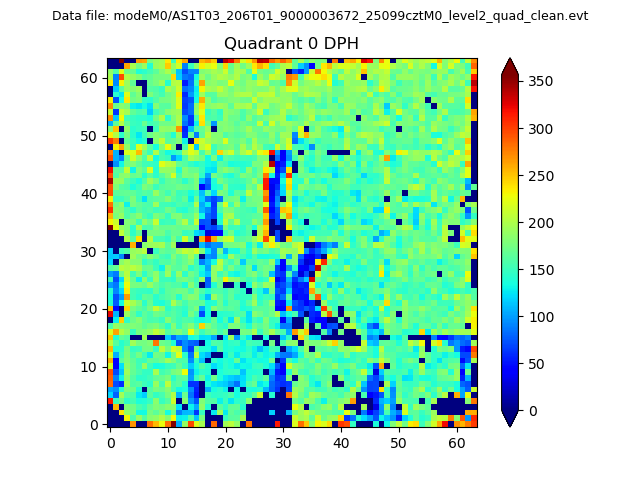 |
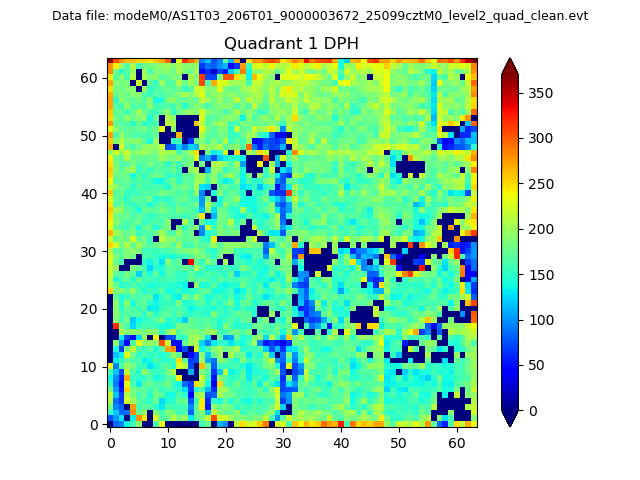 |
Quadrant B |
|---|---|---|---|
| Quadrant D | 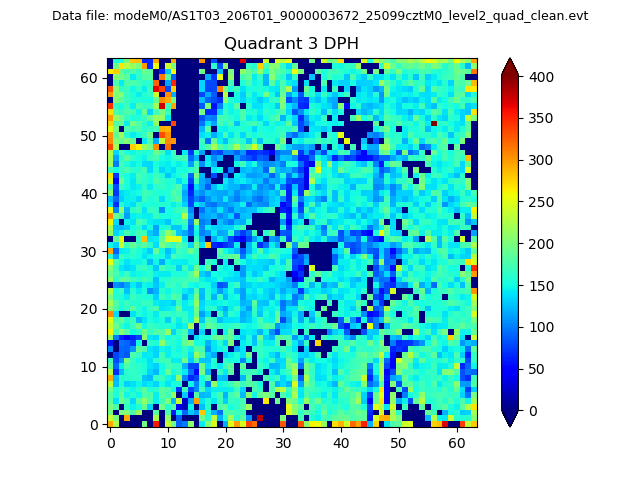 |
 |
Quadrant C |
| Plot type | Count rate plots | Images |
|---|---|---|
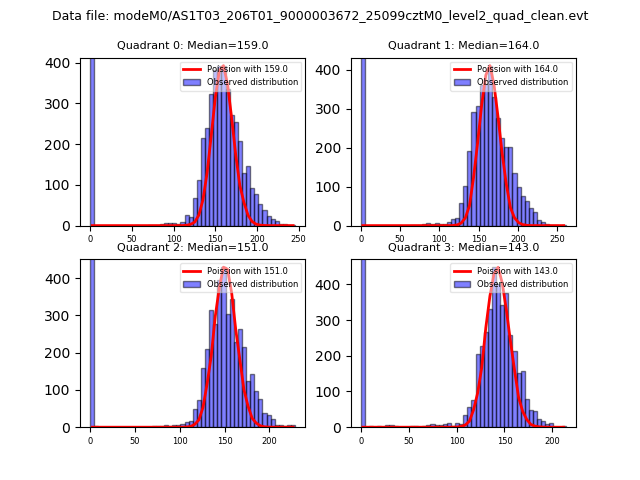
| Comparison with Poisson distribution Blue bars denote a histogram of data divided into 1 sec bins. Red curve is a Poisson curve with rate = median count rate of data. |
 |
 |
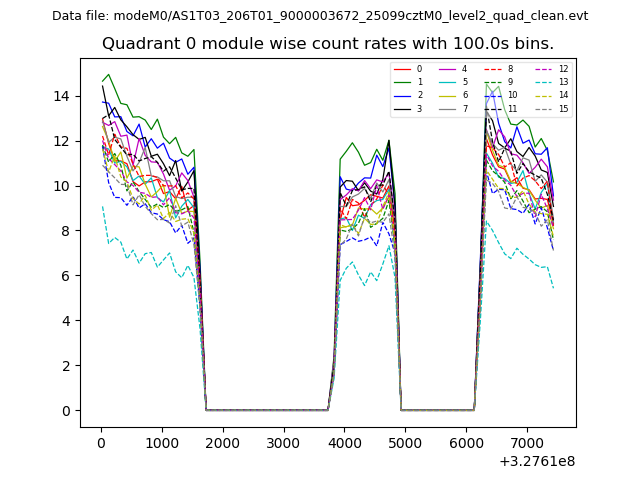
| Quadrant-wise count rates Data is divided into 100 sec bins |
 |
|
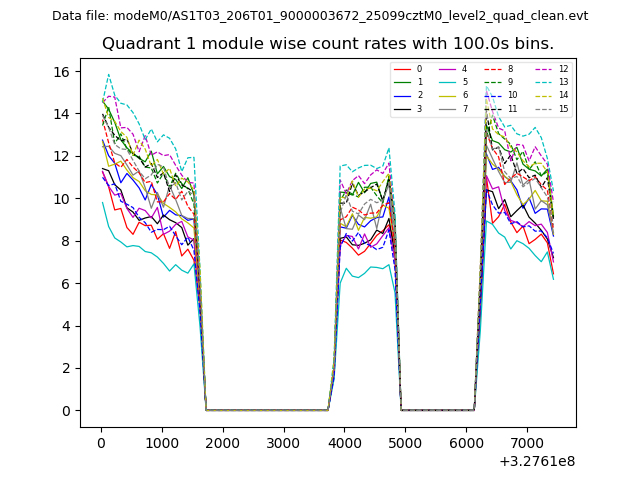
| Module-wise count rates for Quadrant A Data is divided into 100 sec bins |
 |
 |
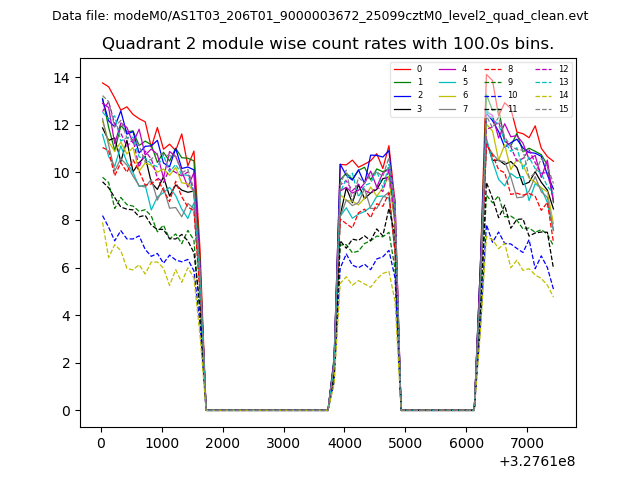
| Module-wise count rates for Quadrant B Data is divided into 100 sec bins |
 |
 |
| Module-wise count rates for Quadrant C Data is divided into 100 sec bins |
 |
 |
| Module-wise count rates for Quadrant D Data is divided into 100 sec bins |
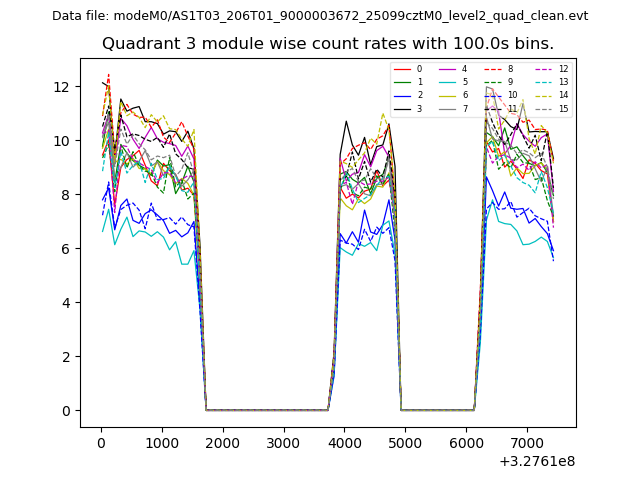 |
 |
| Parameter | Plot |
|---|---|
| CZT HV Monitor | 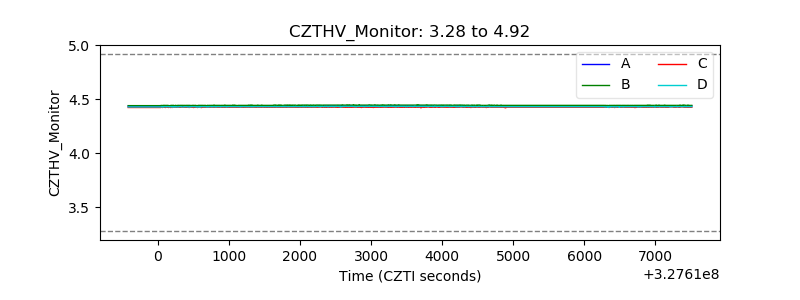 |
| D_VDD | 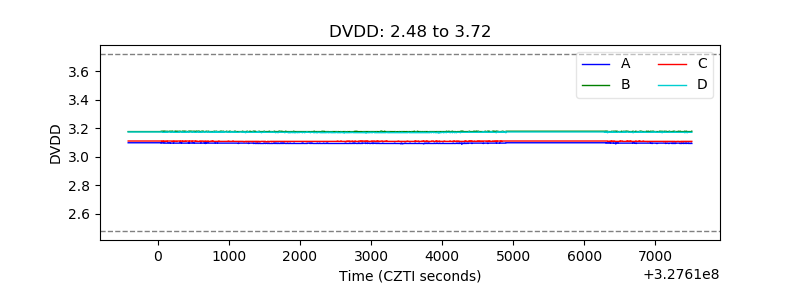 |
| Temperature 1 | 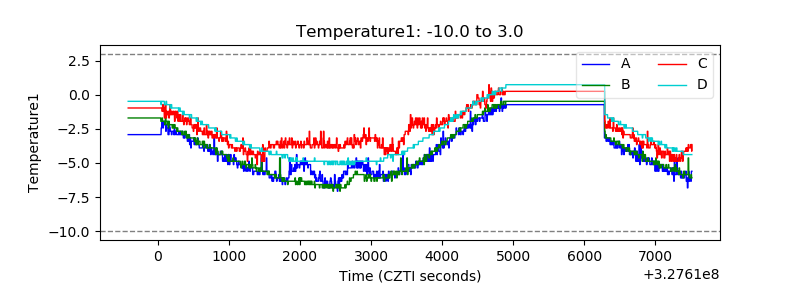 |
| Veto HV Monitor | 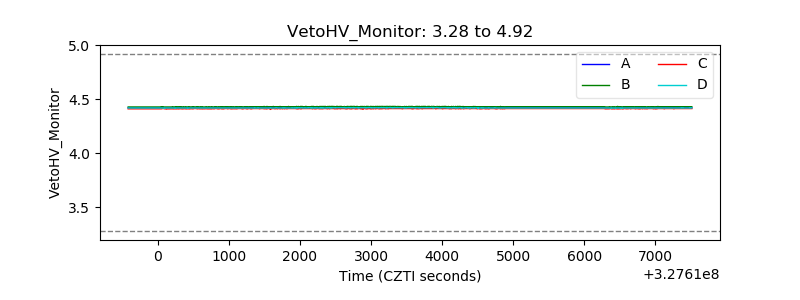 |
| Veto LLD | 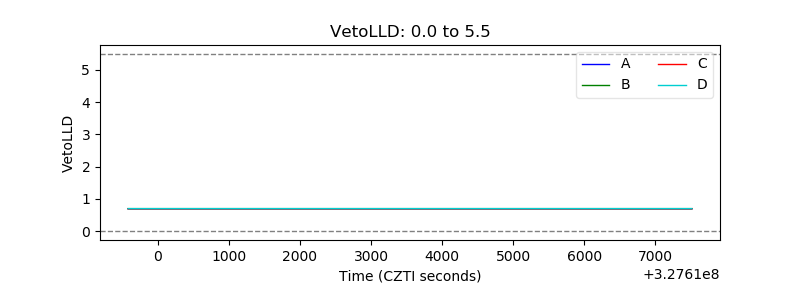 |
| Alpha Counter | 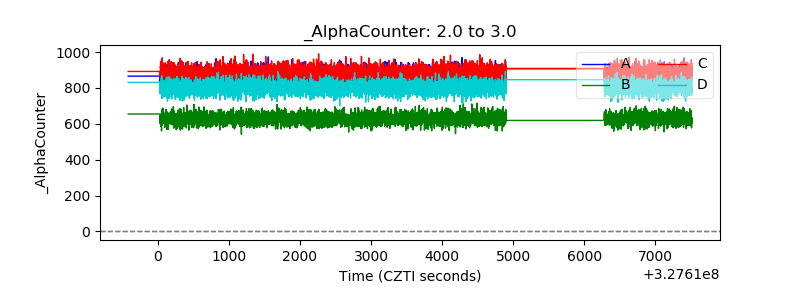 |
| _CPM_Rate | 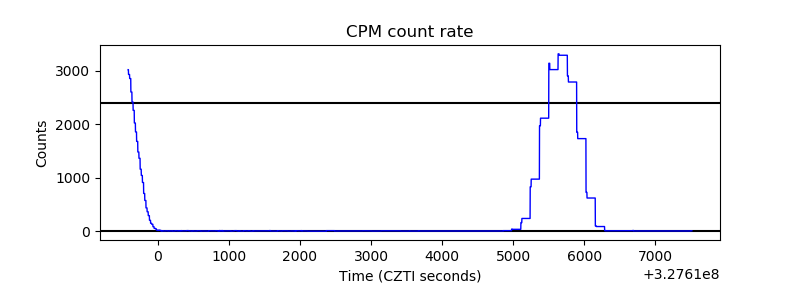 |
| CZT Counter | 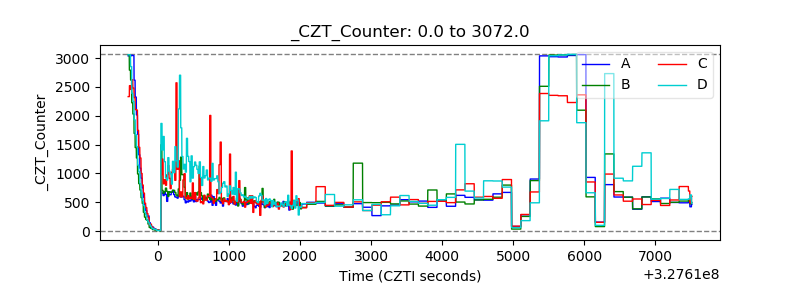 |
| +2.5 Volts monitor |  |
| +5 Volts monitor |  |
| _ROLL_ROT | 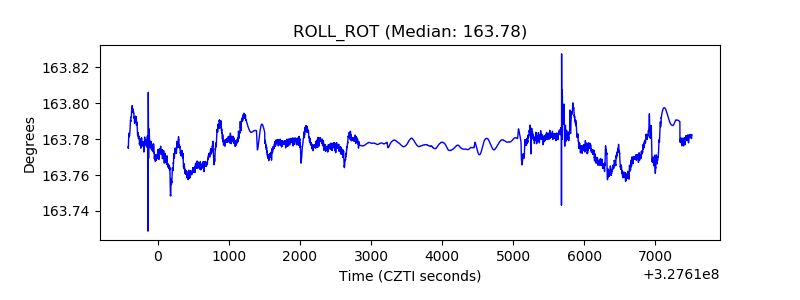 |
| _Roll_DEC | 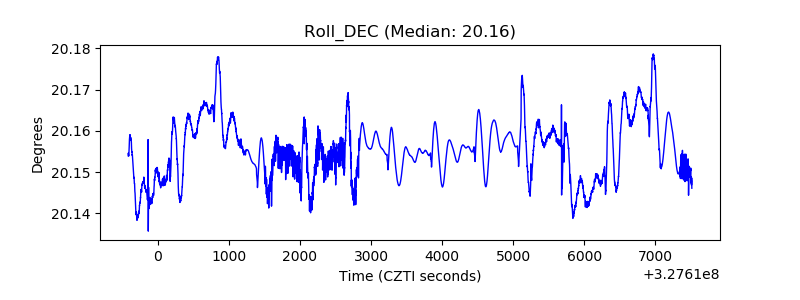 |
| _Roll_RA | 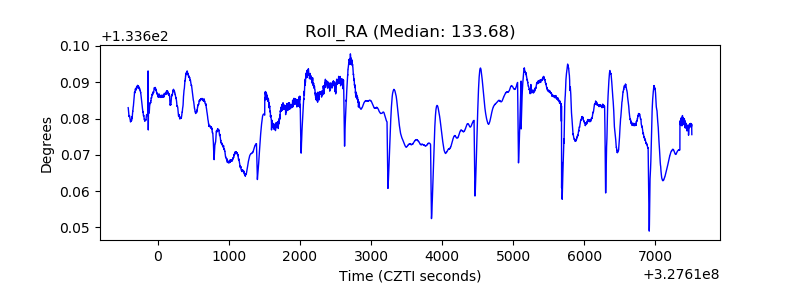 |
| Veto Counter | 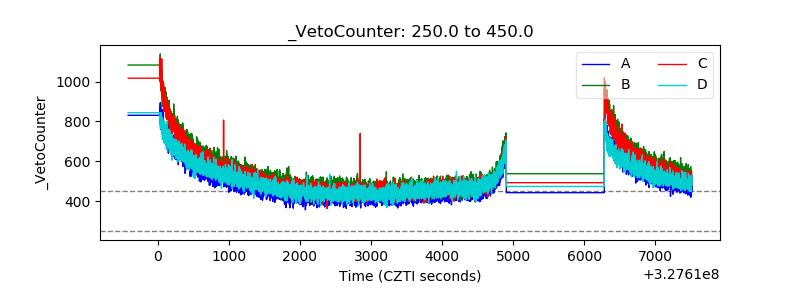 |