| Param | Original file | Final file |
|---|---|---|
| Filename | modeM0/AS1T03_206T01_9000003672_25100cztM0_level2.evt | modeM0/AS1T03_206T01_9000003672_25100cztM0_level2_quad_clean.evt |
| Size (bytes) | 486,869,760 | 84,409,920 |
| Size | 464.3 MB | 80.5 MB |
| Events in quadrant A | 3,155,598 | 550,575 |
| Events in quadrant B | 3,386,165 | 566,978 |
| Events in quadrant C | 3,493,057 | 523,148 |
| Events in quadrant D | 4,292,315 | 485,397 |
| Mode M9 | |||
|---|---|---|---|
| Quadrant | BADHDUFLAG | Total packets | Discarded packets |
| A | 0 | 16 | 0 |
| B | 0 | 17 | 0 |
| C | 0 | 17 | 0 |
| D | 0 | 17 | 0 |
| Mode M0 | |||
|---|---|---|---|
| Quadrant | BADHDUFLAG | Total packets | Discarded packets |
| A | 0 | 13006 | 0 |
| B | 0 | 13720 | 0 |
| C | 0 | 14115 | 0 |
| D | 0 | 16844 | 0 |
| Quadrant | Total seconds | Saturated seconds | Saturation percentage |
|---|---|---|---|
| A | 6157 | 26 | 0.422284% |
| B | 6157 | 77 | 1.250609% |
| C | 6157 | 74 | 1.201884% |
| D | 6157 | 278 | 4.515186% |
Noise dominated data is calculated using 1-second bins in cleaned event files. If a bin has >2000 counts, and if more than 50% of those come from <1% of pixels, then it is considered to be noise-dominated and hence unusable.
| Quadrant | # 1 sec bins | Bins with >0 counts | Bins with >2000 counts | High rate bins dominated by noise | Noise dominated (total time) | Noise dominated (detector-on time) | Marked lightcurve |
|---|---|---|---|---|---|---|---|
| A | 7512 | 6159 | 4 | 4 | 0.05% | 0.06% | 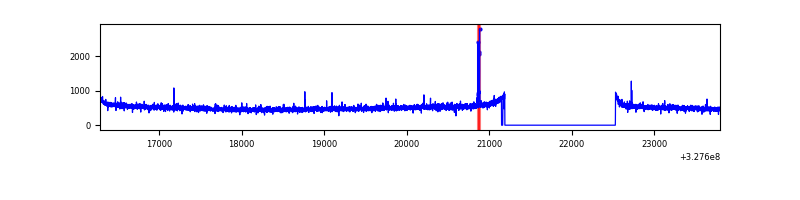 |
| B | 7512 | 6158 | 25 | 25 | 0.33% | 0.41% | 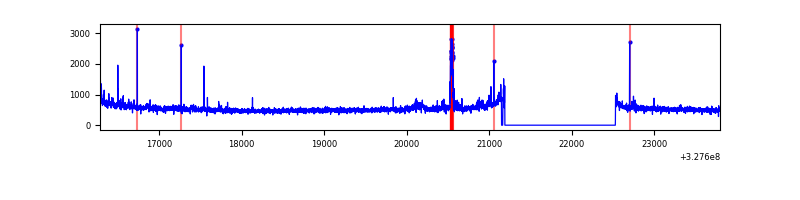 |
| C | 7512 | 6159 | 3 | 3 | 0.04% | 0.05% | 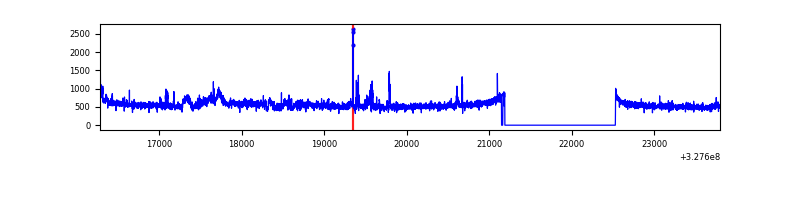 |
| D | 7512 | 6157 | 157 | 157 | 2.09% | 2.55% | 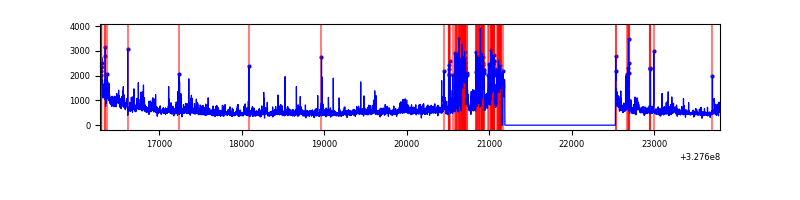 |
Top three noisy pixels from each quadrant. If the there are fewer than three noisy pixels in the level2.evt file, extra rows are filled as -1
| Pixel properties | Quadrant properties | ||||||
|---|---|---|---|---|---|---|---|
| Quadrant | DetID | PixID | Counts | Sigma | Mean | Median | Sigma |
| A | 4 | 2 | 31427 | 188.16 | 810 | 795 | 162.8 |
| A | 13 | 254 | 11392 | 65.09 | 810 | 795 | 162.8 |
| A | 0 | 226 | 7099 | 38.72 | 810 | 795 | 162.8 |
| B | 15 | 32 | 59980 | 389.0 | 816 | 796 | 152.1 |
| B | 0 | 189 | 56201 | 364.16 | 816 | 796 | 152.1 |
| B | 5 | 172 | 25013 | 159.17 | 816 | 796 | 152.1 |
| C | 7 | 247 | 315924 | 1751.26 | 774 | 782 | 180.0 |
| C | 14 | 238 | 125802 | 694.74 | 774 | 782 | 180.0 |
| C | 2 | 16 | 23967 | 128.84 | 774 | 782 | 180.0 |
| D | 1 | 52 | 384578 | 2105.11 | 753 | 731 | 182.3 |
| D | 8 | 195 | 265247 | 1450.67 | 753 | 731 | 182.3 |
| D | 12 | 33 | 223965 | 1224.27 | 753 | 731 | 182.3 |
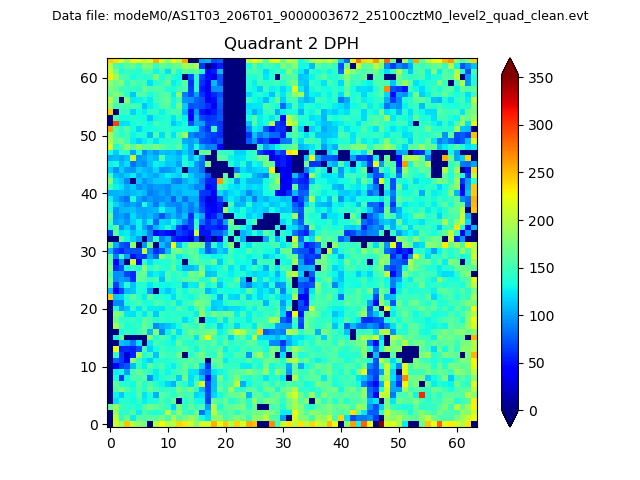
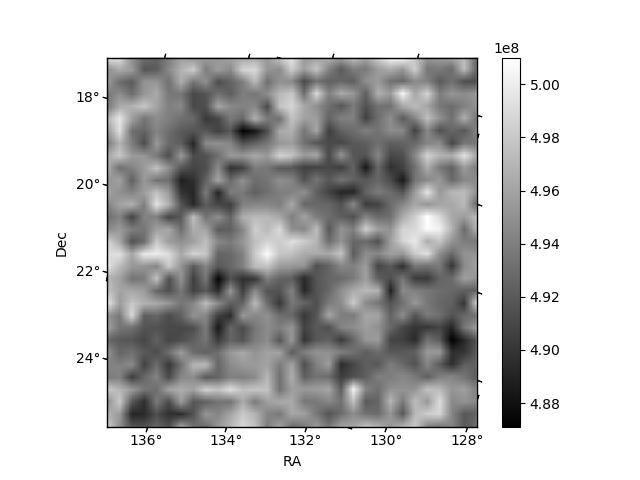
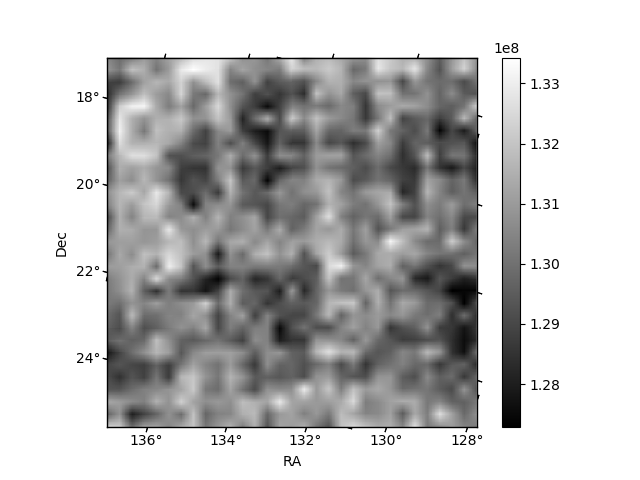
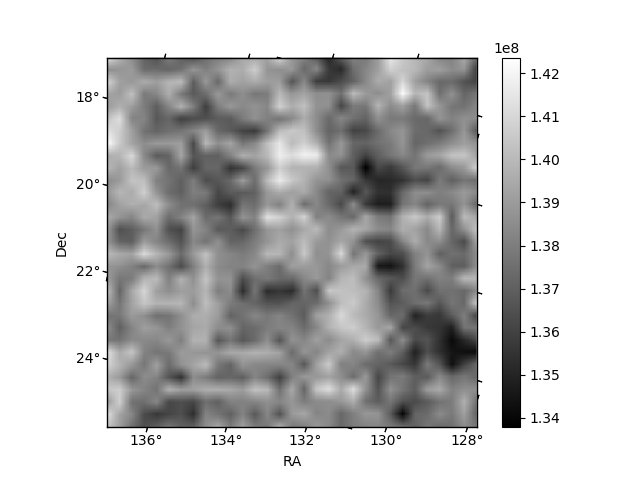
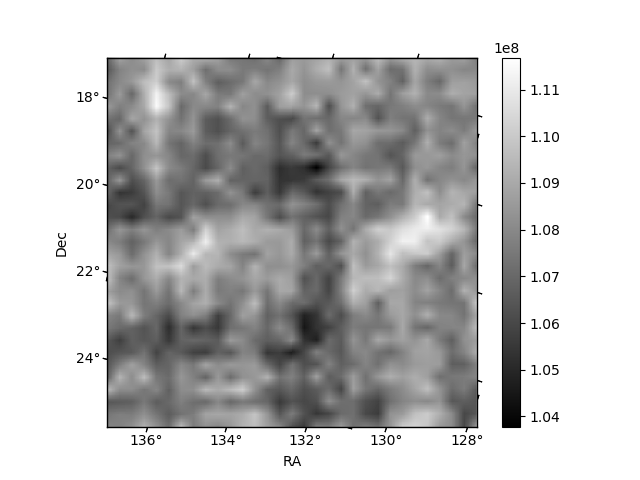
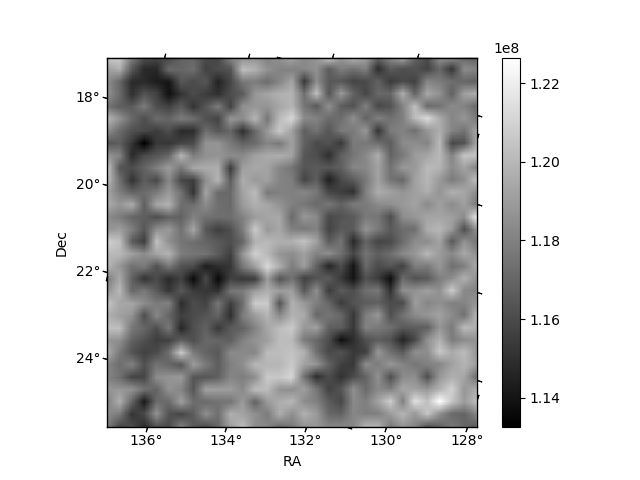
Histogram calculated using DETX and DETY for each event in the final _common_clean file
| Quadrant A | 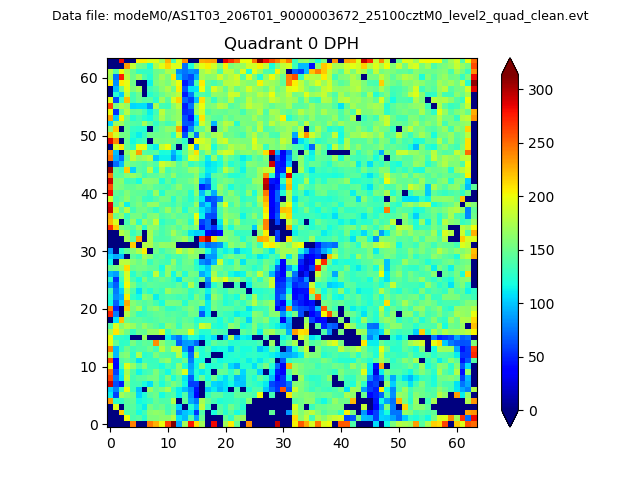 |
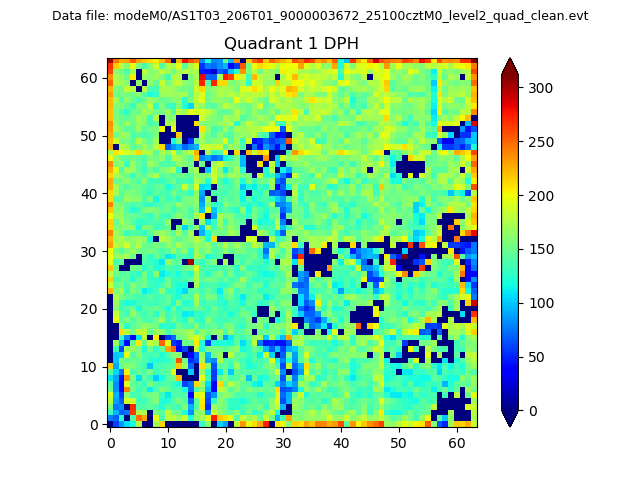 |
Quadrant B |
|---|---|---|---|
| Quadrant D | 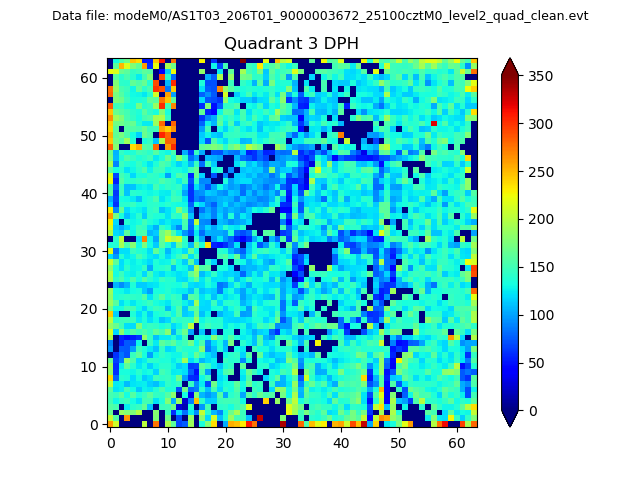 |
 |
Quadrant C |
| Plot type | Count rate plots | Images |
|---|---|---|
| Comparison with Poisson distribution Blue bars denote a histogram of data divided into 1 sec bins. Red curve is a Poisson curve with rate = median count rate of data. |
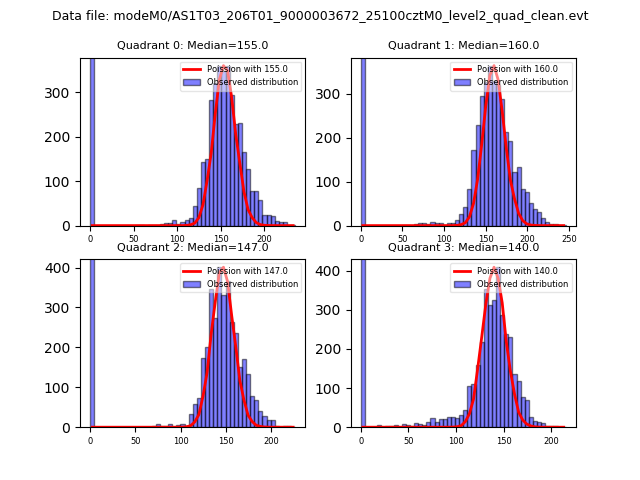 |
 |
| Quadrant-wise count rates Data is divided into 100 sec bins |
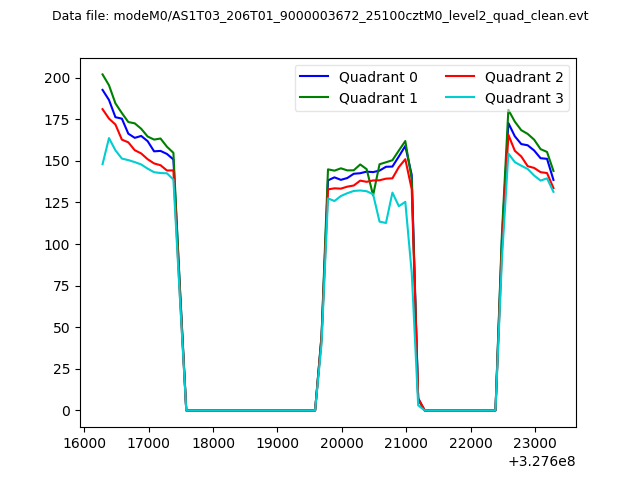 |
|
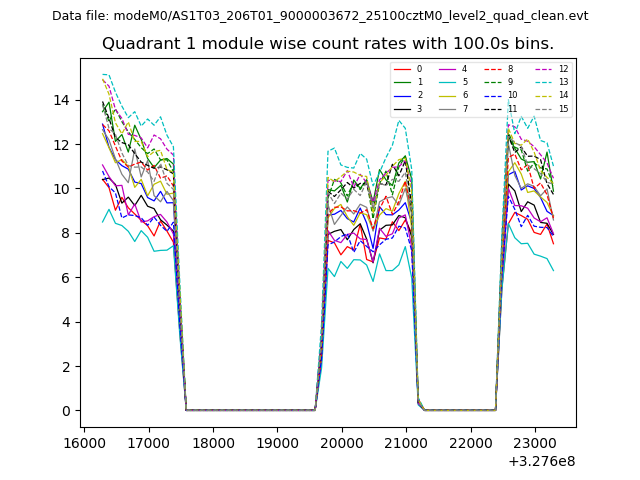
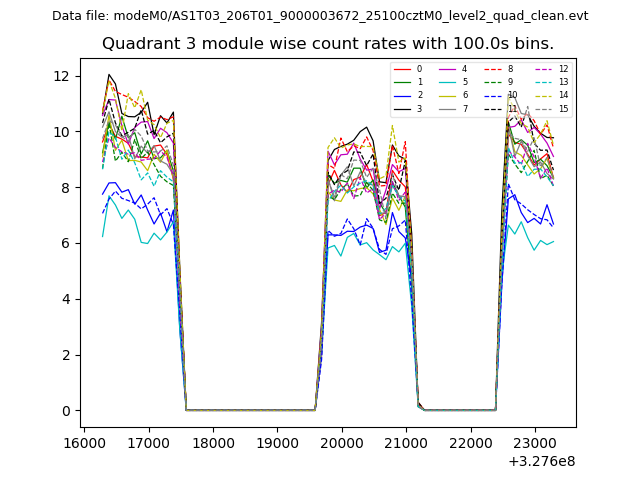
| Module-wise count rates for Quadrant A Data is divided into 100 sec bins |
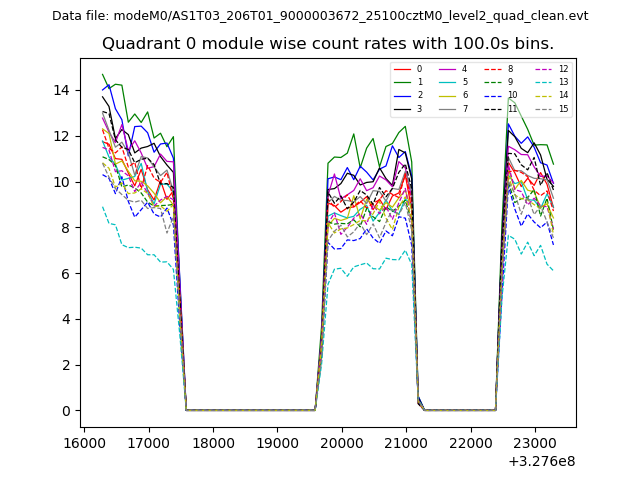 |
 |
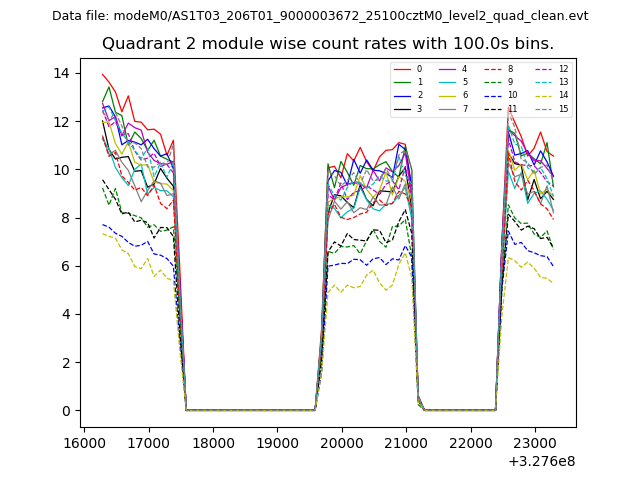
| Module-wise count rates for Quadrant B Data is divided into 100 sec bins |
 |
 |
| Module-wise count rates for Quadrant C Data is divided into 100 sec bins |
 |
 |
| Module-wise count rates for Quadrant D Data is divided into 100 sec bins |
 |
 |
| Parameter | Plot |
|---|---|
| CZT HV Monitor | 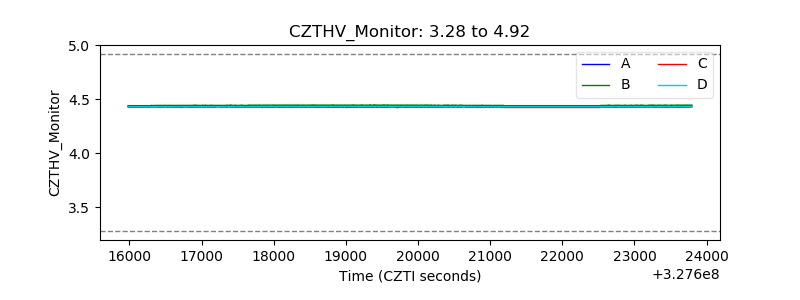 |
| D_VDD | 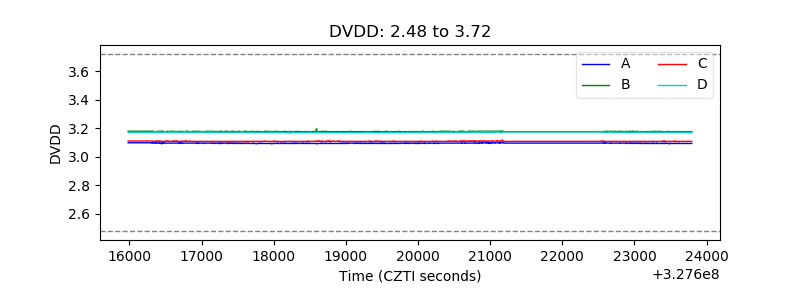 |
| Temperature 1 | 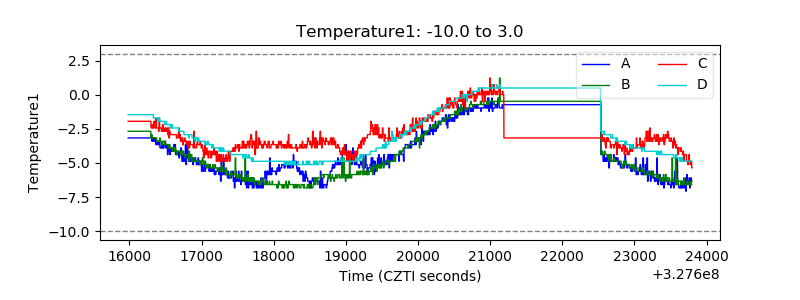 |
| Veto HV Monitor | 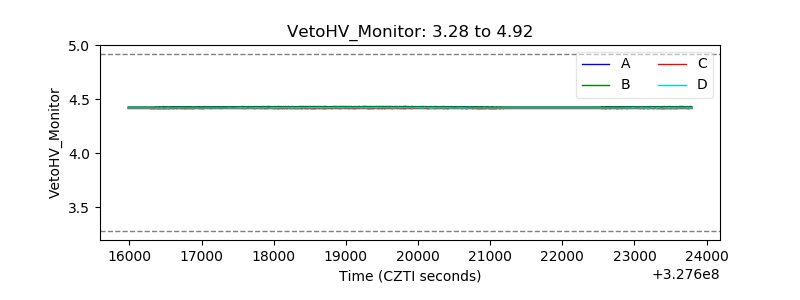 |
| Veto LLD | 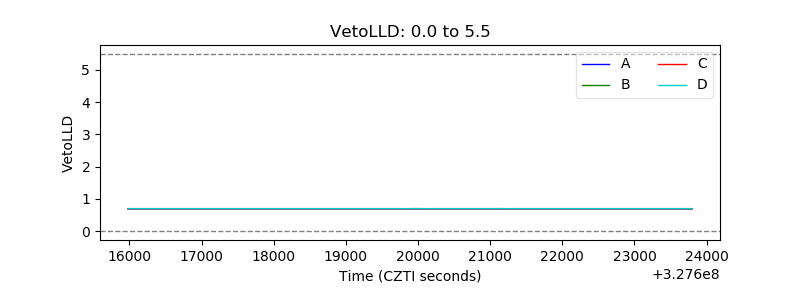 |
| Alpha Counter | 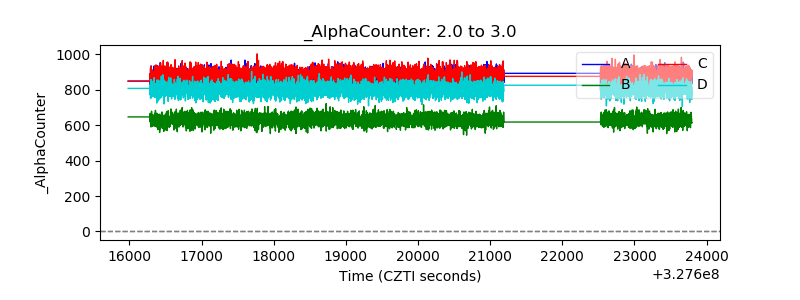 |
| _CPM_Rate | 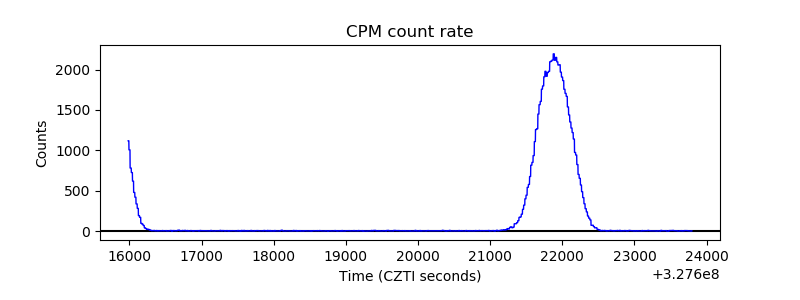 |
| CZT Counter | 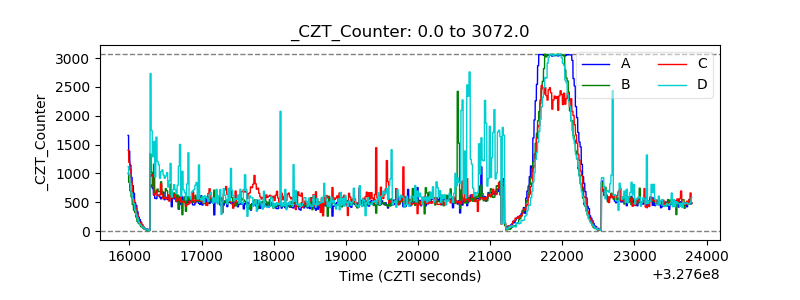 |
| +2.5 Volts monitor | 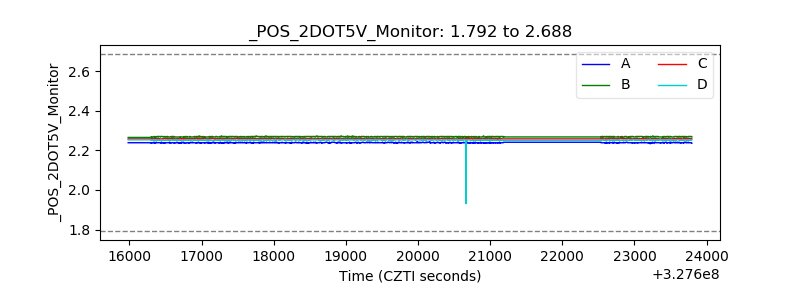 |
| +5 Volts monitor | 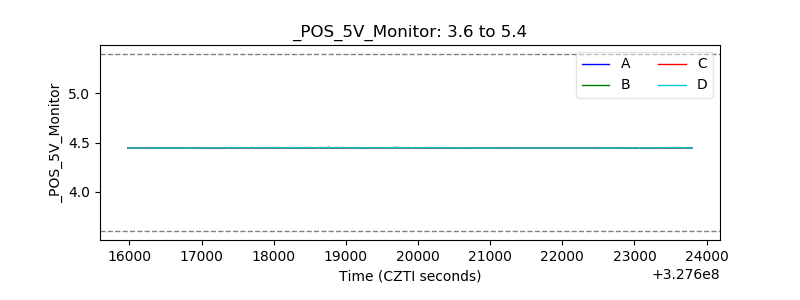 |
| _ROLL_ROT | 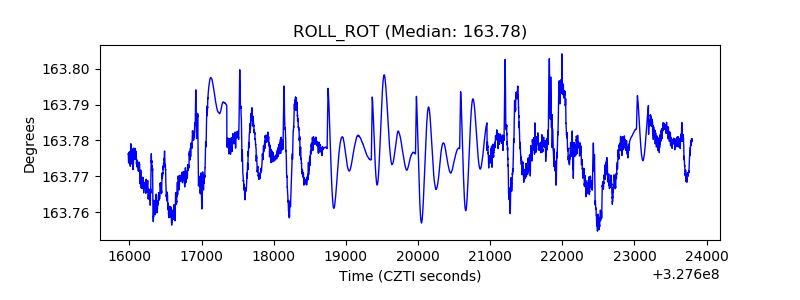 |
| _Roll_DEC |  |
| _Roll_RA | 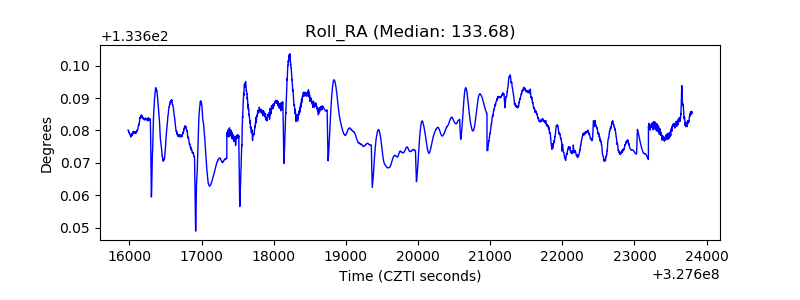 |
| Veto Counter | 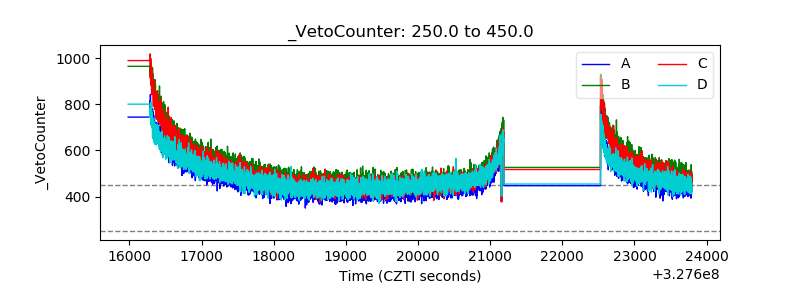 |