| Param | Original file | Final file |
|---|---|---|
| Filename | modeM0/AS1T03_206T01_9000003672_25101cztM0_level2.evt | modeM0/AS1T03_206T01_9000003672_25101cztM0_level2_quad_clean.evt |
| Size (bytes) | 492,707,520 | 76,979,520 |
| Size | 469.9 MB | 73.4 MB |
| Events in quadrant A | 3,183,423 | 486,976 |
| Events in quadrant B | 3,359,013 | 500,782 |
| Events in quadrant C | 3,384,694 | 462,281 |
| Events in quadrant D | 4,561,069 | 435,073 |
| Mode M9 | |||
|---|---|---|---|
| Quadrant | BADHDUFLAG | Total packets | Discarded packets |
| A | 0 | 14 | 0 |
| B | 0 | 15 | 0 |
| C | 0 | 15 | 0 |
| D | 0 | 15 | 0 |
| Mode M0 | |||
|---|---|---|---|
| Quadrant | BADHDUFLAG | Total packets | Discarded packets |
| A | 0 | 13254 | 0 |
| B | 0 | 13766 | 0 |
| C | 0 | 13882 | 0 |
| D | 0 | 17758 | 0 |
| Quadrant | Total seconds | Saturated seconds | Saturation percentage |
|---|---|---|---|
| A | 6382 | 23 | 0.360389% |
| B | 6382 | 55 | 0.861799% |
| C | 6382 | 80 | 1.253526% |
| D | 6382 | 289 | 4.528361% |
Noise dominated data is calculated using 1-second bins in cleaned event files. If a bin has >2000 counts, and if more than 50% of those come from <1% of pixels, then it is considered to be noise-dominated and hence unusable.
| Quadrant | # 1 sec bins | Bins with >0 counts | Bins with >2000 counts | High rate bins dominated by noise | Noise dominated (total time) | Noise dominated (detector-on time) | Marked lightcurve |
|---|---|---|---|---|---|---|---|
| A | 7552 | 6383 | 0 | 0 | 0.00% | 0.00% | 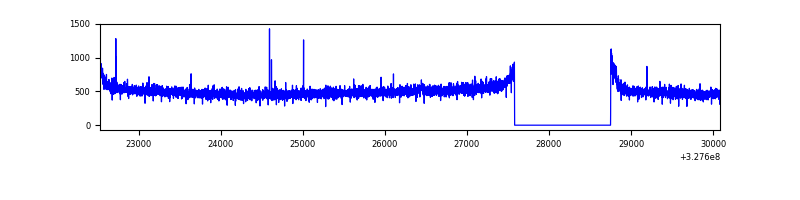 |
| B | 7552 | 6383 | 5 | 5 | 0.07% | 0.08% | 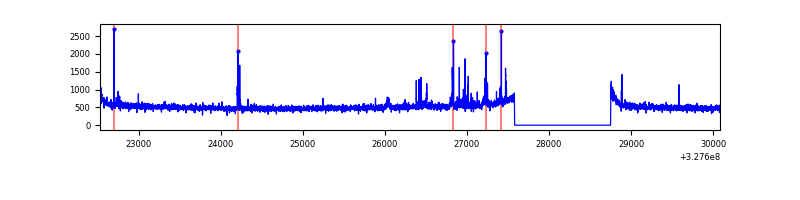 |
| C | 7552 | 6383 | 0 | 0 | 0.00% | 0.00% | 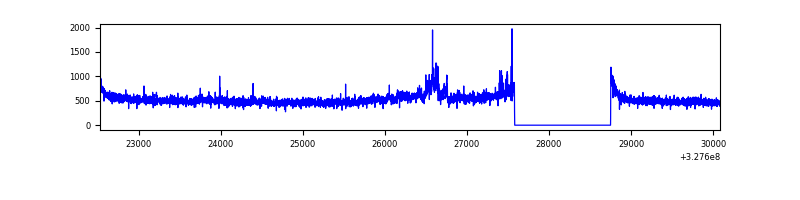 |
| D | 7552 | 6383 | 213 | 213 | 2.82% | 3.34% | 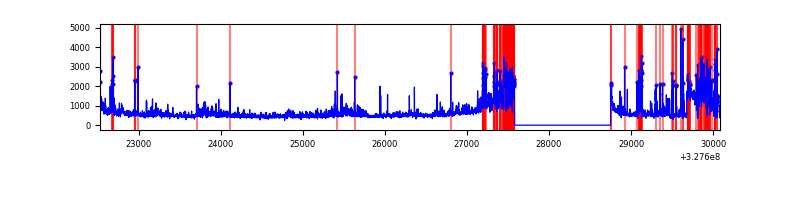 |
Top three noisy pixels from each quadrant. If the there are fewer than three noisy pixels in the level2.evt file, extra rows are filled as -1
| Pixel properties | Quadrant properties | ||||||
|---|---|---|---|---|---|---|---|
| Quadrant | DetID | PixID | Counts | Sigma | Mean | Median | Sigma |
| A | 13 | 254 | 11175 | 62.69 | 822 | 804 | 165.4 |
| A | 3 | 137 | 7160 | 38.42 | 822 | 804 | 165.4 |
| A | 0 | 226 | 7109 | 38.11 | 822 | 804 | 165.4 |
| B | 0 | 189 | 43870 | 277.82 | 826 | 808 | 155.0 |
| B | 0 | 229 | 39891 | 252.15 | 826 | 808 | 155.0 |
| B | 5 | 172 | 26355 | 164.82 | 826 | 808 | 155.0 |
| C | 0 | 239 | 132128 | 717.21 | 781 | 788 | 183.1 |
| C | 14 | 238 | 126339 | 685.6 | 781 | 788 | 183.1 |
| C | 7 | 247 | 52558 | 282.7 | 781 | 788 | 183.1 |
| D | 1 | 52 | 489246 | 2605.05 | 765 | 743 | 187.5 |
| D | 7 | 223 | 325968 | 1734.33 | 765 | 743 | 187.5 |
| D | 12 | 233 | 219100 | 1164.44 | 765 | 743 | 187.5 |
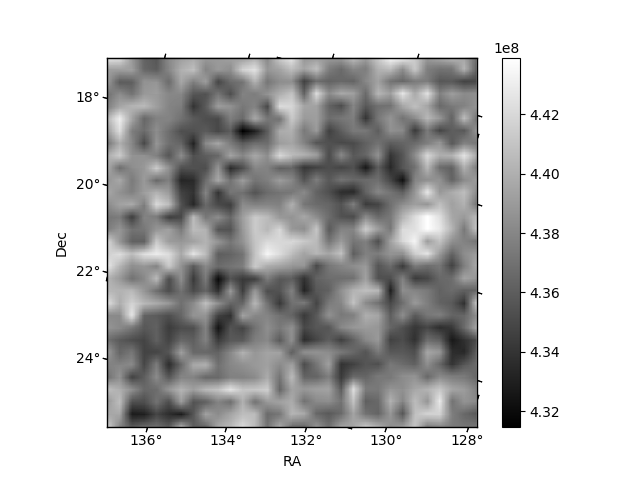
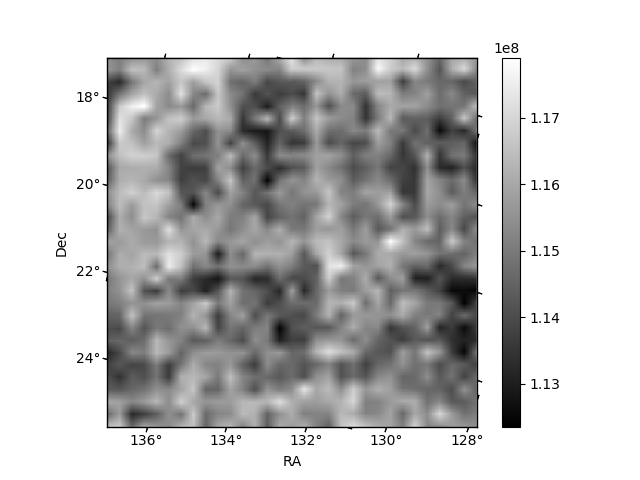
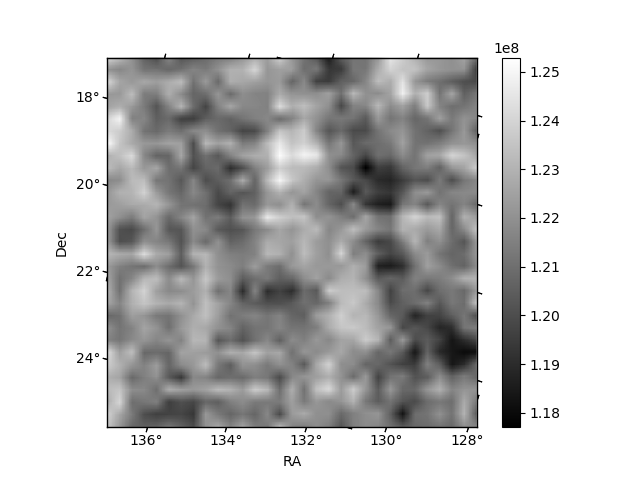
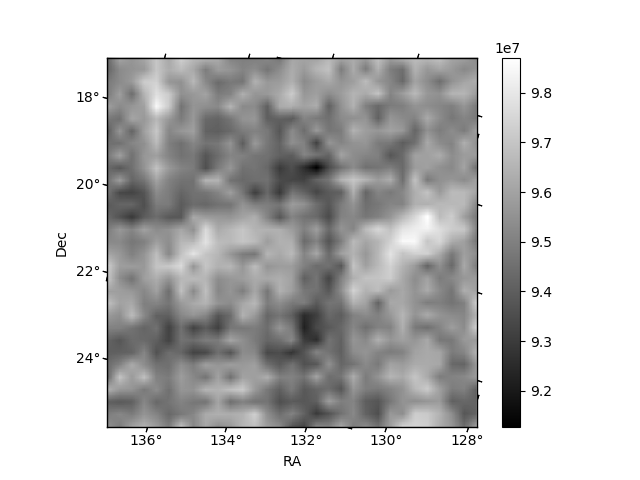
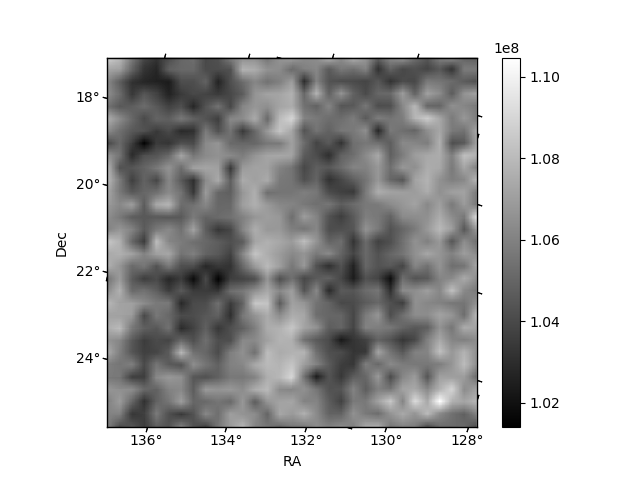
Histogram calculated using DETX and DETY for each event in the final _common_clean file
| Quadrant A | 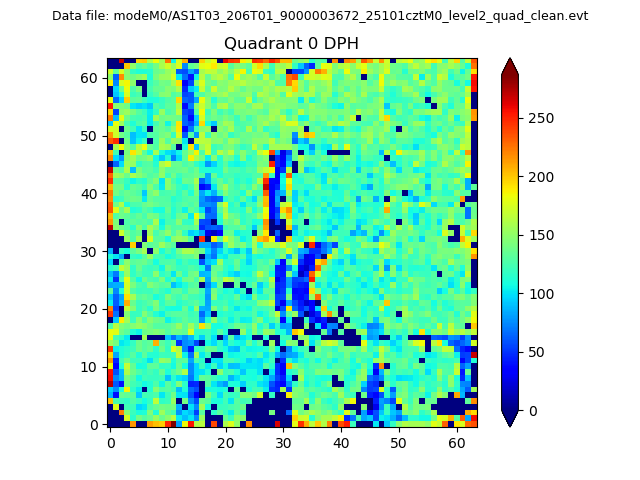 |
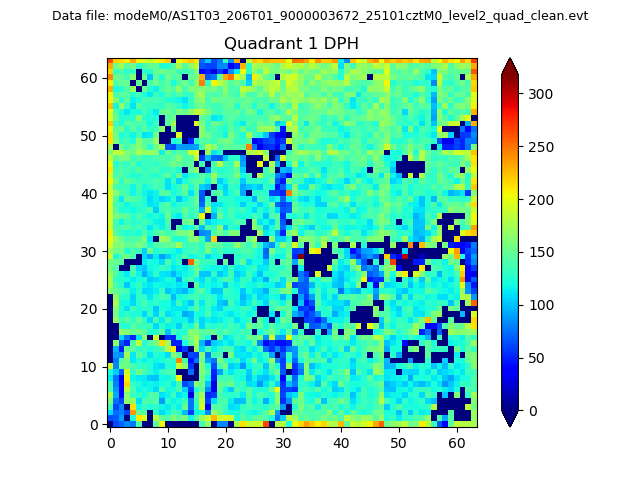 |
Quadrant B |
|---|---|---|---|
| Quadrant D | 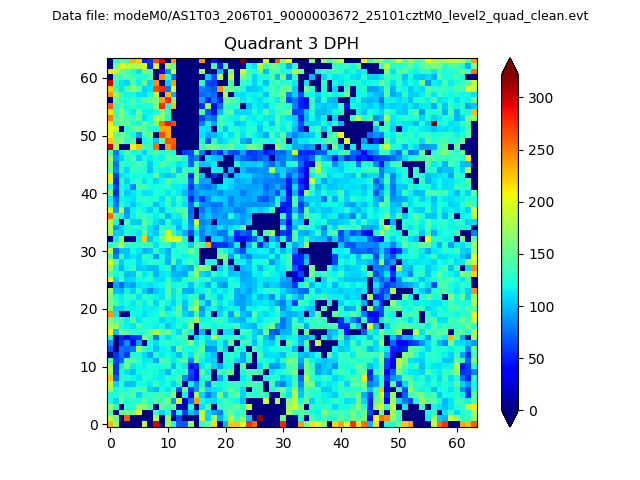 |
 |
Quadrant C |
| Plot type | Count rate plots | Images |
|---|---|---|
| Comparison with Poisson distribution Blue bars denote a histogram of data divided into 1 sec bins. Red curve is a Poisson curve with rate = median count rate of data. |
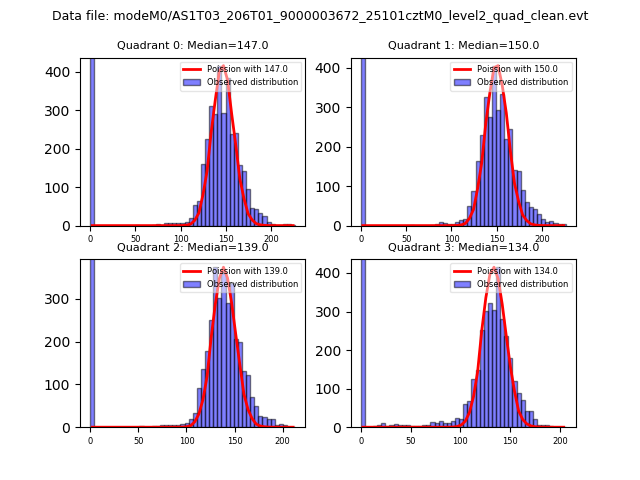 |
 |
| Quadrant-wise count rates Data is divided into 100 sec bins |
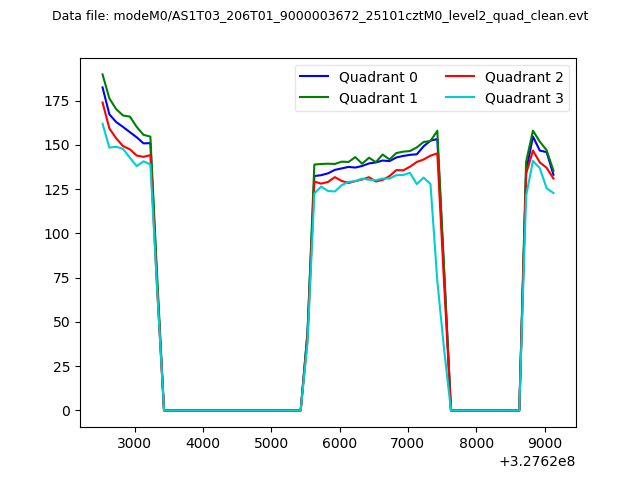 |
|
| Module-wise count rates for Quadrant A Data is divided into 100 sec bins |
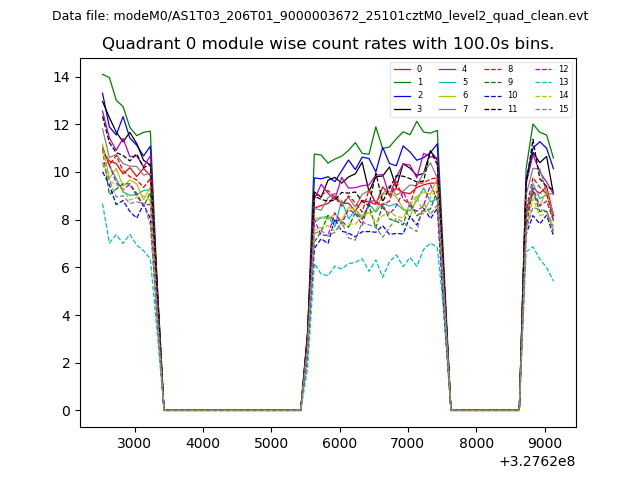 |
 |
| Module-wise count rates for Quadrant B Data is divided into 100 sec bins |
 |
 |
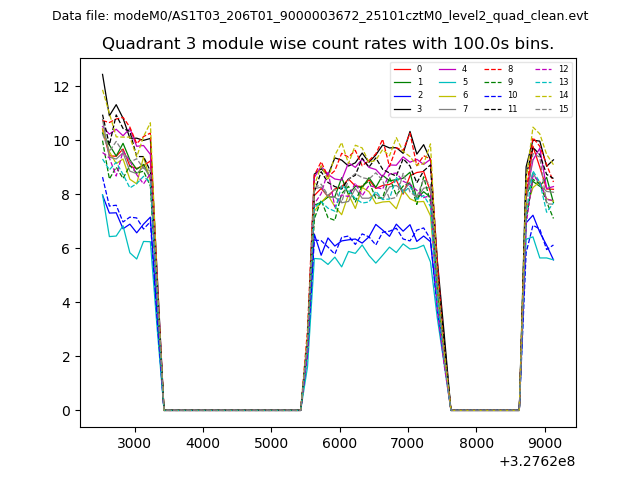
| Module-wise count rates for Quadrant C Data is divided into 100 sec bins |
 |
 |
| Module-wise count rates for Quadrant D Data is divided into 100 sec bins |
 |
 |
| Parameter | Plot |
|---|---|
| CZT HV Monitor | 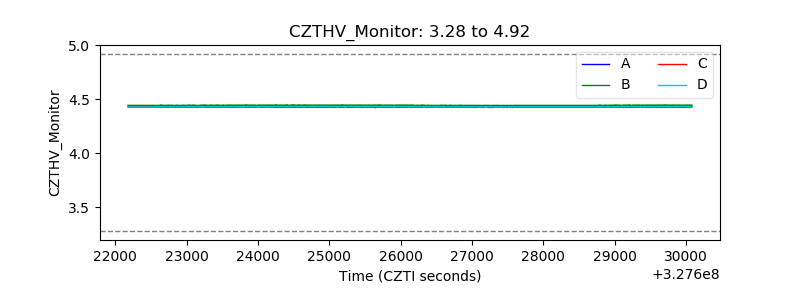 |
| D_VDD | 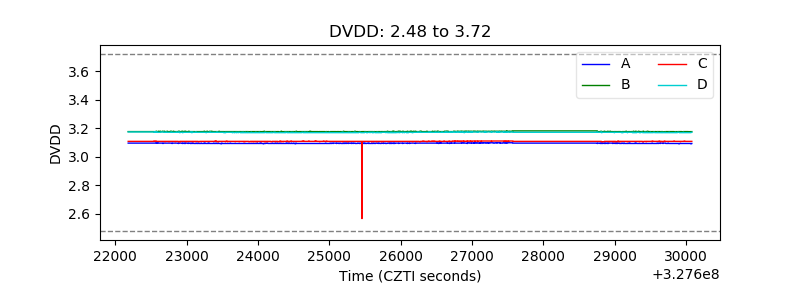 |
| Temperature 1 | 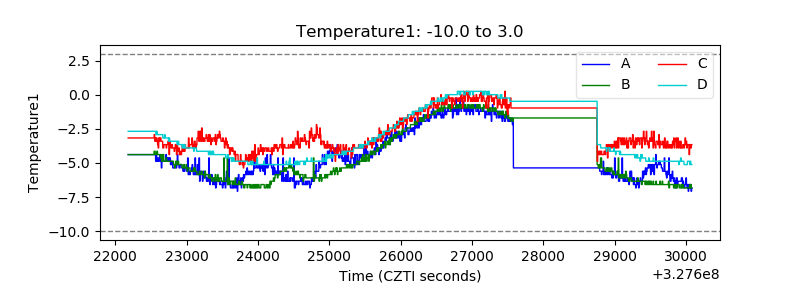 |
| Veto HV Monitor | 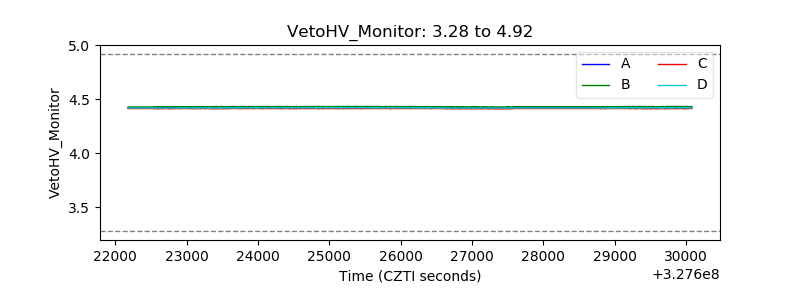 |
| Veto LLD |  |
| Alpha Counter |  |
| _CPM_Rate | 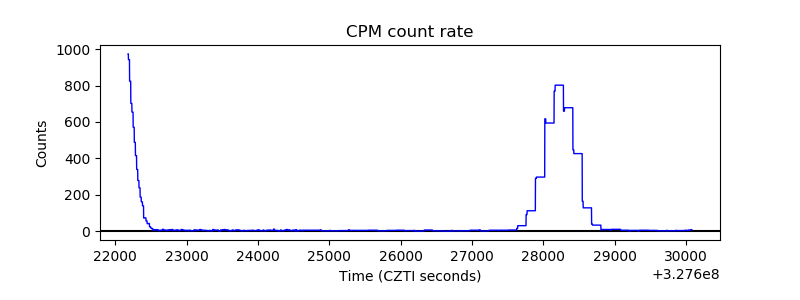 |
| CZT Counter |  |
| +2.5 Volts monitor |  |
| +5 Volts monitor |  |
| _ROLL_ROT | 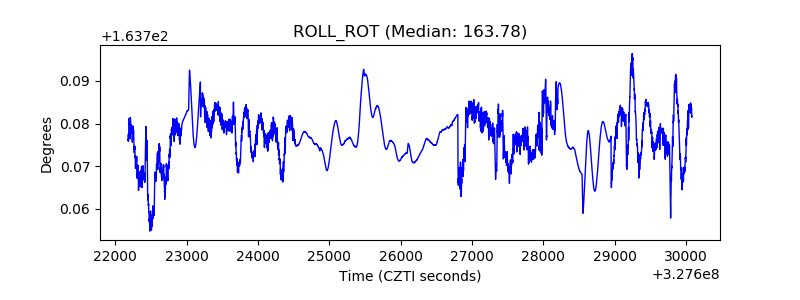 |
| _Roll_DEC | 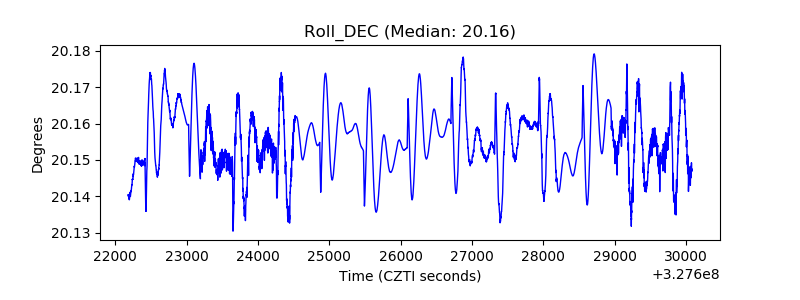 |
| _Roll_RA |  |
| Veto Counter | 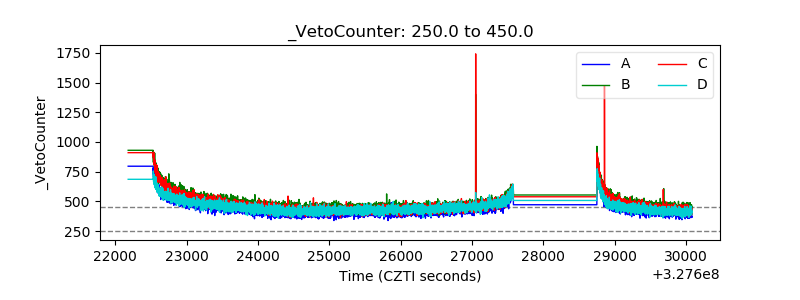 |