| Param | Original file | Final file |
|---|---|---|
| Filename | modeM0/AS1T03_206T01_9000003672_25102cztM0_level2.evt | modeM0/AS1T03_206T01_9000003672_25102cztM0_level2_quad_clean.evt |
| Size (bytes) | 602,853,120 | 74,162,880 |
| Size | 574.9 MB | 70.7 MB |
| Events in quadrant A | 3,428,067 | 456,099 |
| Events in quadrant B | 3,723,826 | 463,009 |
| Events in quadrant C | 3,468,610 | 437,145 |
| Events in quadrant D | 7,163,967 | 402,426 |
| Mode M9 | |||
|---|---|---|---|
| Quadrant | BADHDUFLAG | Total packets | Discarded packets |
| A | 0 | 9 | 0 |
| B | 0 | 10 | 0 |
| C | 0 | 10 | 0 |
| D | 0 | 10 | 0 |
| Mode M0 | |||
|---|---|---|---|
| Quadrant | BADHDUFLAG | Total packets | Discarded packets |
| A | 0 | 14509 | 0 |
| B | 0 | 15399 | 0 |
| C | 0 | 14525 | 0 |
| D | 0 | 26056 | 0 |
| Quadrant | Total seconds | Saturated seconds | Saturation percentage |
|---|---|---|---|
| A | 6986 | 101 | 1.445749% |
| B | 6986 | 150 | 2.147151% |
| C | 6986 | 112 | 1.603206% |
| D | 6986 | 622 | 8.903521% |
Noise dominated data is calculated using 1-second bins in cleaned event files. If a bin has >2000 counts, and if more than 50% of those come from <1% of pixels, then it is considered to be noise-dominated and hence unusable.
| Quadrant | # 1 sec bins | Bins with >0 counts | Bins with >2000 counts | High rate bins dominated by noise | Noise dominated (total time) | Noise dominated (detector-on time) | Marked lightcurve |
|---|---|---|---|---|---|---|---|
| A | 7786 | 6986 | 4 | 4 | 0.05% | 0.06% | 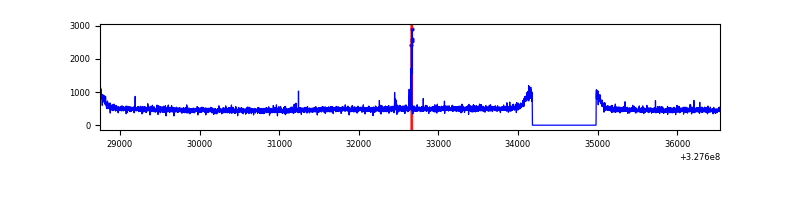 |
| B | 7786 | 6986 | 9 | 9 | 0.12% | 0.13% | 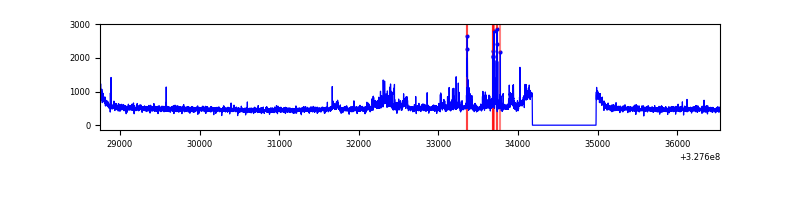 |
| C | 7786 | 6987 | 2 | 2 | 0.03% | 0.03% | 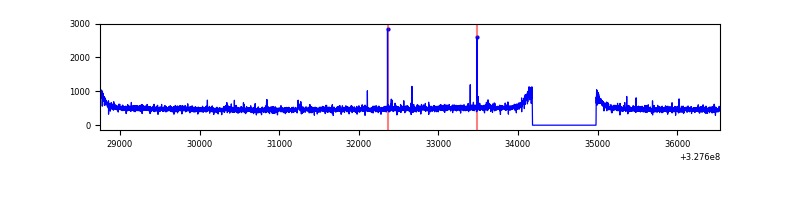 |
| D | 7786 | 6986 | 468 | 468 | 6.01% | 6.70% | 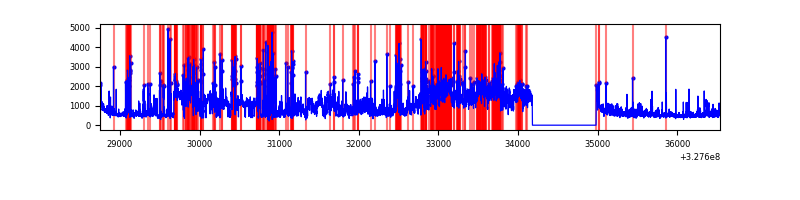 |
Top three noisy pixels from each quadrant. If the there are fewer than three noisy pixels in the level2.evt file, extra rows are filled as -1
| Pixel properties | Quadrant properties | ||||||
|---|---|---|---|---|---|---|---|
| Quadrant | DetID | PixID | Counts | Sigma | Mean | Median | Sigma |
| A | 15 | 174 | 29868 | 162.02 | 880 | 862 | 179.0 |
| A | 13 | 254 | 12162 | 63.12 | 880 | 862 | 179.0 |
| A | 3 | 137 | 8056 | 40.18 | 880 | 862 | 179.0 |
| B | 0 | 189 | 100503 | 583.02 | 883 | 861 | 170.9 |
| B | 0 | 190 | 67178 | 388.03 | 883 | 861 | 170.9 |
| B | 5 | 172 | 60784 | 350.62 | 883 | 861 | 170.9 |
| C | 14 | 238 | 132525 | 660.1 | 842 | 847 | 199.5 |
| C | 7 | 247 | 28584 | 139.05 | 842 | 847 | 199.5 |
| C | 0 | 207 | 13352 | 62.69 | 842 | 847 | 199.5 |
| D | 7 | 223 | 1978657 | 9840.09 | 820 | 799 | 201.0 |
| D | 1 | 52 | 1187014 | 5901.56 | 820 | 799 | 201.0 |
| D | 8 | 195 | 396517 | 1968.75 | 820 | 799 | 201.0 |
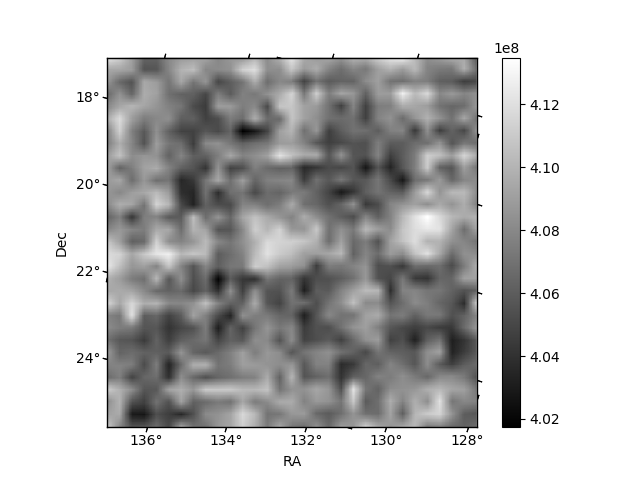
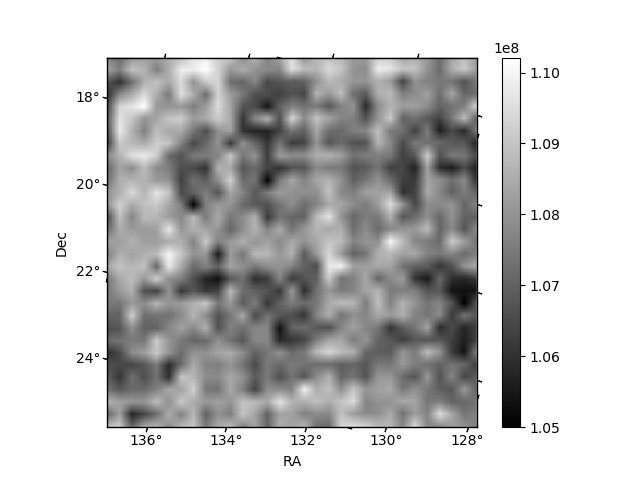
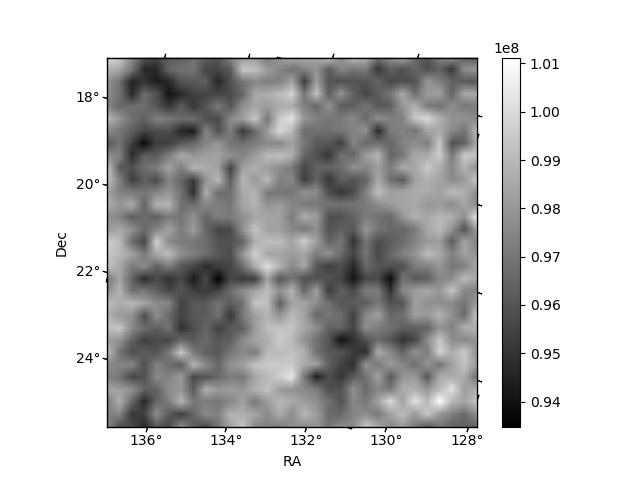
Histogram calculated using DETX and DETY for each event in the final _common_clean file
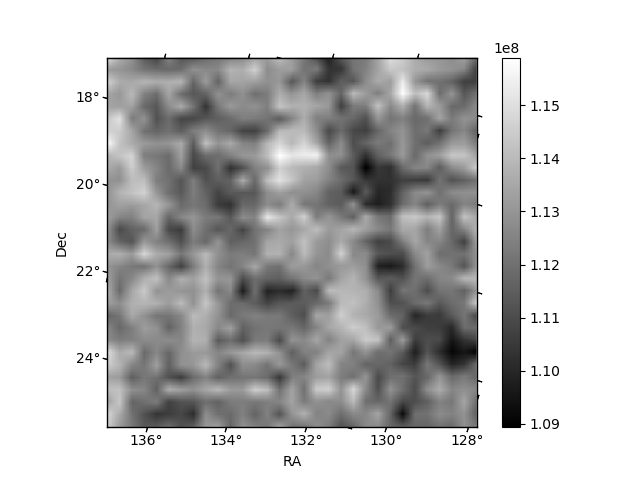
| Quadrant A | 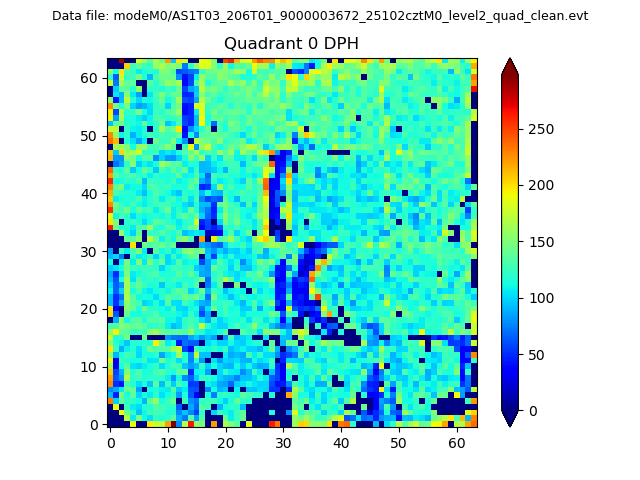 |
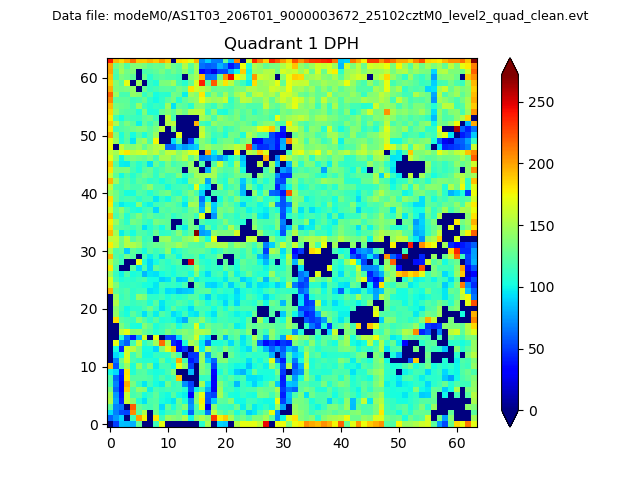 |
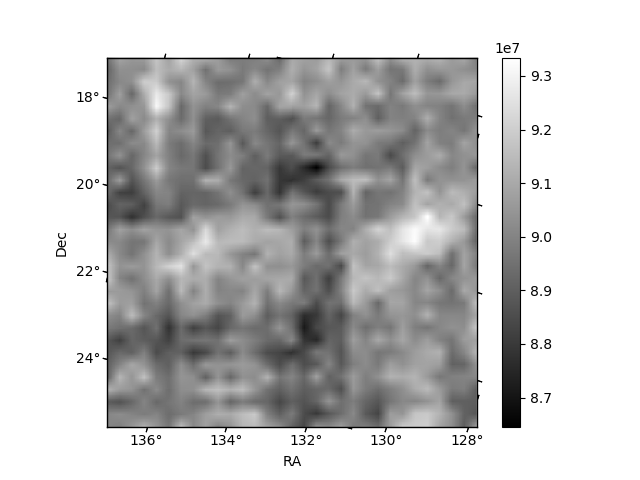
Quadrant B |
|---|---|---|---|
| Quadrant D |  |
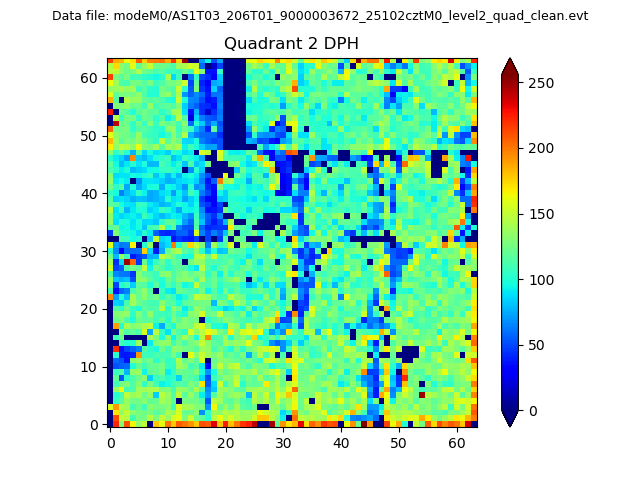 |
Quadrant C |
| Plot type | Count rate plots | Images |
|---|---|---|
| Comparison with Poisson distribution Blue bars denote a histogram of data divided into 1 sec bins. Red curve is a Poisson curve with rate = median count rate of data. |
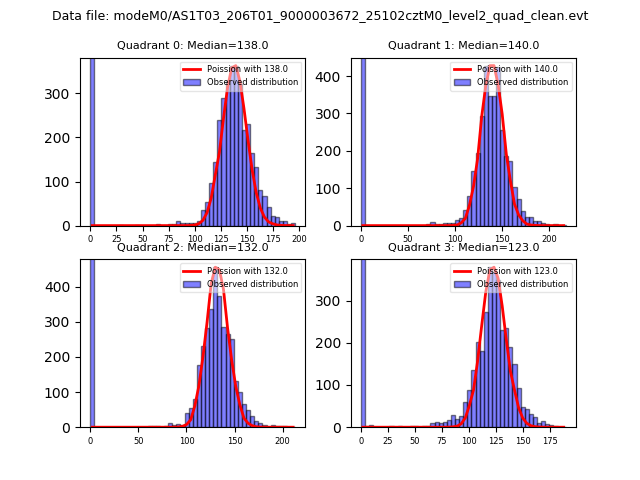 |
 |
| Quadrant-wise count rates Data is divided into 100 sec bins |
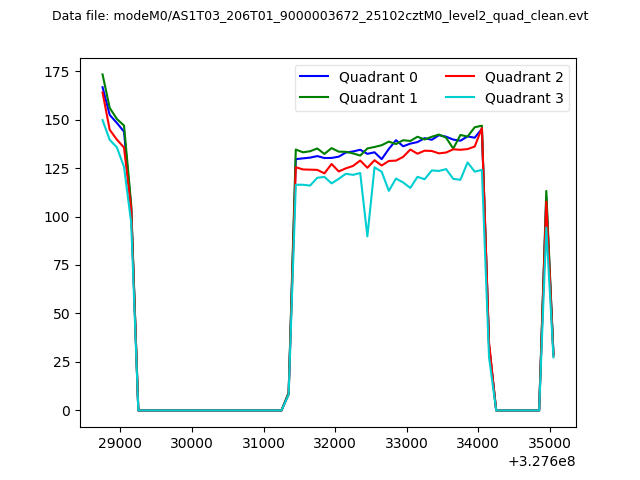 |
|
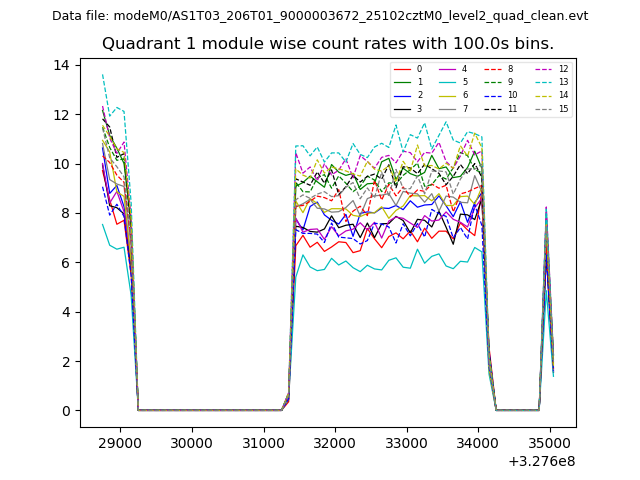
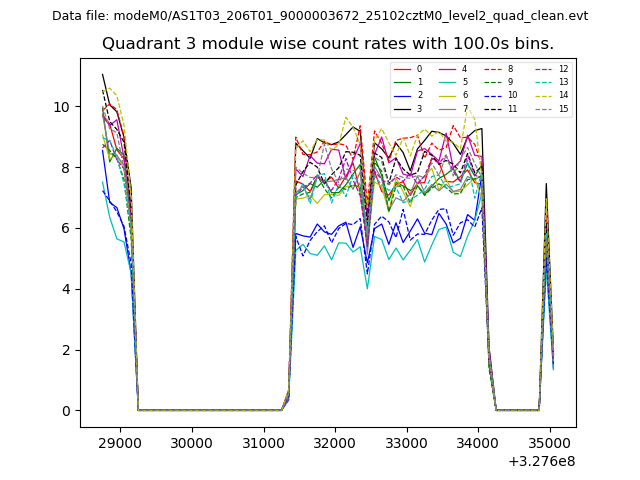
| Module-wise count rates for Quadrant A Data is divided into 100 sec bins |
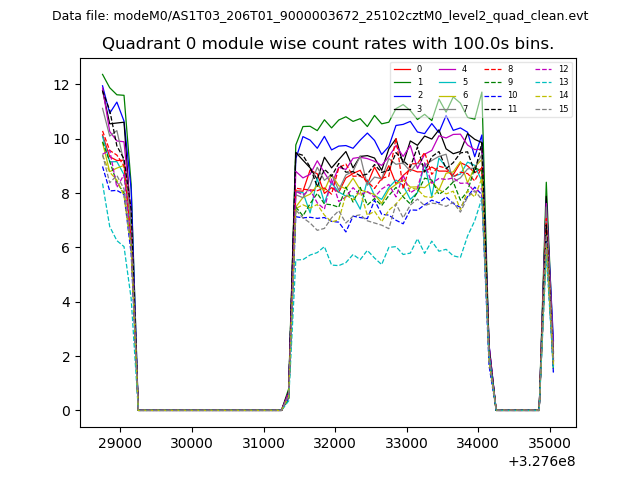 |
 |
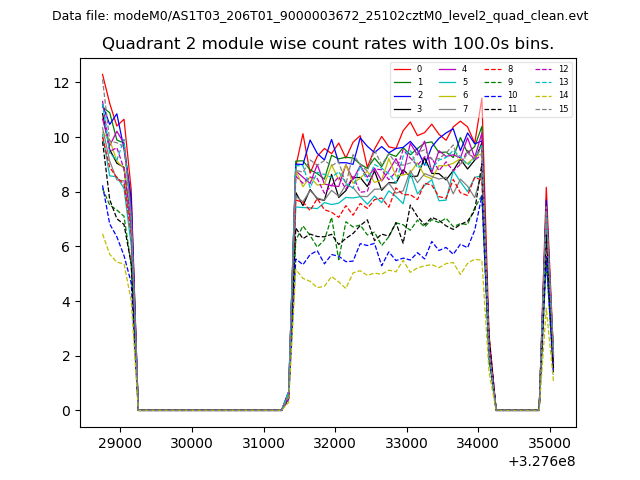
| Module-wise count rates for Quadrant B Data is divided into 100 sec bins |
 |
 |
| Module-wise count rates for Quadrant C Data is divided into 100 sec bins |
 |
 |
| Module-wise count rates for Quadrant D Data is divided into 100 sec bins |
 |
 |
| Parameter | Plot |
|---|---|
| CZT HV Monitor | 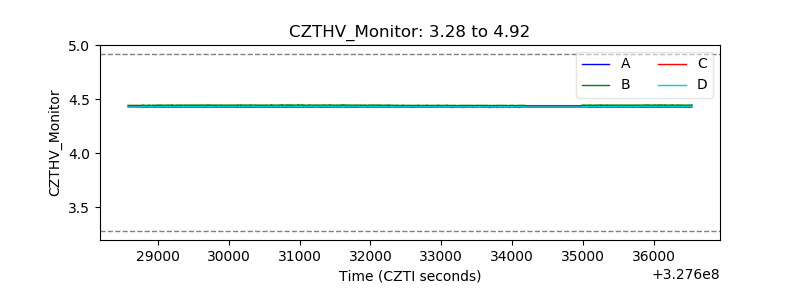 |
| D_VDD | 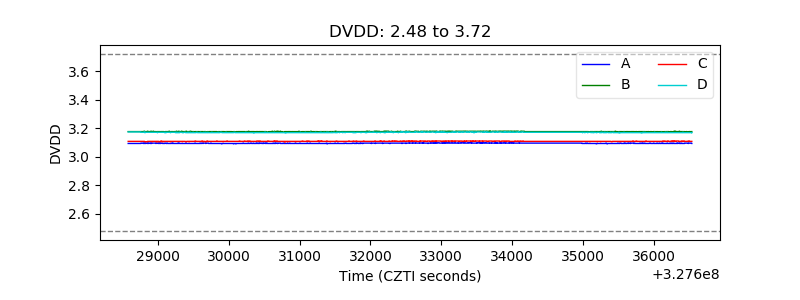 |
| Temperature 1 | 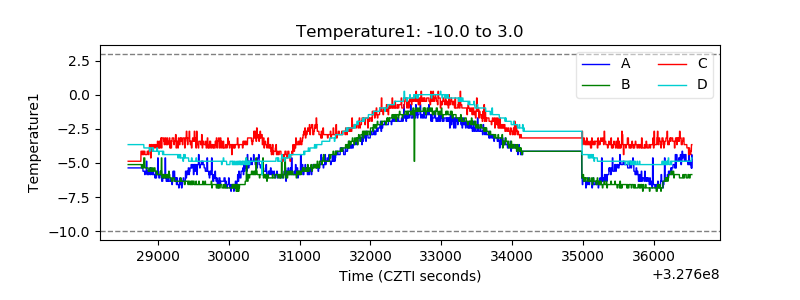 |
| Veto HV Monitor |  |
| Veto LLD | 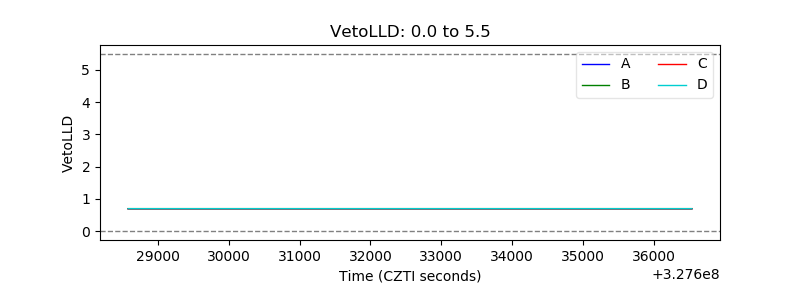 |
| Alpha Counter | 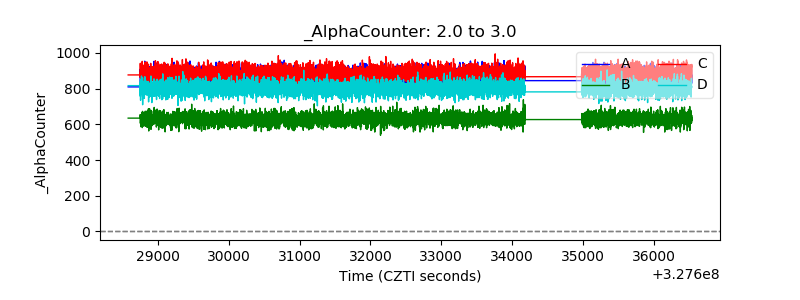 |
| _CPM_Rate | 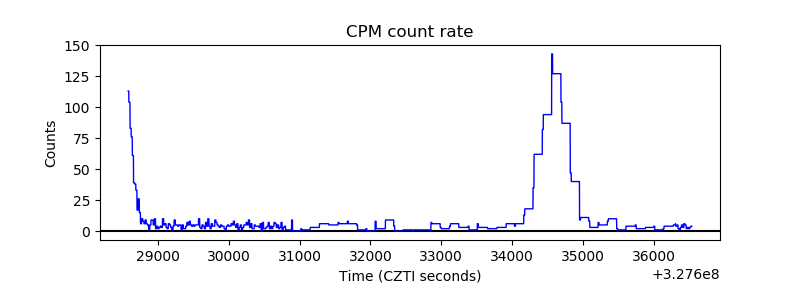 |
| CZT Counter | 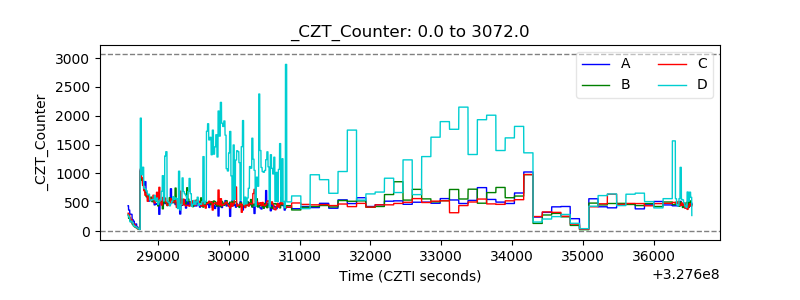 |
| +2.5 Volts monitor |  |
| +5 Volts monitor |  |
| _ROLL_ROT | 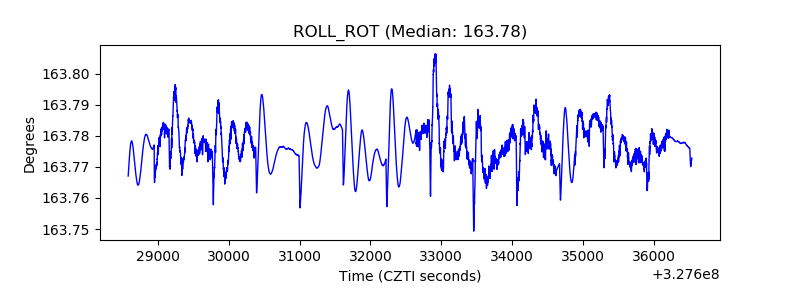 |
| _Roll_DEC | 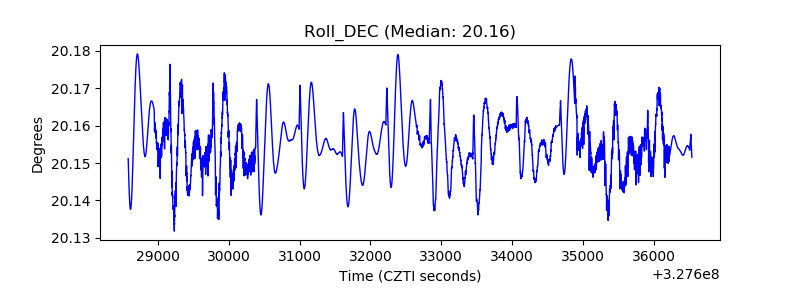 |
| _Roll_RA | 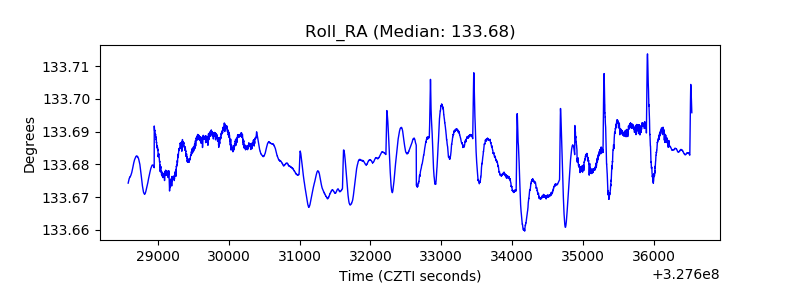 |
| Veto Counter | 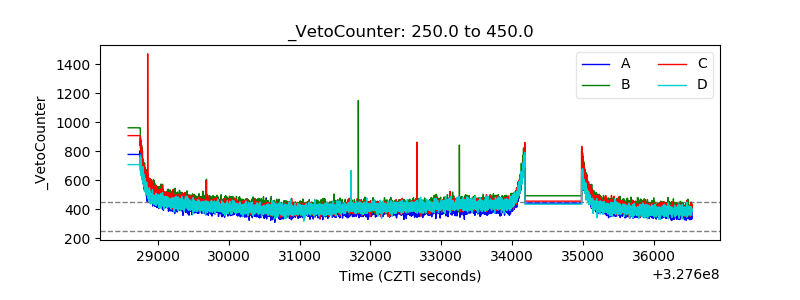 |