| Param | Original file | Final file |
|---|---|---|
| Filename | modeM0/AS1T03_206T01_9000003672_25103cztM0_level2.evt | modeM0/AS1T03_206T01_9000003672_25103cztM0_level2_quad_clean.evt |
| Size (bytes) | 415,823,040 | 58,199,040 |
| Size | 396.6 MB | 55.5 MB |
| Events in quadrant A | 2,358,109 | 368,834 |
| Events in quadrant B | 2,502,214 | 375,276 |
| Events in quadrant C | 2,373,683 | 353,218 |
| Events in quadrant D | 5,016,710 | 311,098 |
| Mode M9 | |||
|---|---|---|---|
| Quadrant | BADHDUFLAG | Total packets | Discarded packets |
| A | 0 | 4 | 0 |
| B | 0 | 5 | 0 |
| C | 0 | 5 | 0 |
| D | 0 | 5 | 0 |
| Mode M0 | |||
|---|---|---|---|
| Quadrant | BADHDUFLAG | Total packets | Discarded packets |
| A | 0 | 10220 | 0 |
| B | 0 | 10537 | 0 |
| C | 0 | 10241 | 0 |
| D | 0 | 18334 | 0 |
| Quadrant | Total seconds | Saturated seconds | Saturation percentage |
|---|---|---|---|
| A | 5041 | 17 | 0.337235% |
| B | 5041 | 28 | 0.555445% |
| C | 5041 | 32 | 0.634795% |
| D | 5041 | 644 | 12.775243% |
Noise dominated data is calculated using 1-second bins in cleaned event files. If a bin has >2000 counts, and if more than 50% of those come from <1% of pixels, then it is considered to be noise-dominated and hence unusable.
| Quadrant | # 1 sec bins | Bins with >0 counts | Bins with >2000 counts | High rate bins dominated by noise | Noise dominated (total time) | Noise dominated (detector-on time) | Marked lightcurve |
|---|---|---|---|---|---|---|---|
| A | 5041 | 5041 | 0 | 0 | 0.00% | 0.00% | 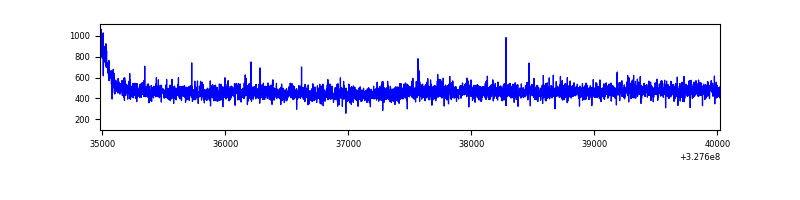 |
| B | 5041 | 5041 | 0 | 0 | 0.00% | 0.00% | 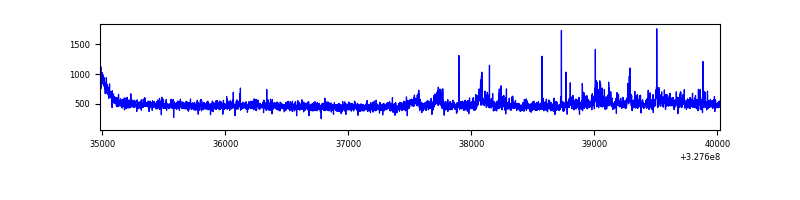 |
| C | 5041 | 5041 | 0 | 0 | 0.00% | 0.00% | 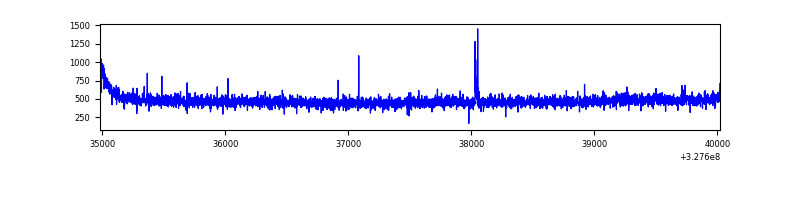 |
| D | 5041 | 5041 | 568 | 568 | 11.27% | 11.27% | 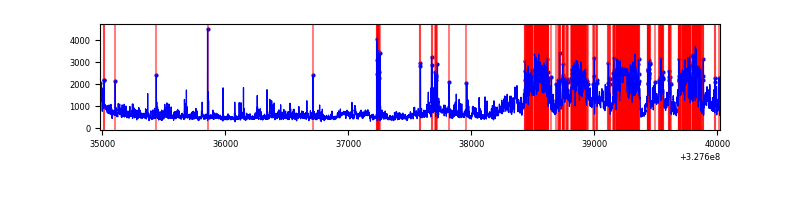 |
Top three noisy pixels from each quadrant. If the there are fewer than three noisy pixels in the level2.evt file, extra rows are filled as -1
| Pixel properties | Quadrant properties | ||||||
|---|---|---|---|---|---|---|---|
| Quadrant | DetID | PixID | Counts | Sigma | Mean | Median | Sigma |
| A | 13 | 254 | 8464 | 63.77 | 609 | 595 | 123.4 |
| A | 3 | 137 | 5551 | 40.16 | 609 | 595 | 123.4 |
| A | 0 | 226 | 5247 | 37.7 | 609 | 595 | 123.4 |
| B | 0 | 229 | 39898 | 337.5 | 607 | 592 | 116.5 |
| B | 0 | 190 | 34613 | 292.12 | 607 | 592 | 116.5 |
| B | 0 | 189 | 34361 | 289.95 | 607 | 592 | 116.5 |
| C | 14 | 238 | 92760 | 668.66 | 580 | 584 | 137.9 |
| C | 0 | 207 | 6722 | 44.53 | 580 | 584 | 137.9 |
| C | 2 | 16 | 5176 | 33.31 | 580 | 584 | 137.9 |
| D | 12 | 33 | 1188686 | 8512.33 | 563 | 546 | 139.6 |
| D | 1 | 52 | 708599 | 5072.79 | 563 | 546 | 139.6 |
| D | 7 | 223 | 519366 | 3717.04 | 563 | 546 | 139.6 |
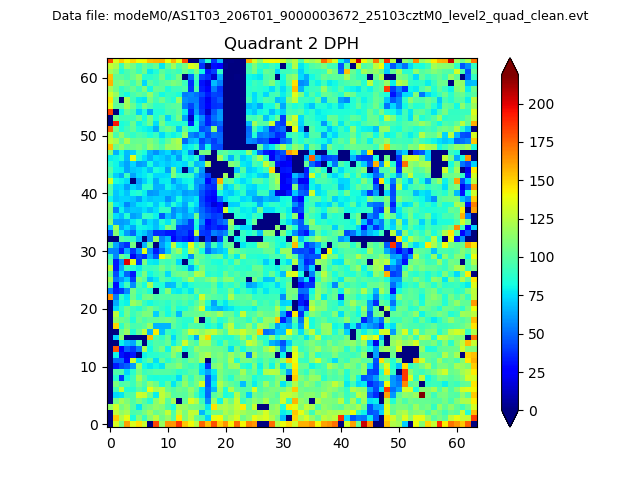
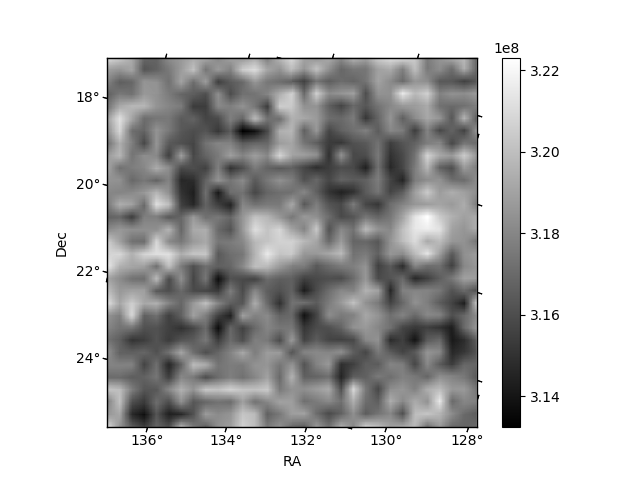
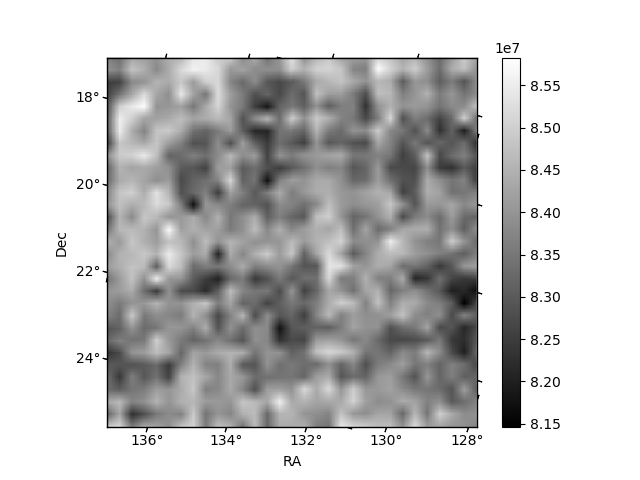
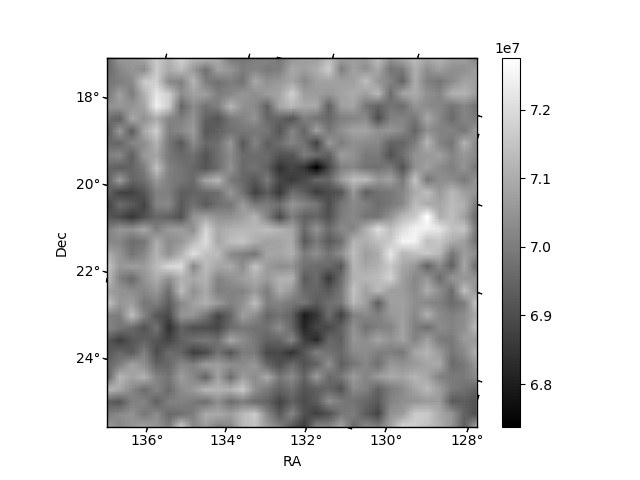
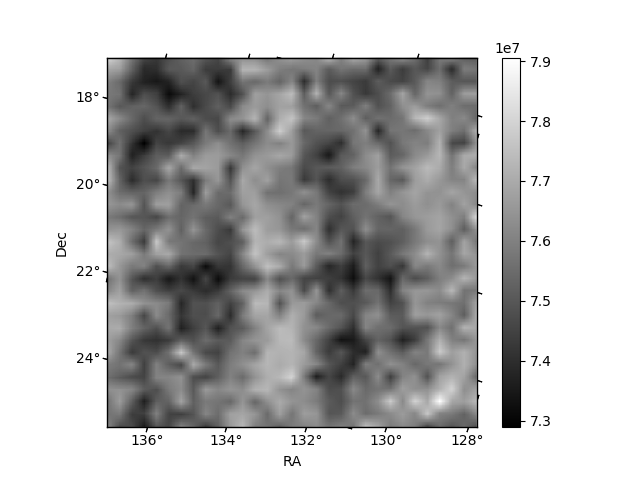
Histogram calculated using DETX and DETY for each event in the final _common_clean file
| Quadrant A | 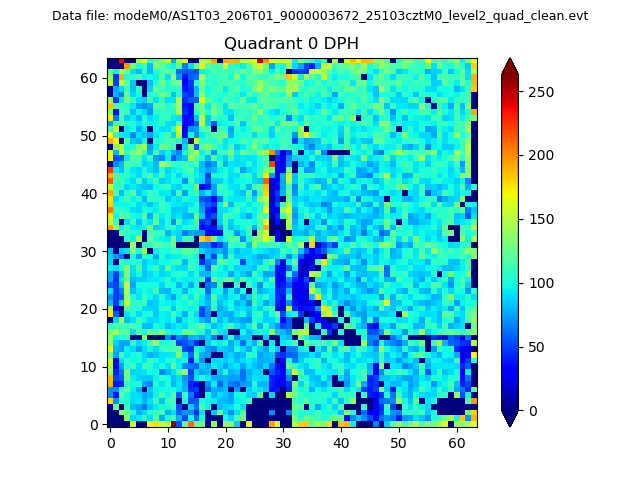 |
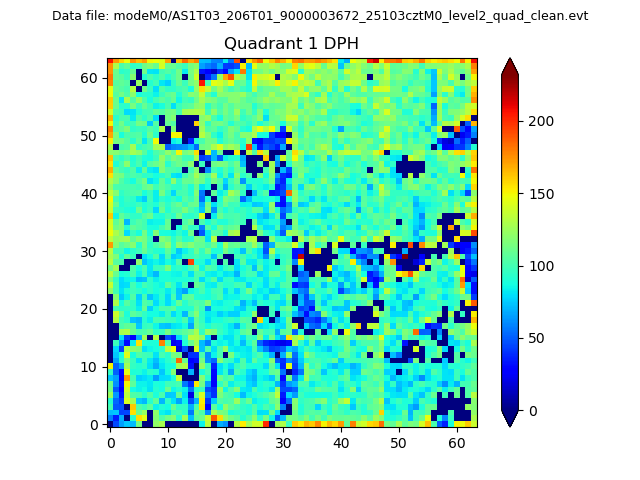 |
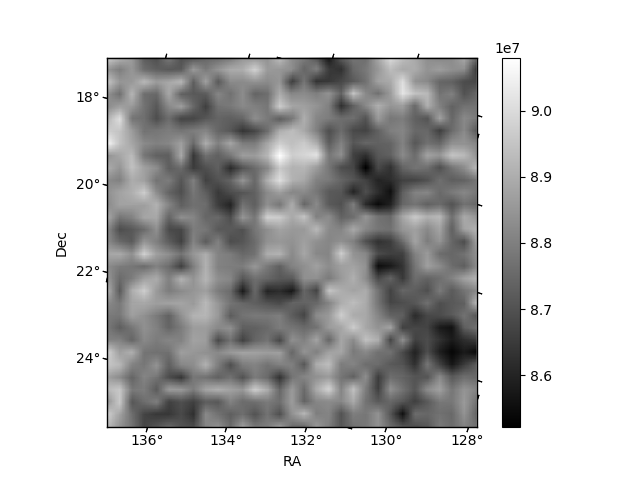
Quadrant B |
|---|---|---|---|
| Quadrant D | 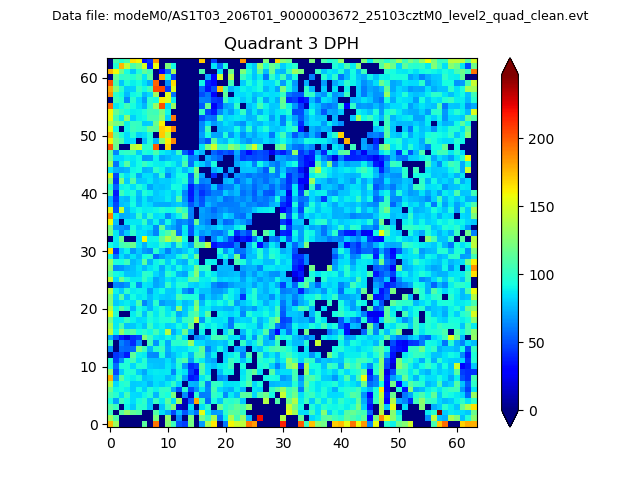 |
 |
Quadrant C |
| Plot type | Count rate plots | Images |
|---|---|---|
| Comparison with Poisson distribution Blue bars denote a histogram of data divided into 1 sec bins. Red curve is a Poisson curve with rate = median count rate of data. |
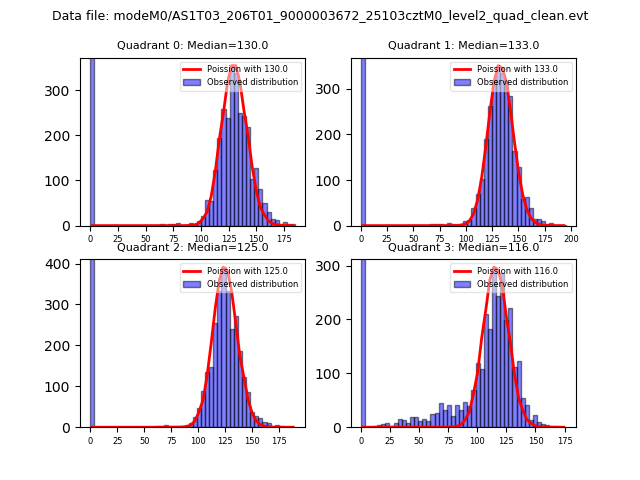 |
 |
| Quadrant-wise count rates Data is divided into 100 sec bins |
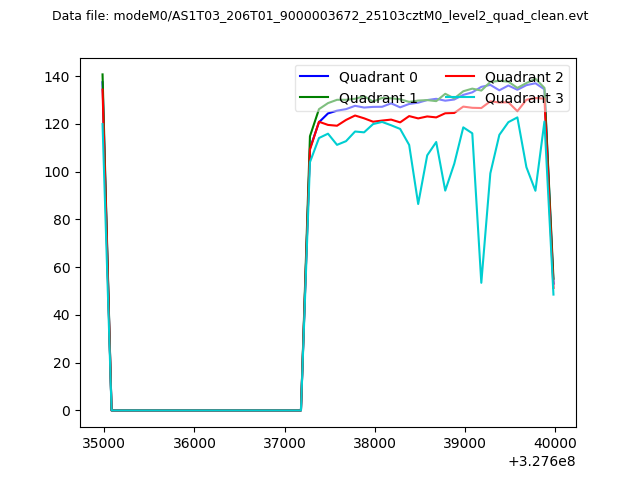 |
|
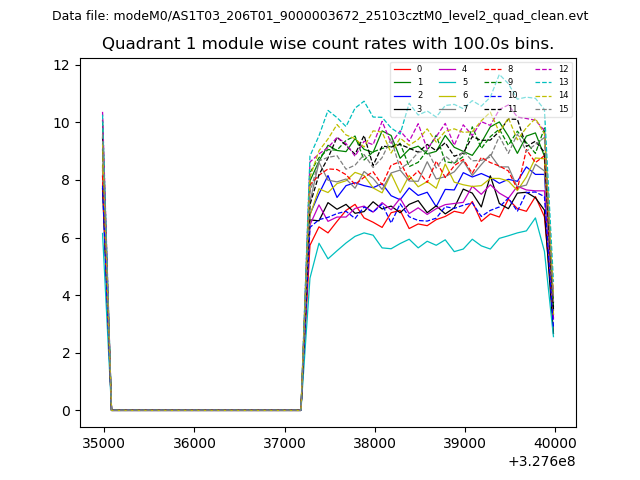
| Module-wise count rates for Quadrant A Data is divided into 100 sec bins |
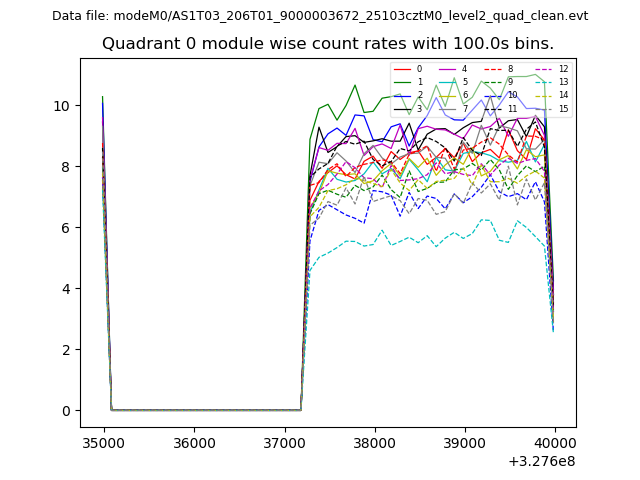 |
 |
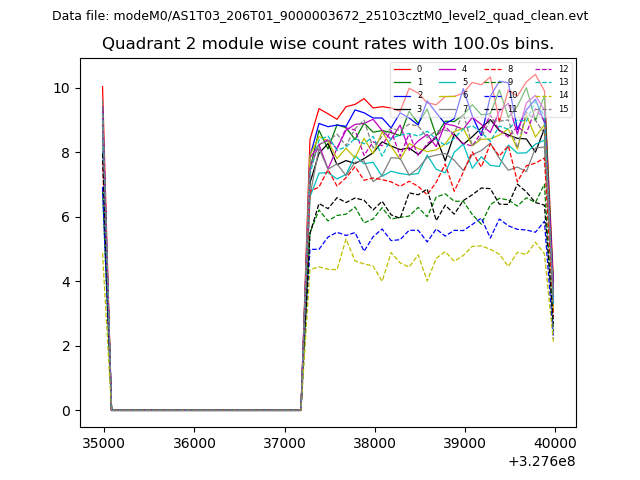
| Module-wise count rates for Quadrant B Data is divided into 100 sec bins |
 |
 |
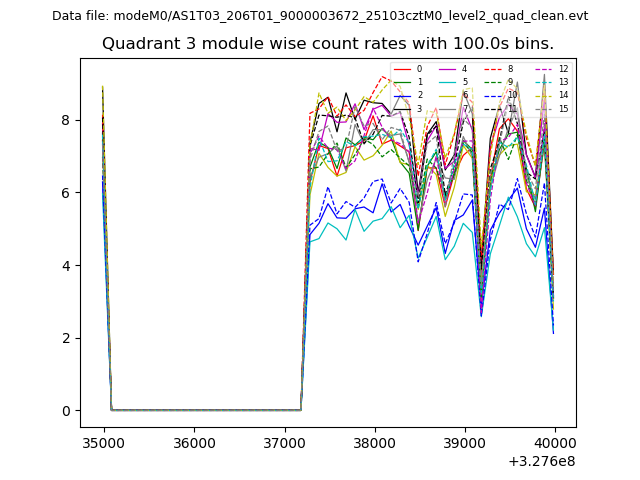
| Module-wise count rates for Quadrant C Data is divided into 100 sec bins |
 |
 |
| Module-wise count rates for Quadrant D Data is divided into 100 sec bins |
 |
 |
| Parameter | Plot |
|---|---|
| CZT HV Monitor | 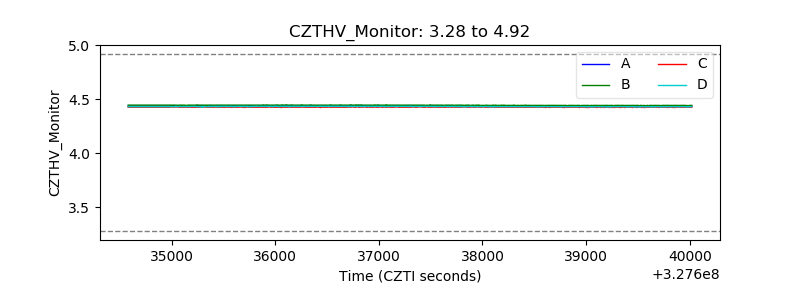 |
| D_VDD | 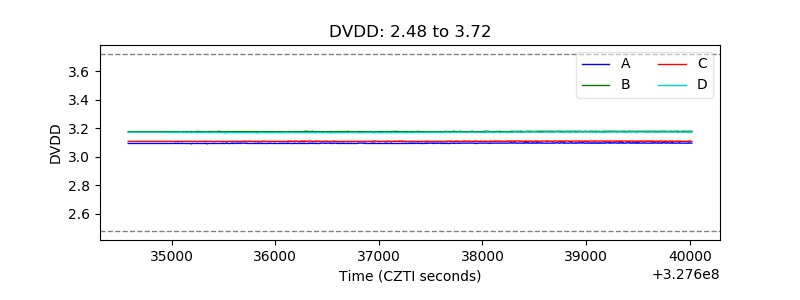 |
| Temperature 1 | 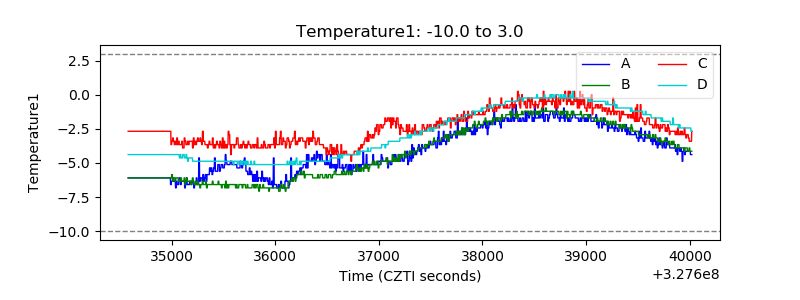 |
| Veto HV Monitor | 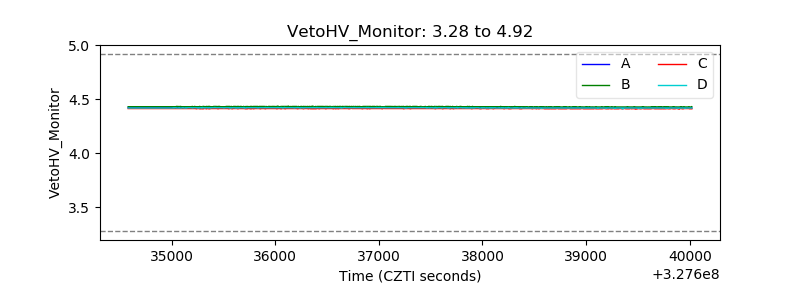 |
| Veto LLD | 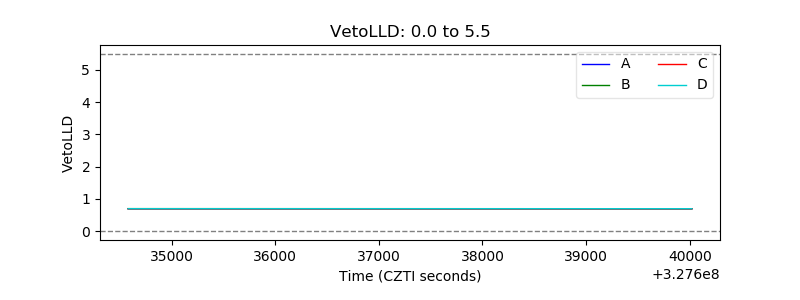 |
| Alpha Counter | 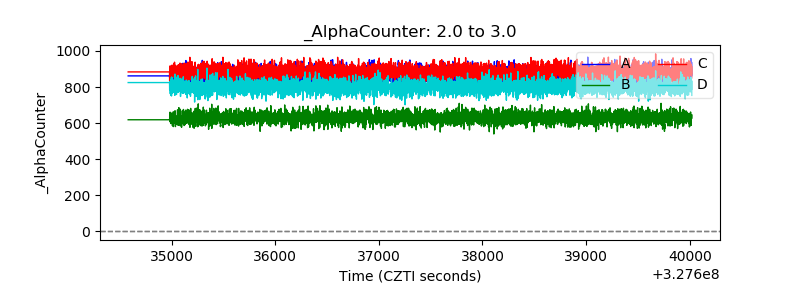 |
| _CPM_Rate | 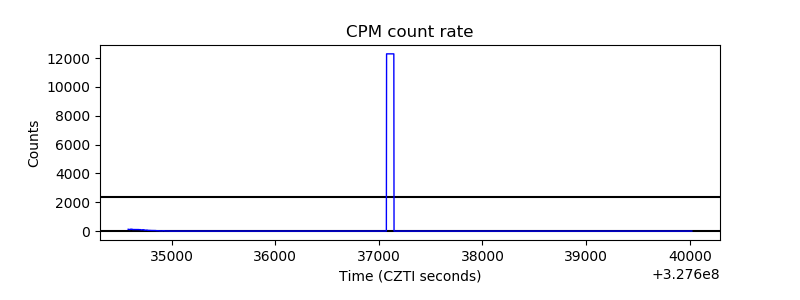 |
| CZT Counter | 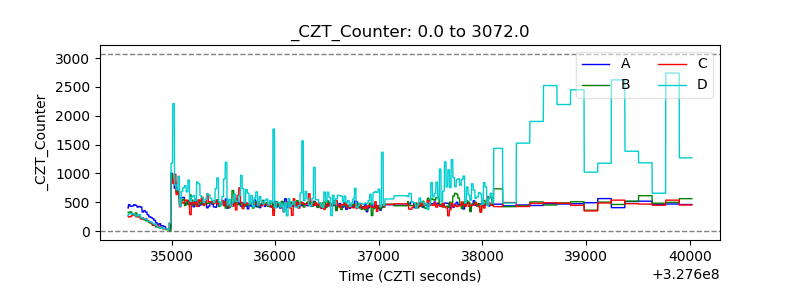 |
| +2.5 Volts monitor | 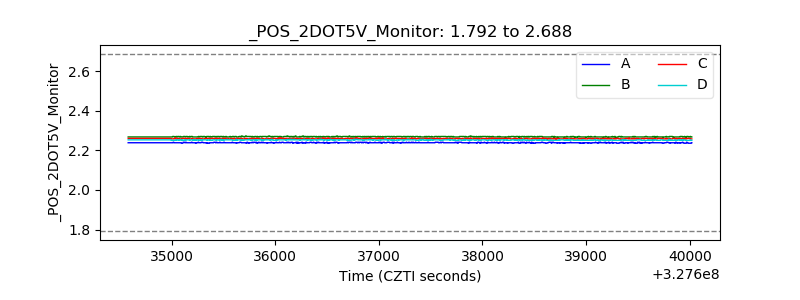 |
| +5 Volts monitor |  |
| _ROLL_ROT | 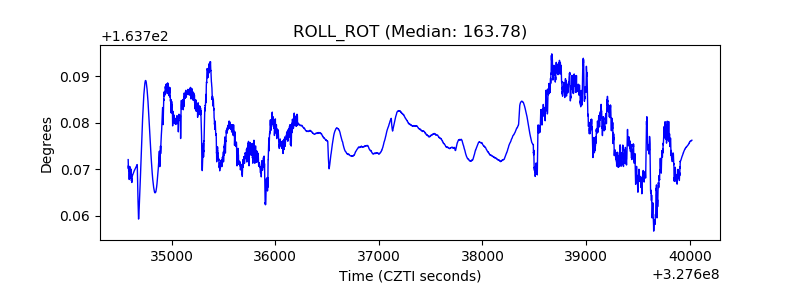 |
| _Roll_DEC | 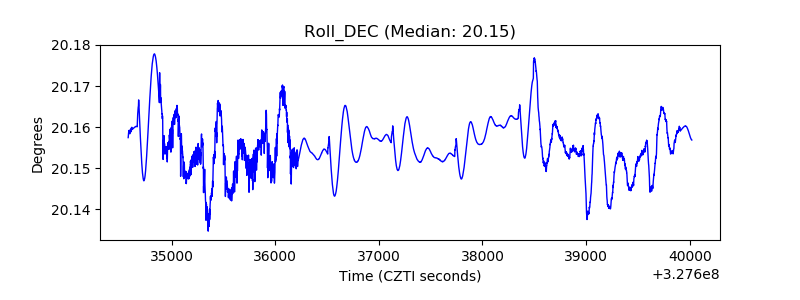 |
| _Roll_RA | 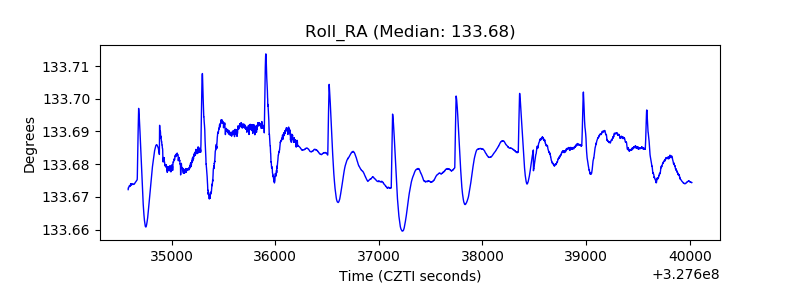 |
| Veto Counter | 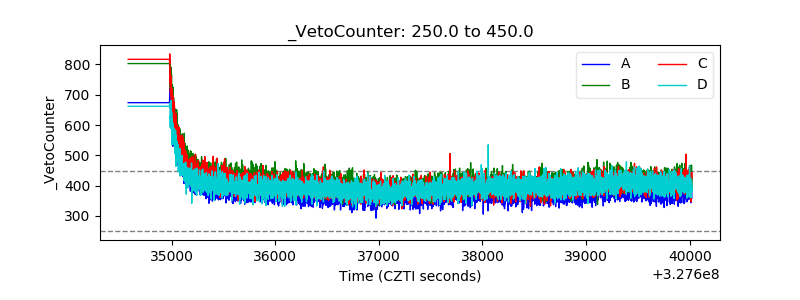 |