| Param | Original file | Final file |
|---|---|---|
| Filename | modeM0/AS1C05_012T06_9000003674_25103cztM0_level2.evt | modeM0/AS1C05_012T06_9000003674_25103cztM0_level2_quad_clean.evt |
| Size (bytes) | 113,604,480 | 28,627,200 |
| Size | 108.3 MB | 27.3 MB |
| Events in quadrant A | 670,721 | 191,225 |
| Events in quadrant B | 692,013 | 195,684 |
| Events in quadrant C | 702,248 | 187,815 |
| Events in quadrant D | 1,268,724 | 178,438 |
| Mode M9 | |||
|---|---|---|---|
| Quadrant | BADHDUFLAG | Total packets | Discarded packets |
| A | 0 | 2 | 0 |
| B | 0 | 2 | 0 |
| C | 0 | 2 | 0 |
| D | 0 | 2 | 0 |
| Mode M0 | |||
|---|---|---|---|
| Quadrant | BADHDUFLAG | Total packets | Discarded packets |
| A | 0 | 3131 | 0 |
| B | 0 | 3157 | 0 |
| C | 0 | 3175 | 0 |
| D | 0 | 4845 | 0 |
| Quadrant | Total seconds | Saturated seconds | Saturation percentage |
|---|---|---|---|
| A | 1525 | 20 | 1.311475% |
| B | 1525 | 32 | 2.098361% |
| C | 1525 | 34 | 2.229508% |
| D | 1525 | 63 | 4.131148% |
Noise dominated data is calculated using 1-second bins in cleaned event files. If a bin has >2000 counts, and if more than 50% of those come from <1% of pixels, then it is considered to be noise-dominated and hence unusable.
| Quadrant | # 1 sec bins | Bins with >0 counts | Bins with >2000 counts | High rate bins dominated by noise | Noise dominated (total time) | Noise dominated (detector-on time) | Marked lightcurve |
|---|---|---|---|---|---|---|---|
| A | 1525 | 1525 | 0 | 0 | 0.00% | 0.00% | 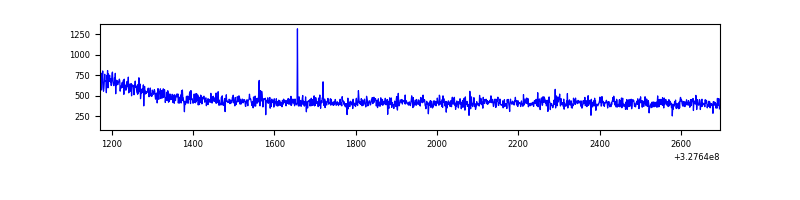 |
| B | 1525 | 1525 | 0 | 0 | 0.00% | 0.00% | 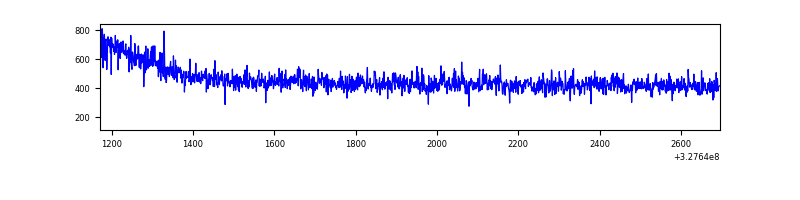 |
| C | 1525 | 1525 | 0 | 0 | 0.00% | 0.00% | 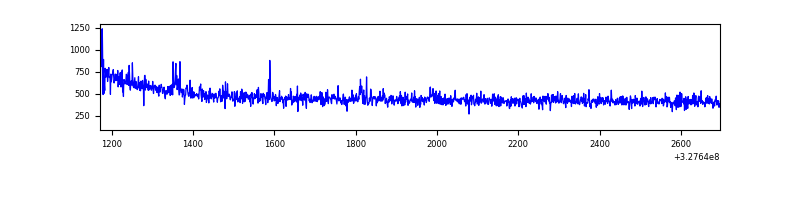 |
| D | 1525 | 1525 | 27 | 27 | 1.77% | 1.77% | 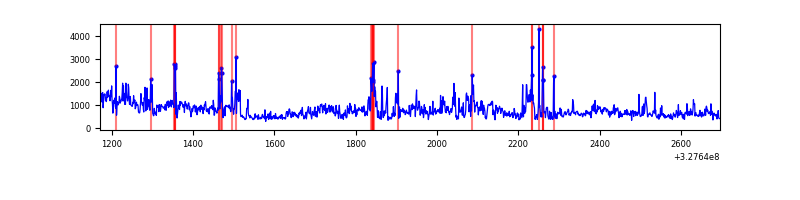 |
Top three noisy pixels from each quadrant. If the there are fewer than three noisy pixels in the level2.evt file, extra rows are filled as -1
| Pixel properties | Quadrant properties | ||||||
|---|---|---|---|---|---|---|---|
| Quadrant | DetID | PixID | Counts | Sigma | Mean | Median | Sigma |
| A | 13 | 254 | 2685 | 68.09 | 173 | 169 | 36.9 |
| A | 3 | 137 | 1651 | 40.11 | 173 | 169 | 36.9 |
| A | 13 | 158 | 1538 | 37.05 | 173 | 169 | 36.9 |
| B | 12 | 111 | 4167 | 112.61 | 176 | 171 | 35.5 |
| B | 11 | 111 | 3775 | 101.56 | 176 | 171 | 35.5 |
| B | 14 | 111 | 3299 | 88.15 | 176 | 171 | 35.5 |
| C | 14 | 238 | 27627 | 656.22 | 169 | 169 | 41.8 |
| C | 3 | 233 | 9199 | 215.81 | 169 | 169 | 41.8 |
| C | 2 | 16 | 5340 | 123.58 | 169 | 169 | 41.8 |
| D | 7 | 223 | 326980 | 7779.01 | 164 | 158 | 42.0 |
| D | 1 | 52 | 222515 | 5292.54 | 164 | 158 | 42.0 |
| D | 8 | 195 | 78661 | 1868.53 | 164 | 158 | 42.0 |
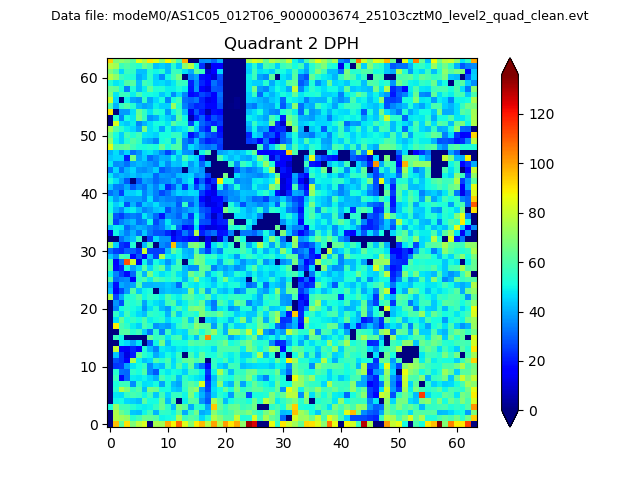
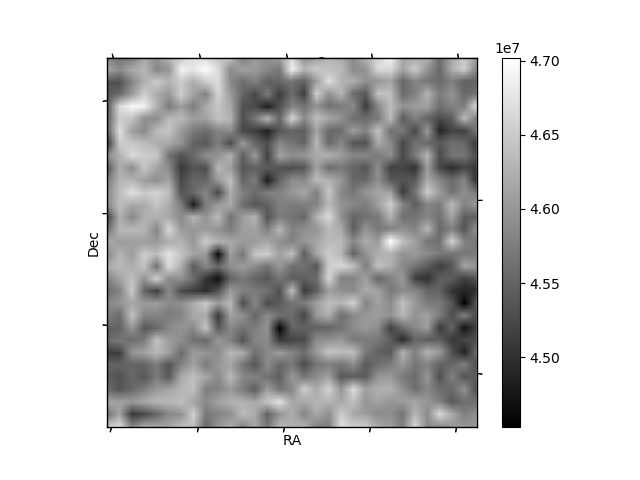
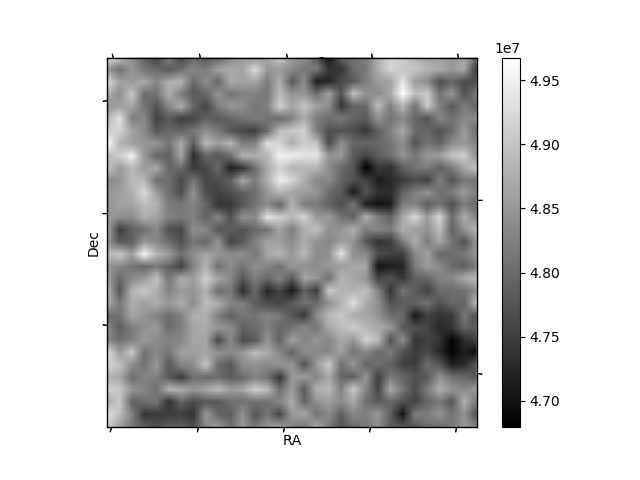
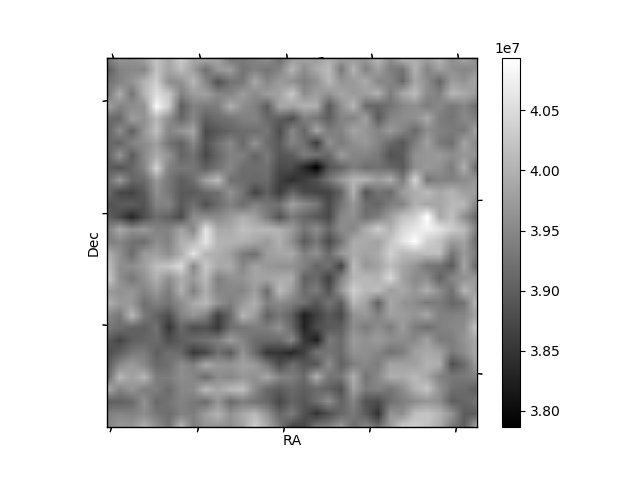
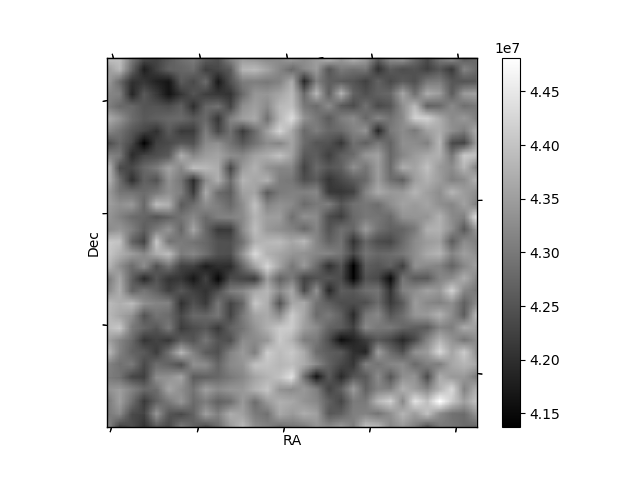
Histogram calculated using DETX and DETY for each event in the final _common_clean file
| Quadrant A |  |
 |
Quadrant B |
|---|---|---|---|
| Quadrant D | 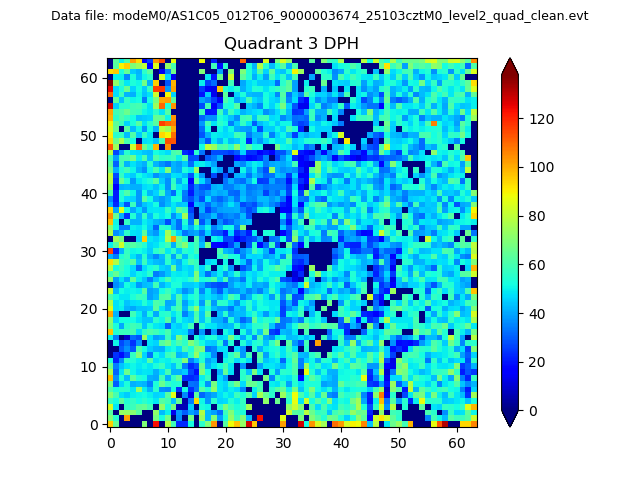 |
 |
Quadrant C |
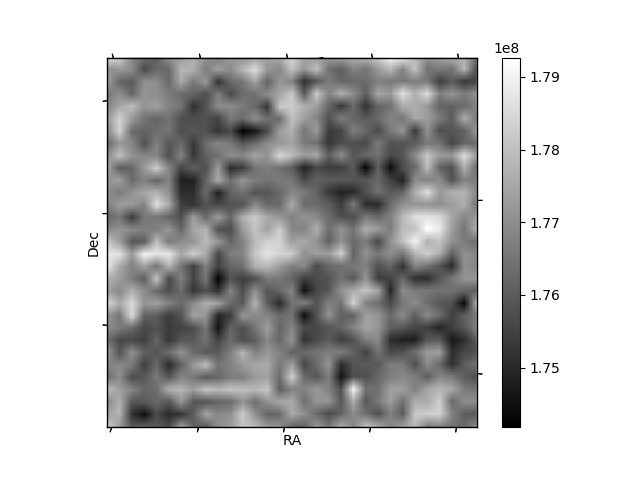
| Plot type | Count rate plots | Images |
|---|---|---|
| Comparison with Poisson distribution Blue bars denote a histogram of data divided into 1 sec bins. Red curve is a Poisson curve with rate = median count rate of data. |
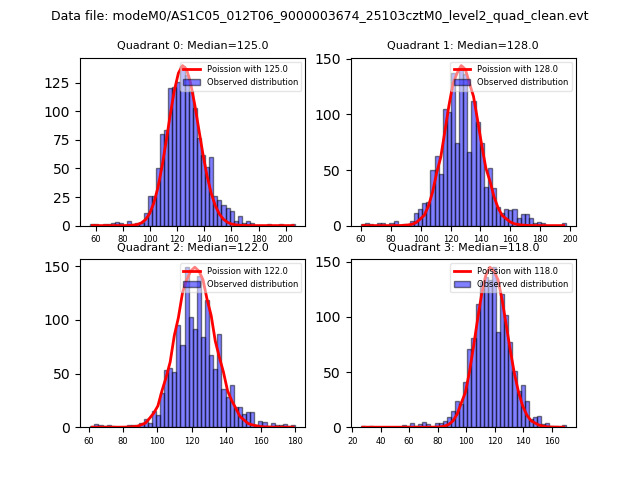 |
 |
| Quadrant-wise count rates Data is divided into 100 sec bins |
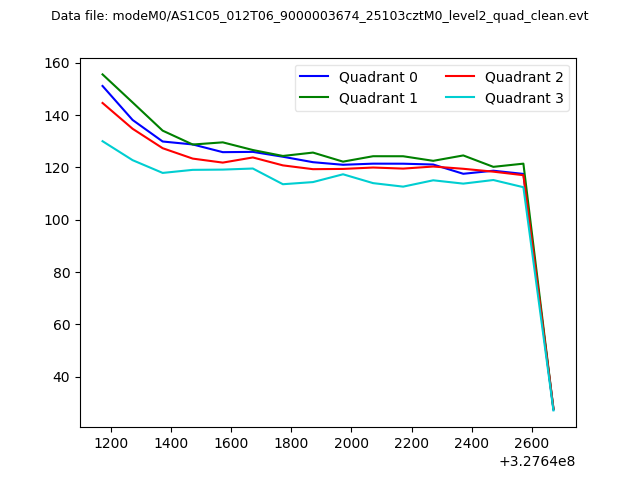 |
|
| Module-wise count rates for Quadrant A Data is divided into 100 sec bins |
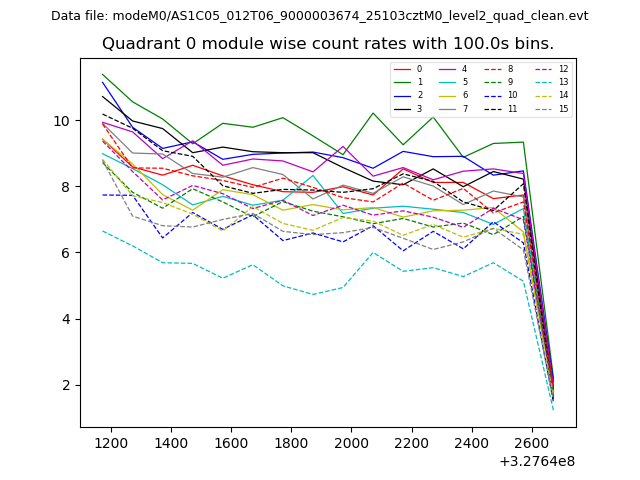 |
 |
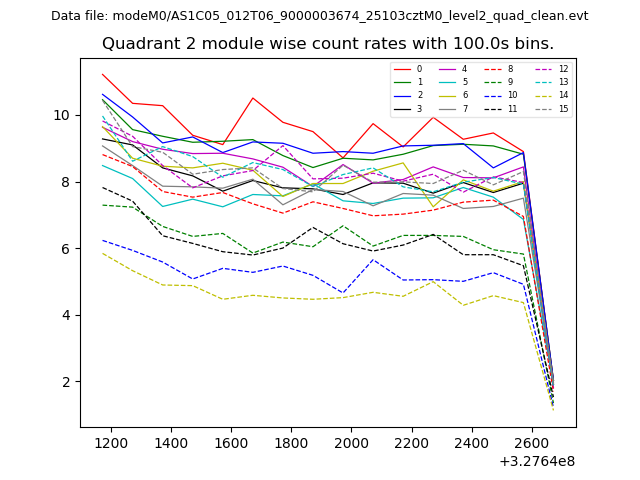
| Module-wise count rates for Quadrant B Data is divided into 100 sec bins |
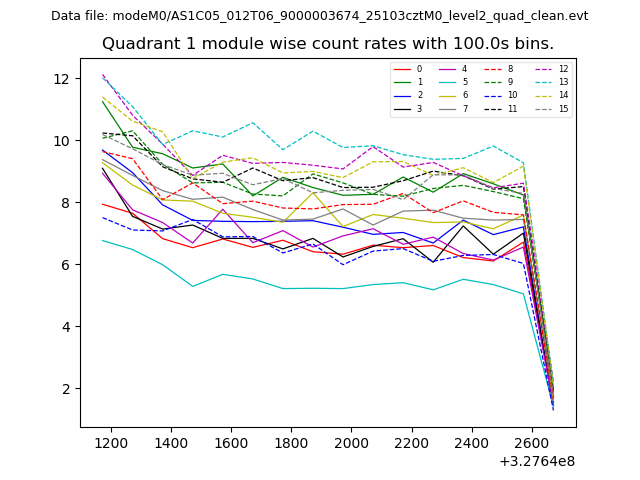 |
 |
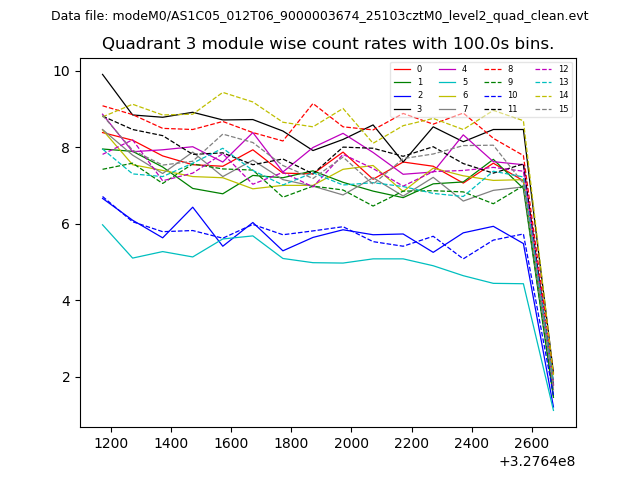
| Module-wise count rates for Quadrant C Data is divided into 100 sec bins |
 |
 |
| Module-wise count rates for Quadrant D Data is divided into 100 sec bins |
 |
 |
| Parameter | Plot |
|---|---|
| CZT HV Monitor | 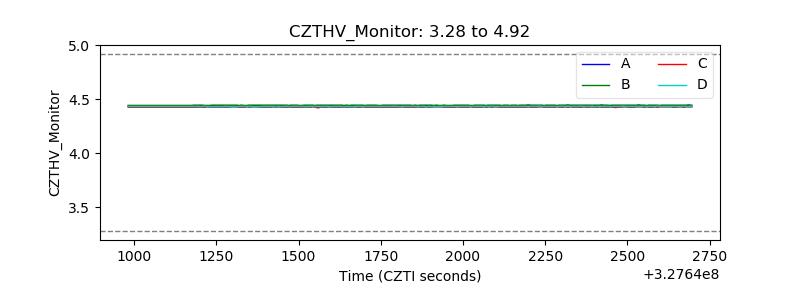 |
| D_VDD | 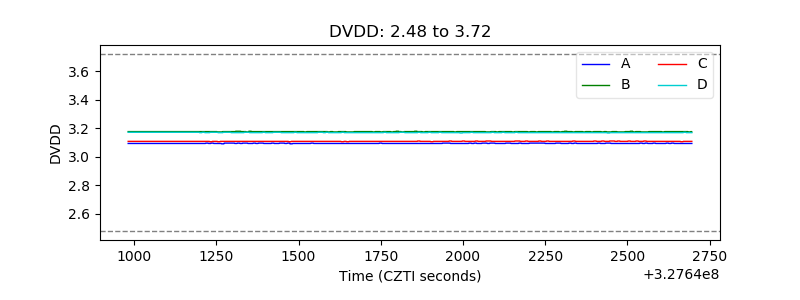 |
| Temperature 1 | 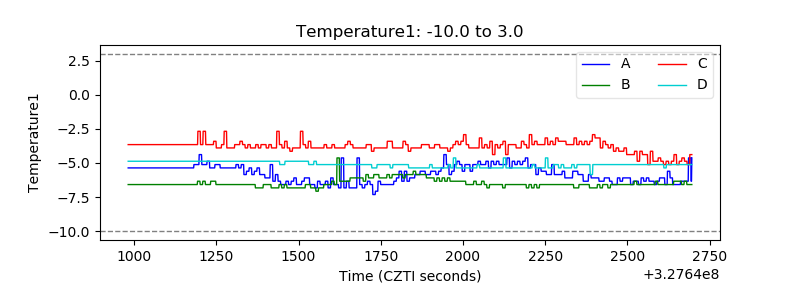 |
| Veto HV Monitor | 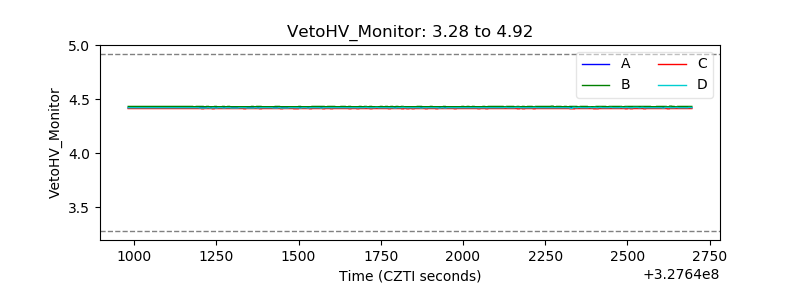 |
| Veto LLD | 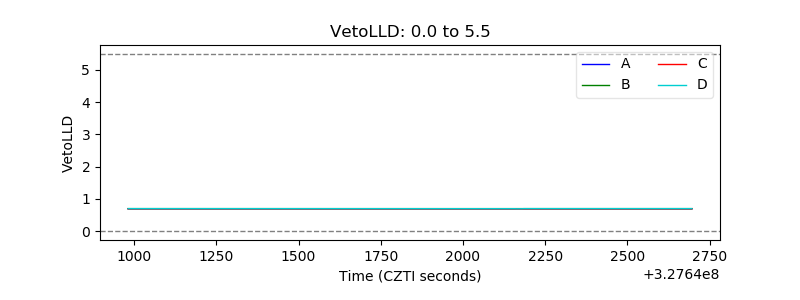 |
| Alpha Counter | 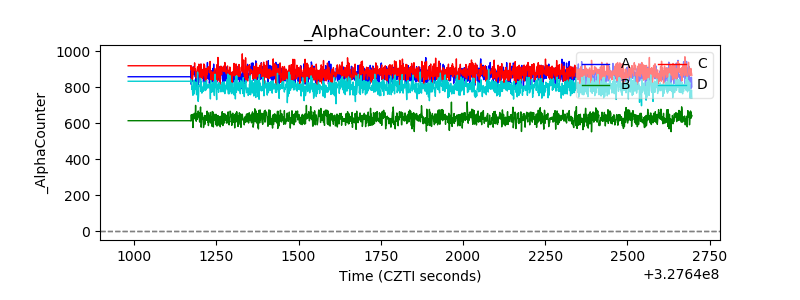 |
| _CPM_Rate | 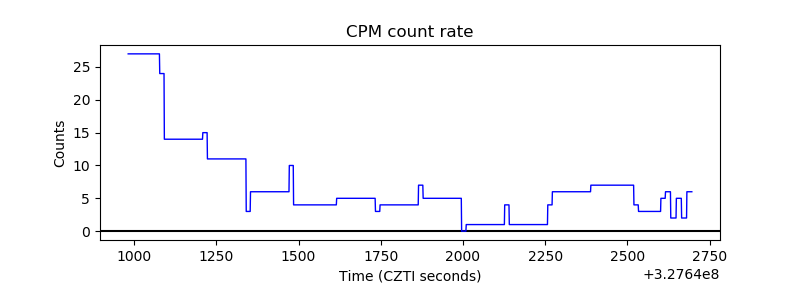 |
| CZT Counter | 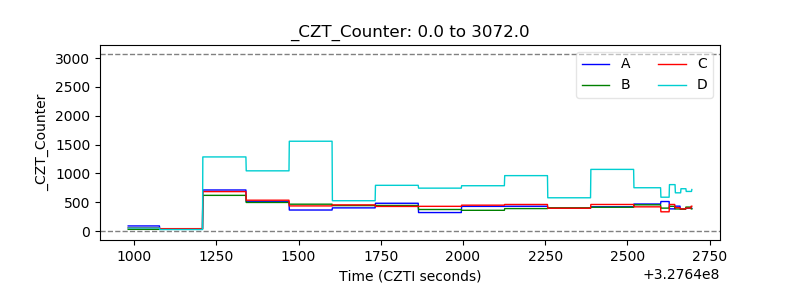 |
| +2.5 Volts monitor |  |
| +5 Volts monitor | 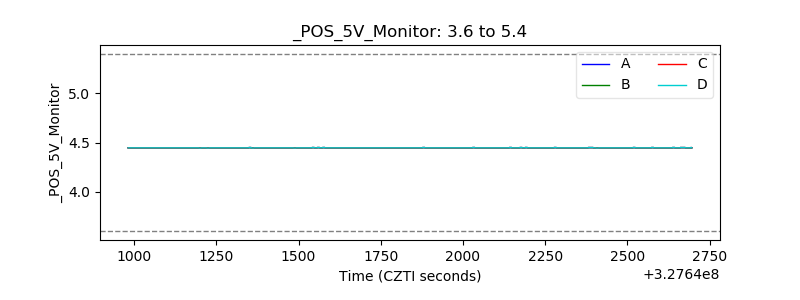 |
| _ROLL_ROT |  |
| _Roll_DEC | 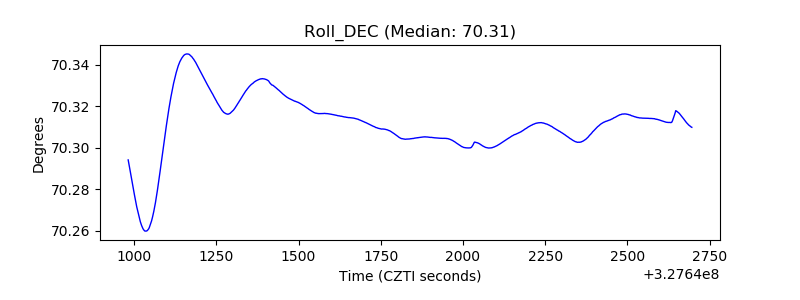 |
| _Roll_RA | 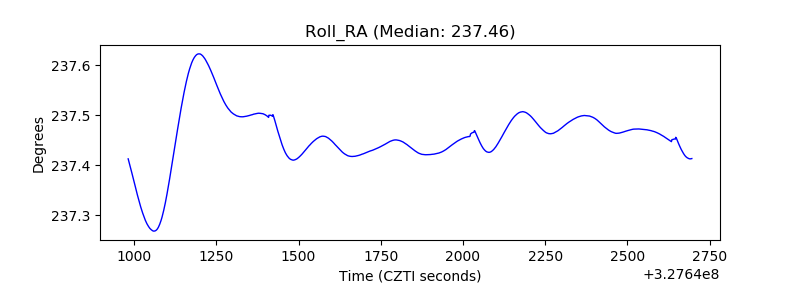 |
| Veto Counter | 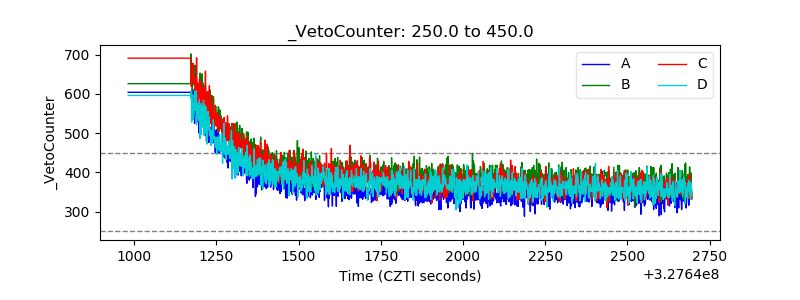 |