| Param | Original file | Final file |
|---|---|---|
| Filename | modeM0/AS1C05_012T06_9000003674_25105cztM0_level2.evt | modeM0/AS1C05_012T06_9000003674_25105cztM0_level2_quad_clean.evt |
| Size (bytes) | 620,352,000 | 99,604,800 |
| Size | 591.6 MB | 95.0 MB |
| Events in quadrant A | 3,120,480 | 657,184 |
| Events in quadrant B | 3,257,385 | 666,994 |
| Events in quadrant C | 3,227,810 | 635,472 |
| Events in quadrant D | 8,712,015 | 573,146 |
| Mode M9 | |||
|---|---|---|---|
| Quadrant | BADHDUFLAG | Total packets | Discarded packets |
| A | 0 | 3 | 0 |
| B | 0 | 3 | 0 |
| C | 0 | 3 | 0 |
| D | 0 | 3 | 0 |
| Mode M0 | |||
|---|---|---|---|
| Quadrant | BADHDUFLAG | Total packets | Discarded packets |
| A | 0 | 14025 | 0 |
| B | 0 | 14227 | 0 |
| C | 0 | 14199 | 0 |
| D | 0 | 30647 | 0 |
| Quadrant | Total seconds | Saturated seconds | Saturation percentage |
|---|---|---|---|
| A | 6930 | 83 | 1.197691% |
| B | 6931 | 107 | 1.543789% |
| C | 6931 | 109 | 1.572645% |
| D | 6931 | 1252 | 18.063771% |
Noise dominated data is calculated using 1-second bins in cleaned event files. If a bin has >2000 counts, and if more than 50% of those come from <1% of pixels, then it is considered to be noise-dominated and hence unusable.
| Quadrant | # 1 sec bins | Bins with >0 counts | Bins with >2000 counts | High rate bins dominated by noise | Noise dominated (total time) | Noise dominated (detector-on time) | Marked lightcurve |
|---|---|---|---|---|---|---|---|
| A | 7290 | 6930 | 0 | 0 | 0.00% | 0.00% | 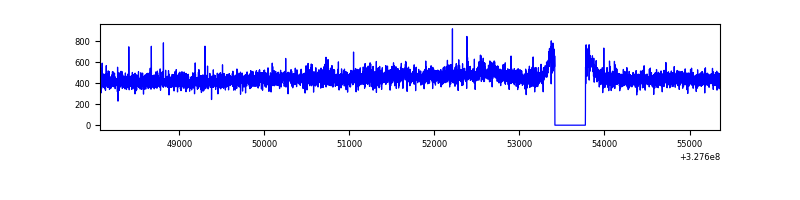 |
| B | 7291 | 6931 | 6 | 6 | 0.08% | 0.09% | 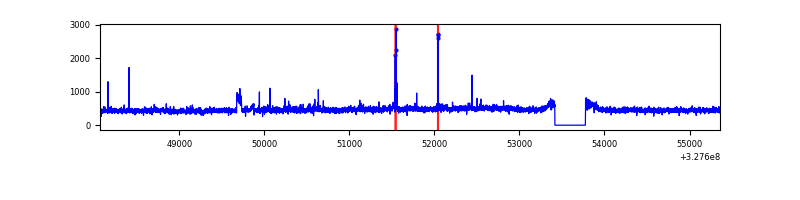 |
| C | 7291 | 6932 | 1 | 1 | 0.01% | 0.01% | 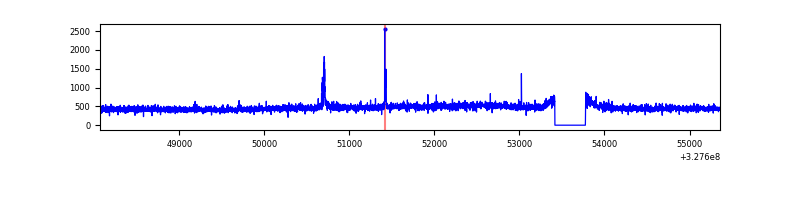 |
| D | 7291 | 6932 | 1052 | 1052 | 14.43% | 15.18% | 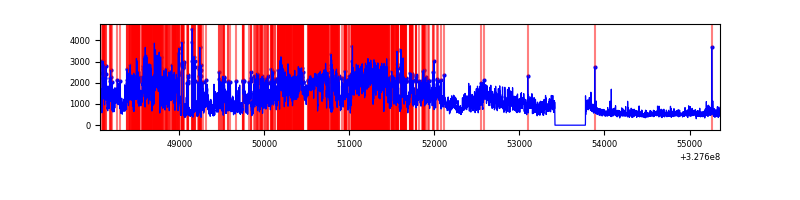 |
Top three noisy pixels from each quadrant. If the there are fewer than three noisy pixels in the level2.evt file, extra rows are filled as -1
| Pixel properties | Quadrant properties | ||||||
|---|---|---|---|---|---|---|---|
| Quadrant | DetID | PixID | Counts | Sigma | Mean | Median | Sigma |
| A | 13 | 254 | 11115 | 63.56 | 807 | 789 | 162.4 |
| A | 3 | 1 | 9387 | 52.93 | 807 | 789 | 162.4 |
| A | 3 | 137 | 7545 | 41.59 | 807 | 789 | 162.4 |
| B | 0 | 189 | 40765 | 258.34 | 807 | 784 | 154.8 |
| B | 5 | 172 | 35991 | 227.49 | 807 | 784 | 154.8 |
| B | 12 | 111 | 18947 | 117.36 | 807 | 784 | 154.8 |
| C | 14 | 238 | 123369 | 676.35 | 771 | 775 | 181.3 |
| C | 0 | 207 | 39532 | 213.82 | 771 | 775 | 181.3 |
| C | 7 | 247 | 34304 | 184.98 | 771 | 775 | 181.3 |
| D | 7 | 223 | 3053516 | 15586.43 | 734 | 717 | 195.9 |
| D | 8 | 195 | 1251725 | 6387.17 | 734 | 717 | 195.9 |
| D | 12 | 33 | 870199 | 4439.24 | 734 | 717 | 195.9 |
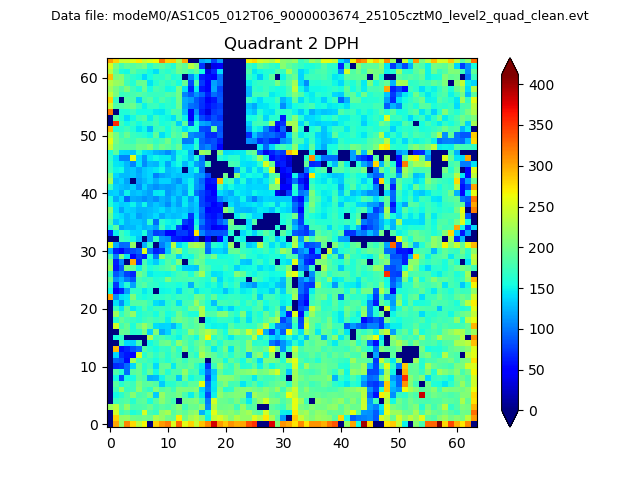
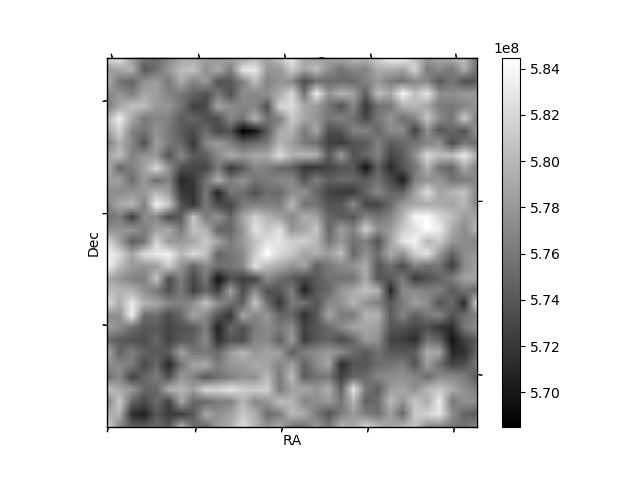
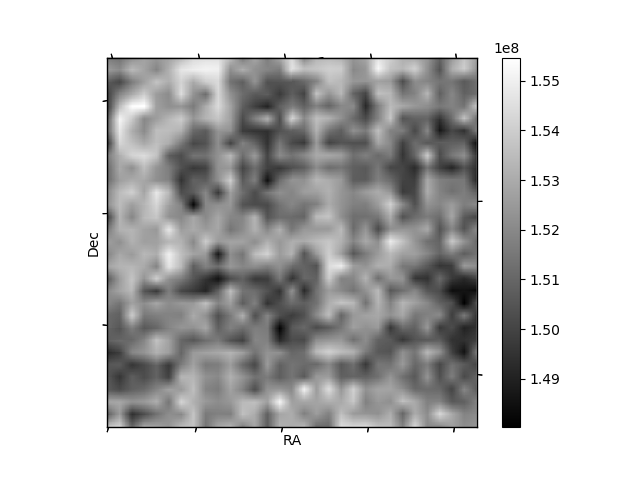
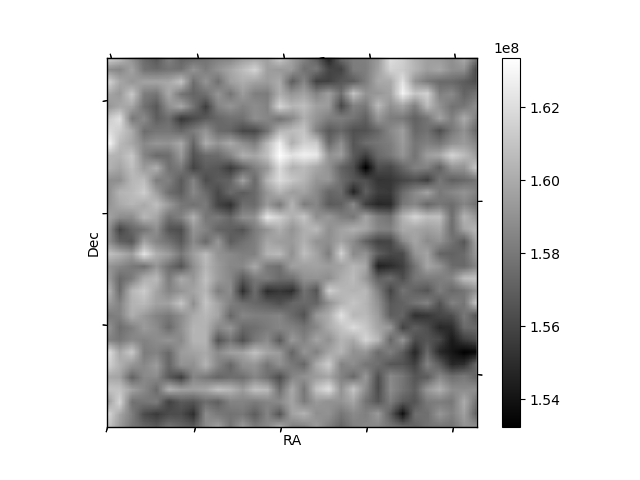
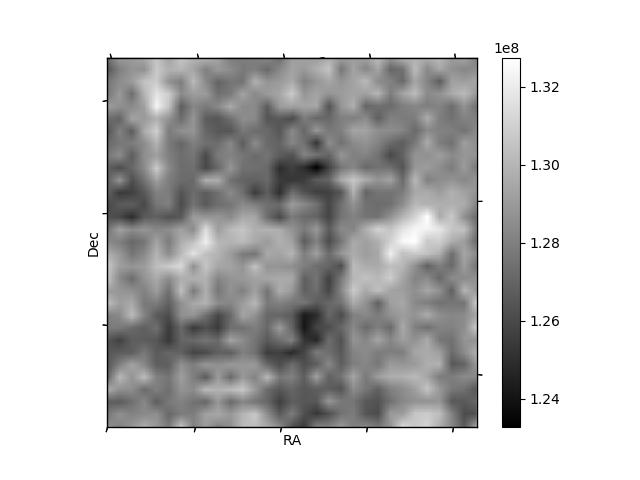
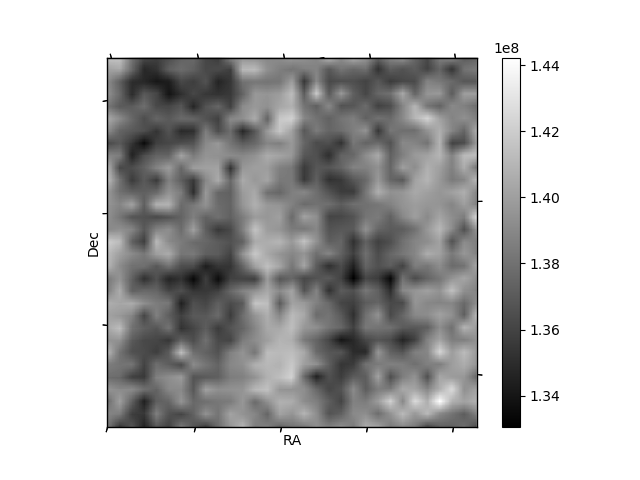
Histogram calculated using DETX and DETY for each event in the final _common_clean file
| Quadrant A | 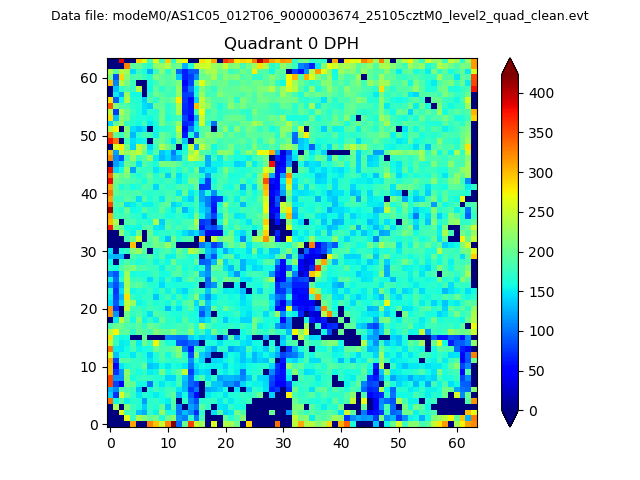 |
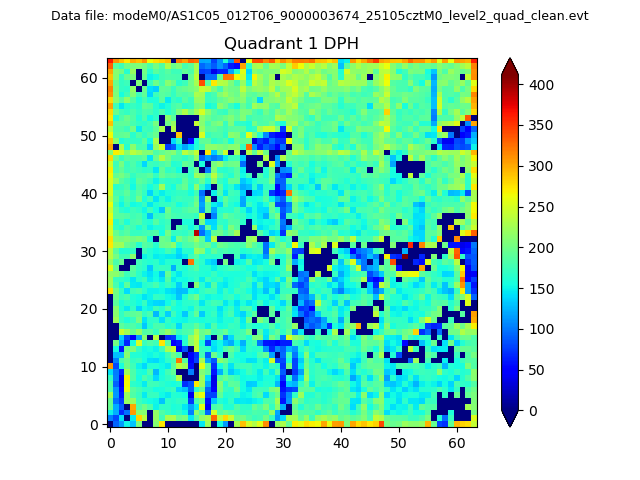 |
Quadrant B |
|---|---|---|---|
| Quadrant D | 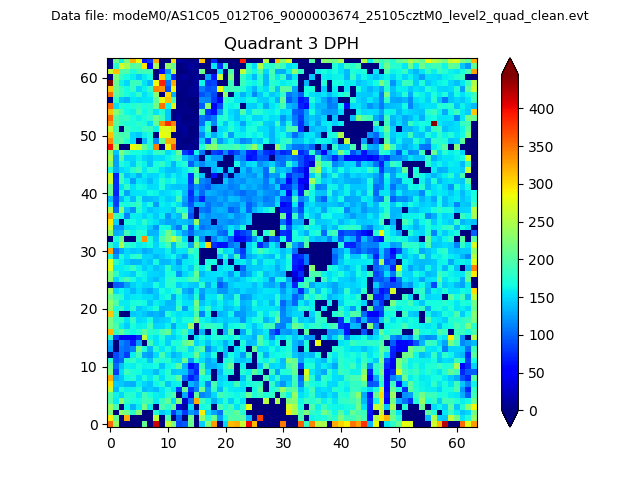 |
 |
Quadrant C |
| Plot type | Count rate plots | Images |
|---|---|---|
| Comparison with Poisson distribution Blue bars denote a histogram of data divided into 1 sec bins. Red curve is a Poisson curve with rate = median count rate of data. |
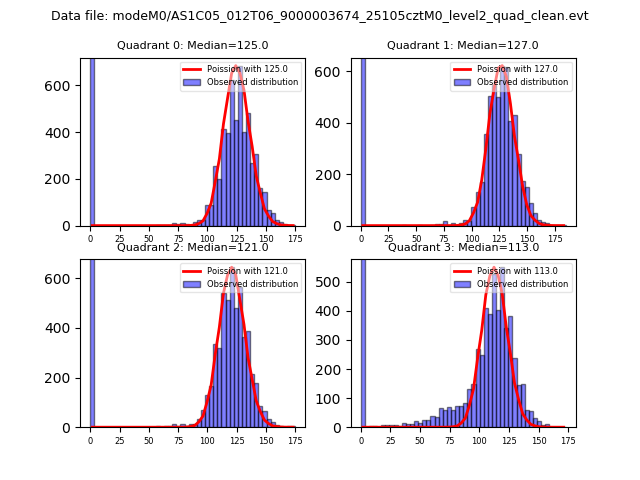 |
 |
| Quadrant-wise count rates Data is divided into 100 sec bins |
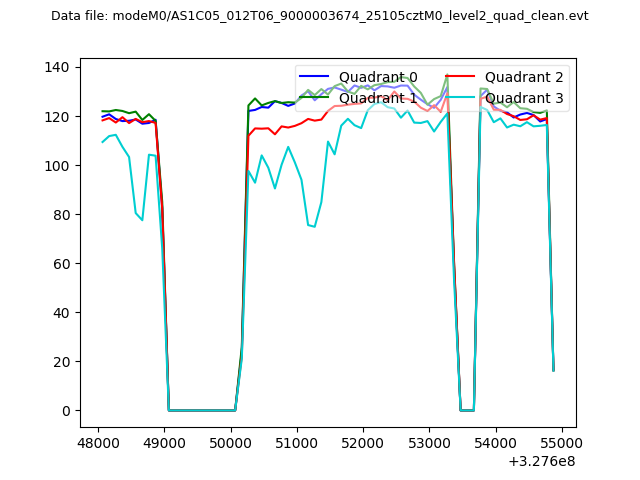 |
|
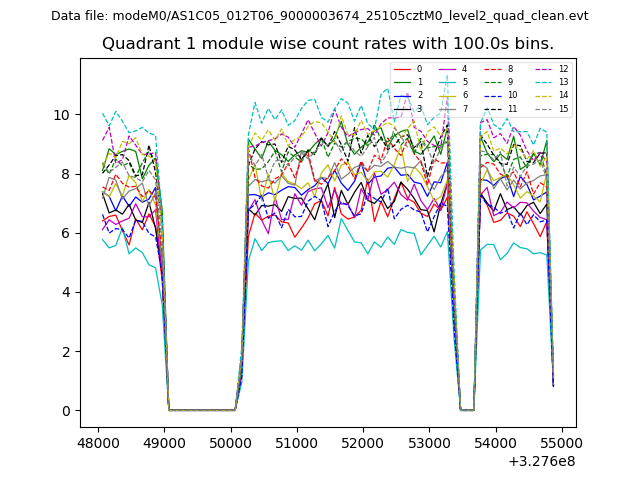
| Module-wise count rates for Quadrant A Data is divided into 100 sec bins |
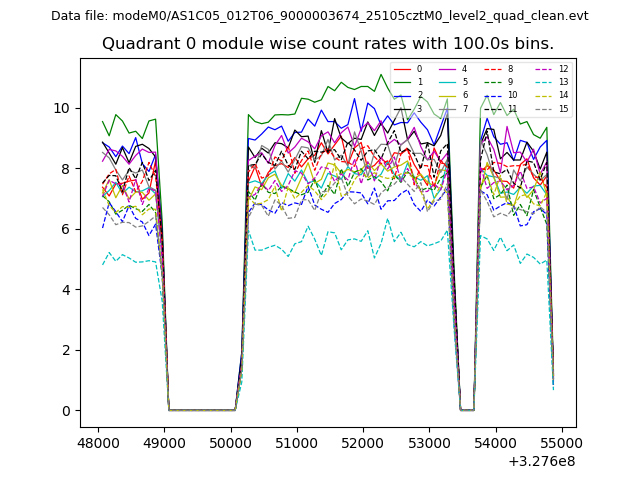 |
 |
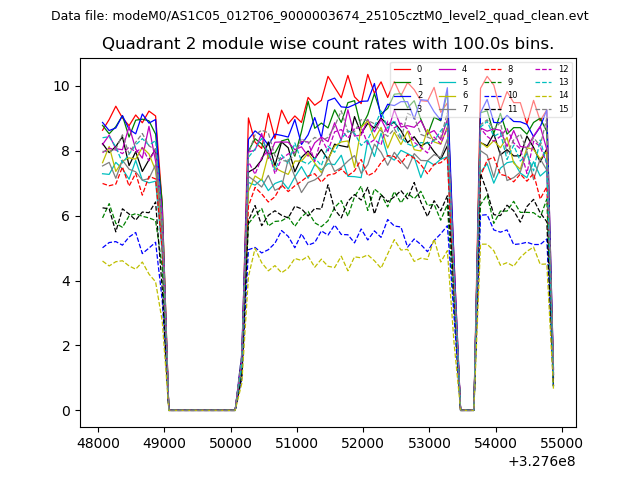
| Module-wise count rates for Quadrant B Data is divided into 100 sec bins |
 |
 |
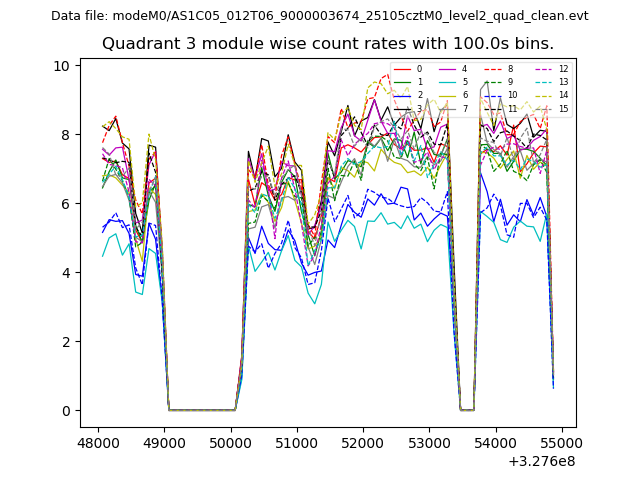
| Module-wise count rates for Quadrant C Data is divided into 100 sec bins |
 |
 |
| Module-wise count rates for Quadrant D Data is divided into 100 sec bins |
 |
 |
| Parameter | Plot |
|---|---|
| CZT HV Monitor | 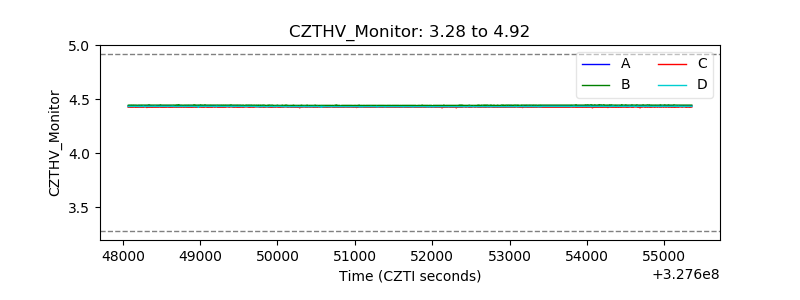 |
| D_VDD | 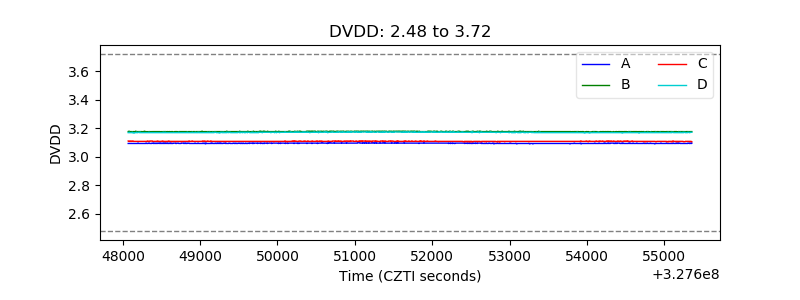 |
| Temperature 1 | 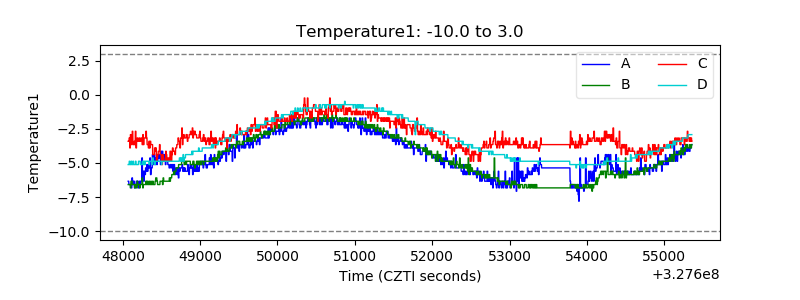 |
| Veto HV Monitor | 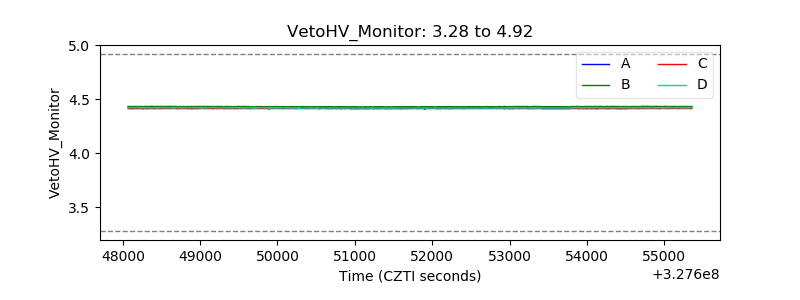 |
| Veto LLD | 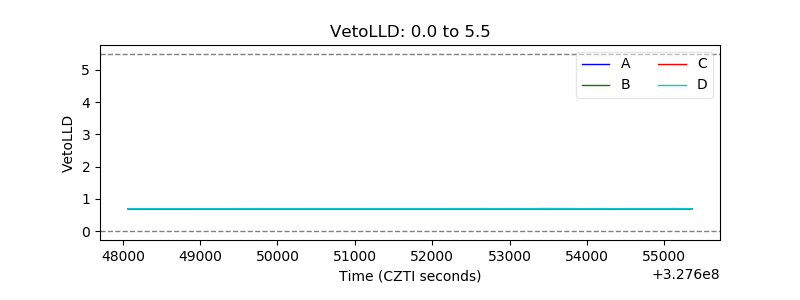 |
| Alpha Counter | 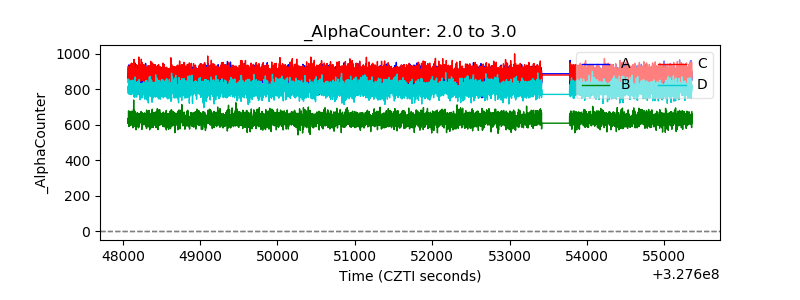 |
| _CPM_Rate | 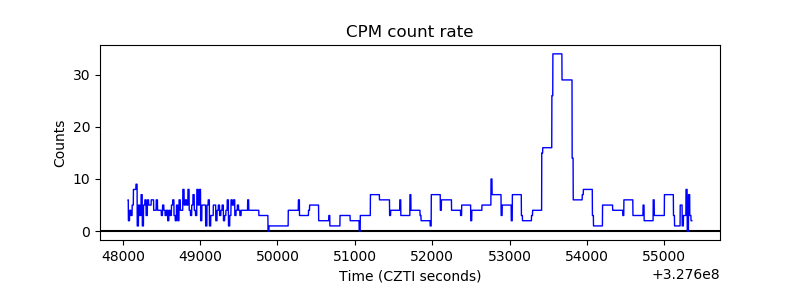 |
| CZT Counter | 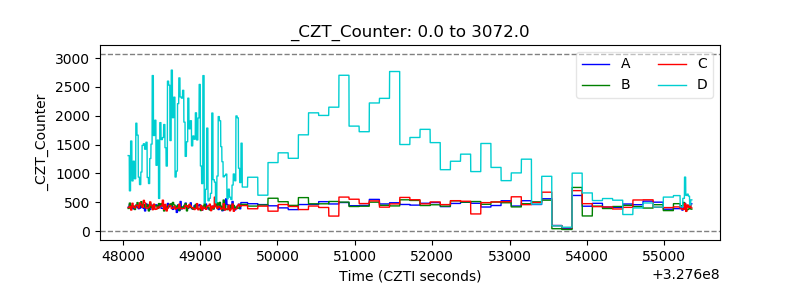 |
| +2.5 Volts monitor | 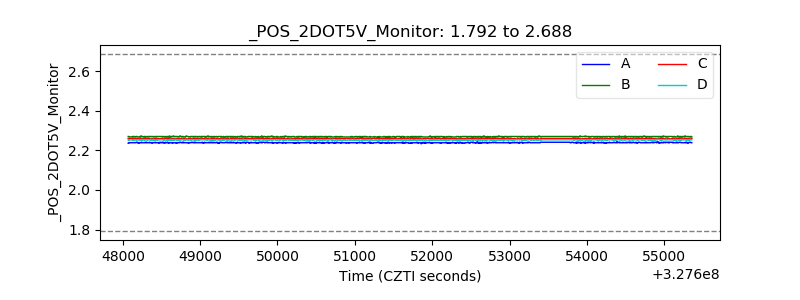 |
| +5 Volts monitor | 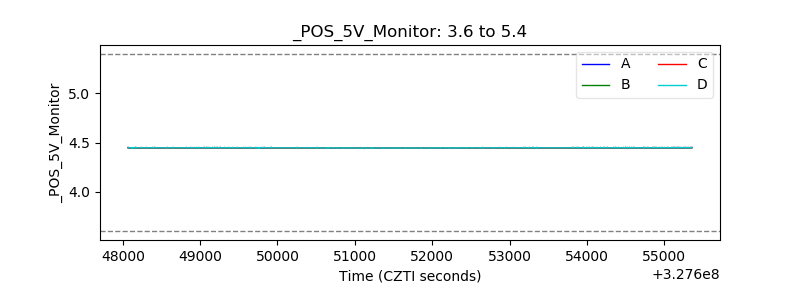 |
| _ROLL_ROT | 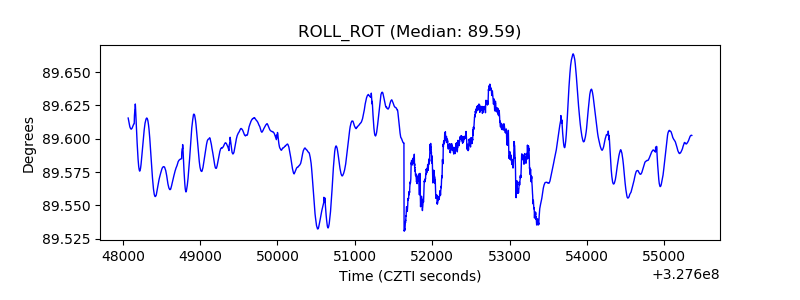 |
| _Roll_DEC | 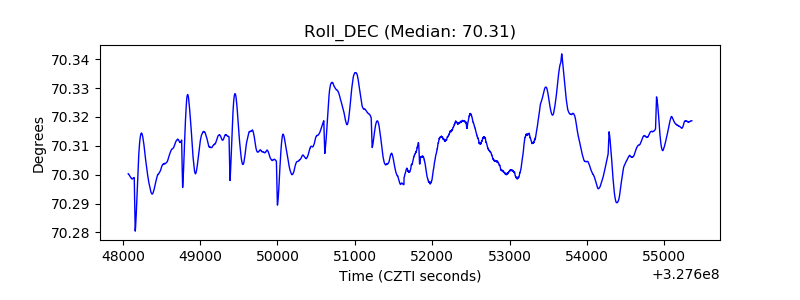 |
| _Roll_RA | 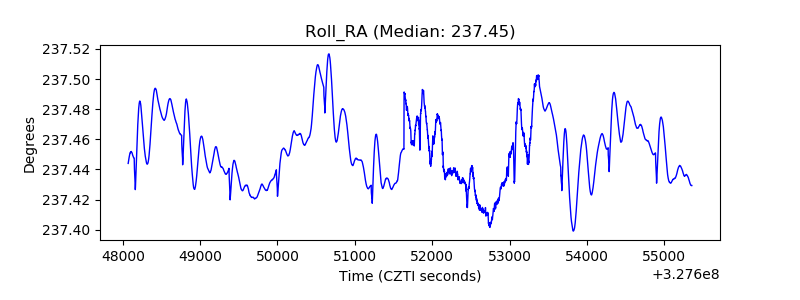 |
| Veto Counter | 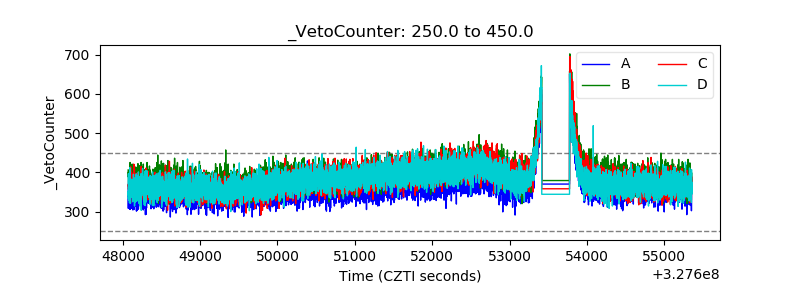 |