| Param | Original file | Final file |
|---|---|---|
| Filename | modeM0/AS1C05_012T06_9000003674_25107cztM0_level2.evt | modeM0/AS1C05_012T06_9000003674_25107cztM0_level2_quad_clean.evt |
| Size (bytes) | 1,002,156,480 | 179,291,520 |
| Size | 955.7 MB | 171.0 MB |
| Events in quadrant A | 5,891,996 | 1,164,640 |
| Events in quadrant B | 6,254,298 | 1,177,935 |
| Events in quadrant C | 6,509,139 | 1,118,062 |
| Events in quadrant D | 10,820,724 | 1,075,152 |
| Mode M9 | |||
|---|---|---|---|
| Quadrant | BADHDUFLAG | Total packets | Discarded packets |
| A | 0 | 13 | 0 |
| B | 0 | 13 | 0 |
| C | 0 | 13 | 0 |
| D | 0 | 13 | 0 |
| Mode M0 | |||
|---|---|---|---|
| Quadrant | BADHDUFLAG | Total packets | Discarded packets |
| A | 0 | 26130 | 0 |
| B | 0 | 26780 | 0 |
| C | 0 | 26959 | 0 |
| D | 0 | 41298 | 0 |
| Quadrant | Total seconds | Saturated seconds | Saturation percentage |
|---|---|---|---|
| A | 12942 | 115 | 0.888580% |
| B | 12943 | 164 | 1.267094% |
| C | 12943 | 194 | 1.498880% |
| D | 12943 | 520 | 4.017616% |
Noise dominated data is calculated using 1-second bins in cleaned event files. If a bin has >2000 counts, and if more than 50% of those come from <1% of pixels, then it is considered to be noise-dominated and hence unusable.
| Quadrant | # 1 sec bins | Bins with >0 counts | Bins with >2000 counts | High rate bins dominated by noise | Noise dominated (total time) | Noise dominated (detector-on time) | Marked lightcurve |
|---|---|---|---|---|---|---|---|
| A | 14152 | 12943 | 1 | 1 | 0.01% | 0.01% | 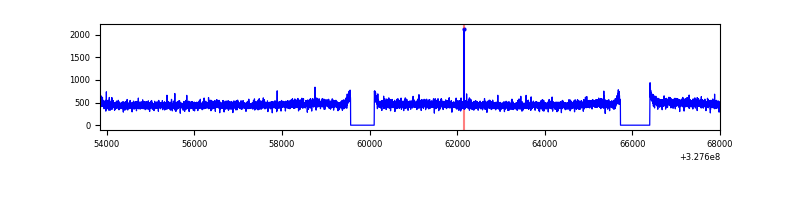 |
| B | 14153 | 12943 | 19 | 19 | 0.13% | 0.15% | 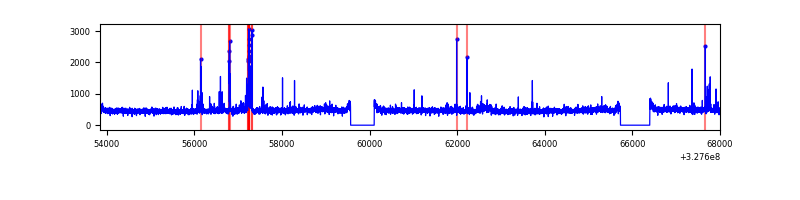 |
| C | 14153 | 12944 | 7 | 7 | 0.05% | 0.05% | 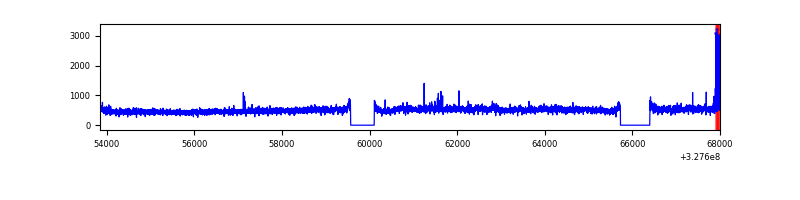 |
| D | 14153 | 12944 | 363 | 363 | 2.56% | 2.80% | 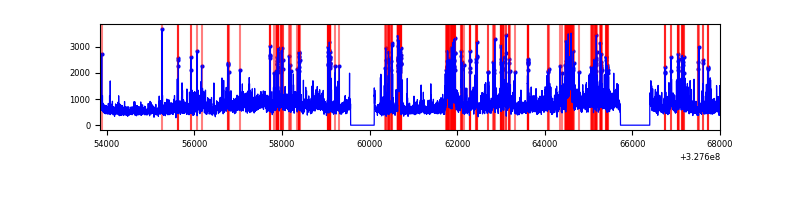 |
Top three noisy pixels from each quadrant. If the there are fewer than three noisy pixels in the level2.evt file, extra rows are filled as -1
| Pixel properties | Quadrant properties | ||||||
|---|---|---|---|---|---|---|---|
| Quadrant | DetID | PixID | Counts | Sigma | Mean | Median | Sigma |
| A | 13 | 254 | 21930 | 67.26 | 1525 | 1493 | 303.9 |
| A | 3 | 137 | 14314 | 42.19 | 1525 | 1493 | 303.9 |
| A | 0 | 226 | 12932 | 37.64 | 1525 | 1493 | 303.9 |
| B | 3 | 209 | 90763 | 309.18 | 1523 | 1482 | 288.8 |
| B | 0 | 189 | 86723 | 295.19 | 1523 | 1482 | 288.8 |
| B | 5 | 172 | 64617 | 218.64 | 1523 | 1482 | 288.8 |
| C | 7 | 247 | 508241 | 1489.33 | 1455 | 1459 | 340.3 |
| C | 14 | 238 | 232874 | 680.08 | 1455 | 1459 | 340.3 |
| C | 0 | 207 | 62698 | 179.97 | 1455 | 1459 | 340.3 |
| D | 8 | 195 | 3144107 | 8292.33 | 1443 | 1410 | 379.0 |
| D | 1 | 52 | 1168007 | 3078.19 | 1443 | 1410 | 379.0 |
| D | 12 | 33 | 533254 | 1403.33 | 1443 | 1410 | 379.0 |
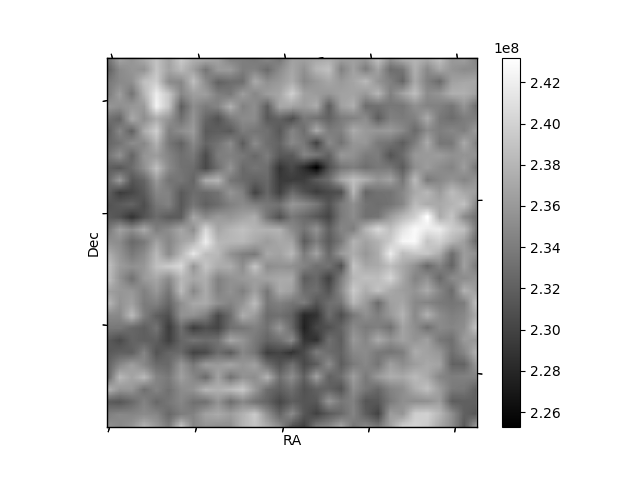
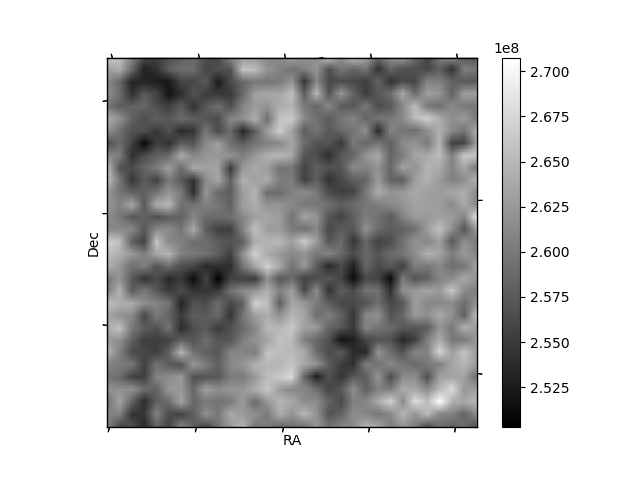
Histogram calculated using DETX and DETY for each event in the final _common_clean file
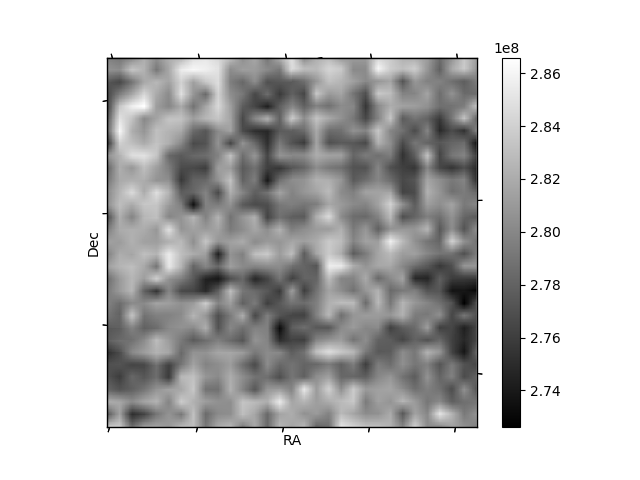
| Quadrant A |  |
 |
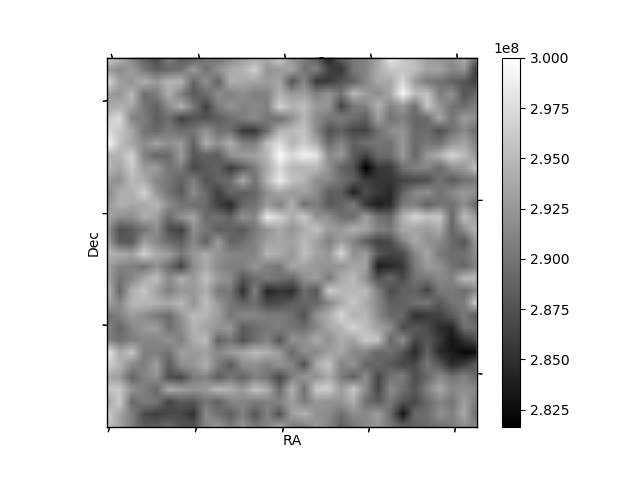
Quadrant B |
|---|---|---|---|
| Quadrant D |  |
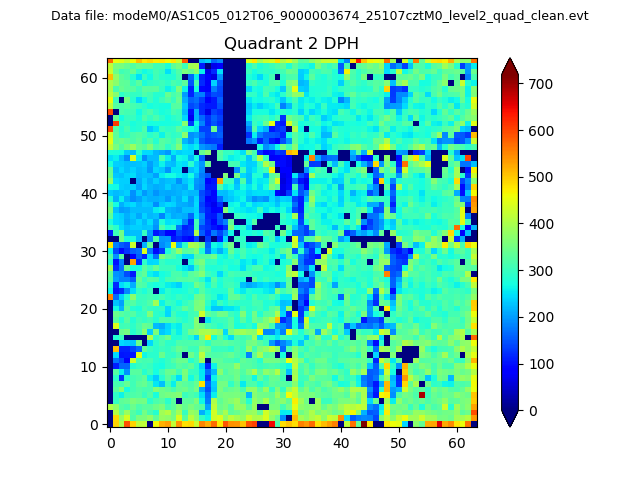 |
Quadrant C |
| Plot type | Count rate plots | Images |
|---|---|---|
| Comparison with Poisson distribution Blue bars denote a histogram of data divided into 1 sec bins. Red curve is a Poisson curve with rate = median count rate of data. |
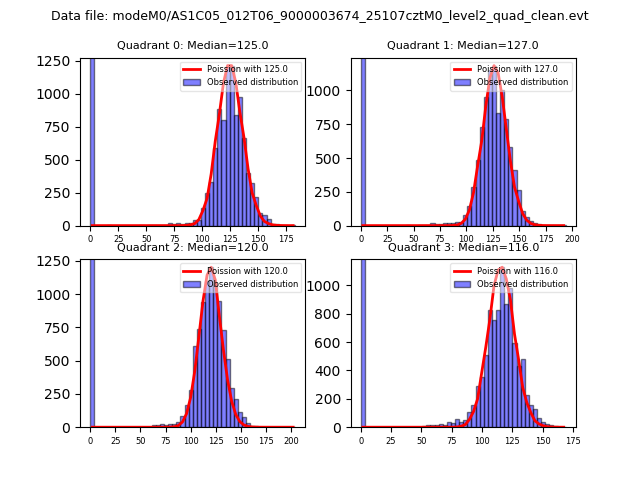 |
 |
| Quadrant-wise count rates Data is divided into 100 sec bins |
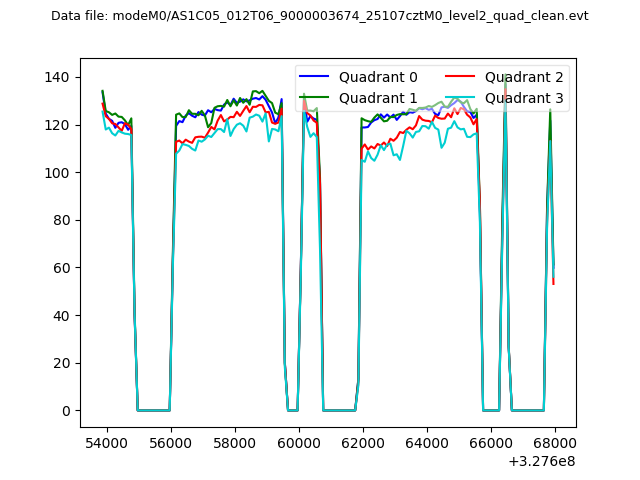 |
|
| Module-wise count rates for Quadrant A Data is divided into 100 sec bins |
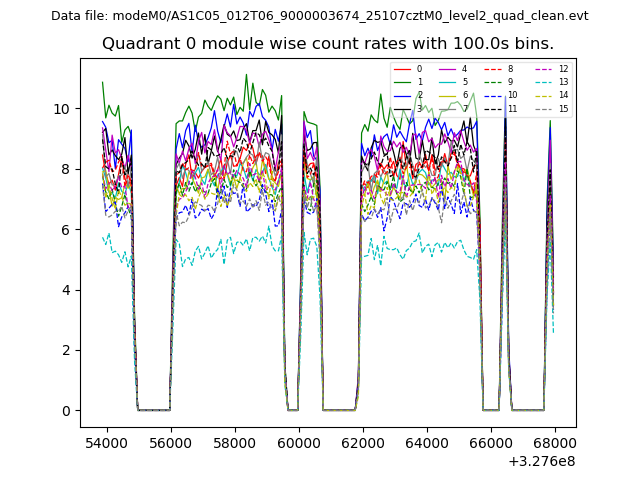 |
 |
| Module-wise count rates for Quadrant B Data is divided into 100 sec bins |
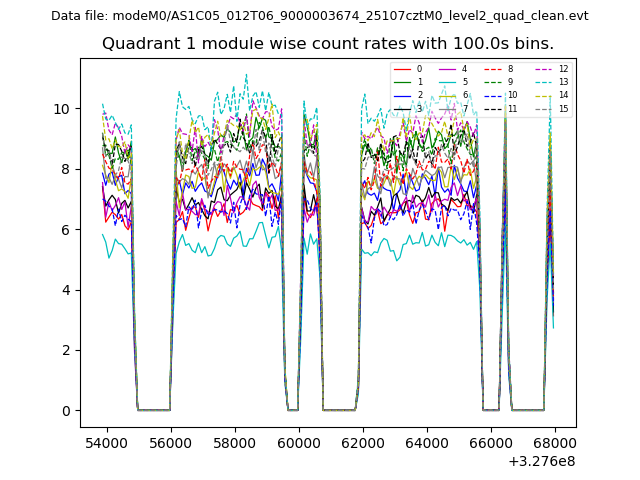 |
 |
| Module-wise count rates for Quadrant C Data is divided into 100 sec bins |
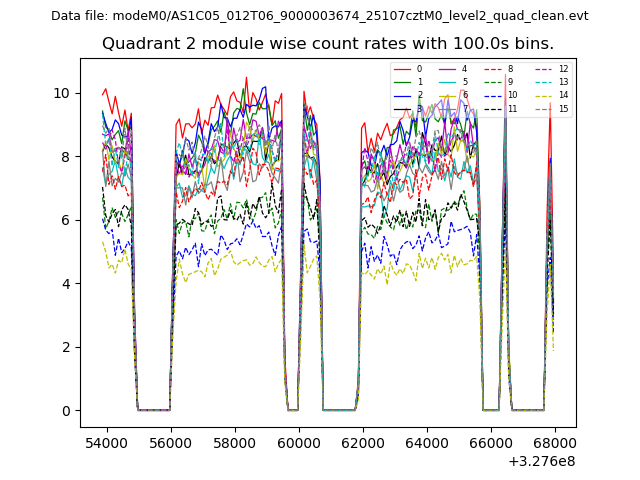 |
 |
| Module-wise count rates for Quadrant D Data is divided into 100 sec bins |
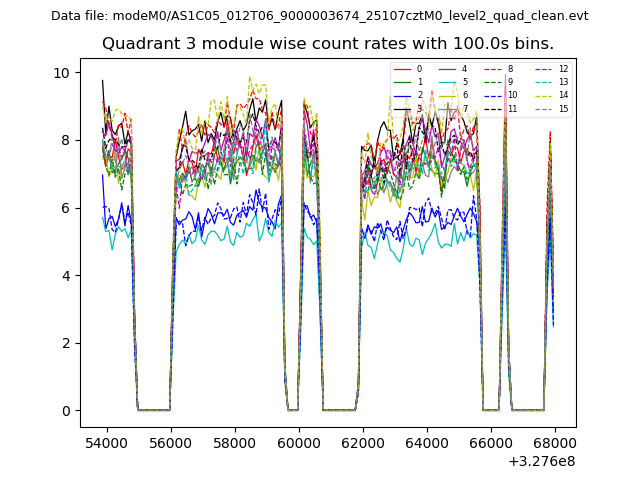 |
 |
| Parameter | Plot |
|---|---|
| CZT HV Monitor | 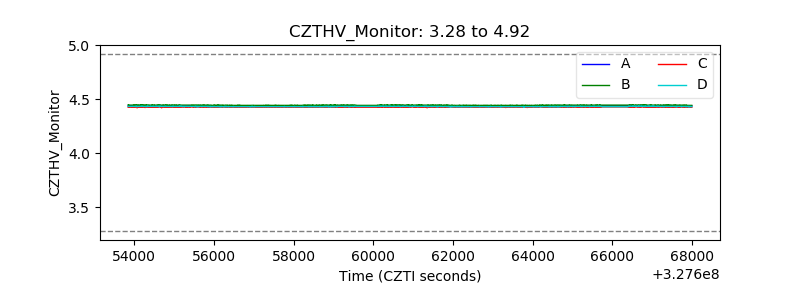 |
| D_VDD | 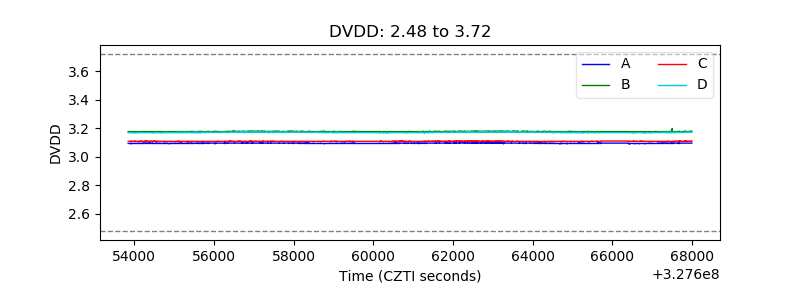 |
| Temperature 1 | 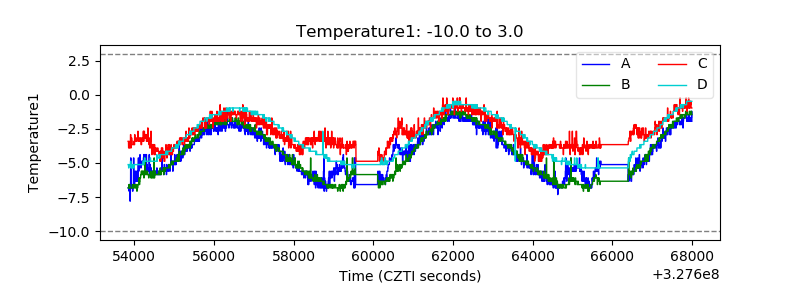 |
| Veto HV Monitor | 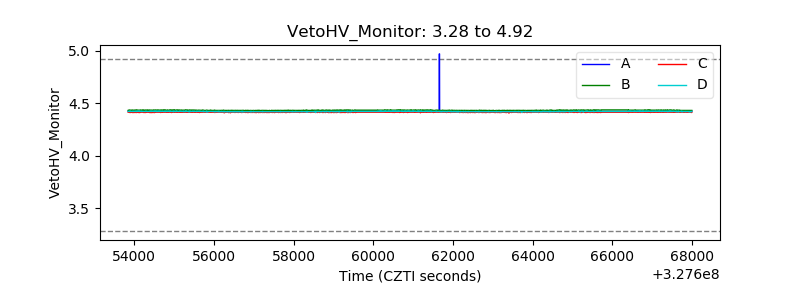 |
| Veto LLD | 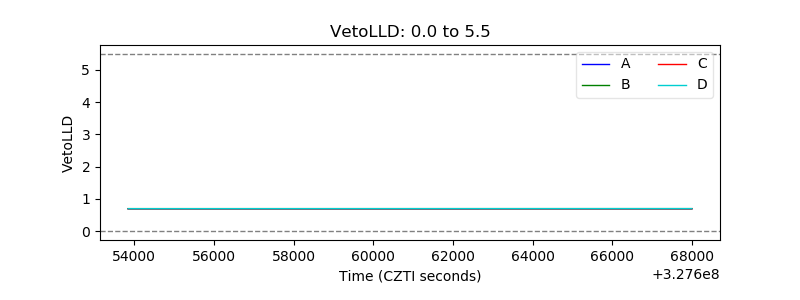 |
| Alpha Counter | 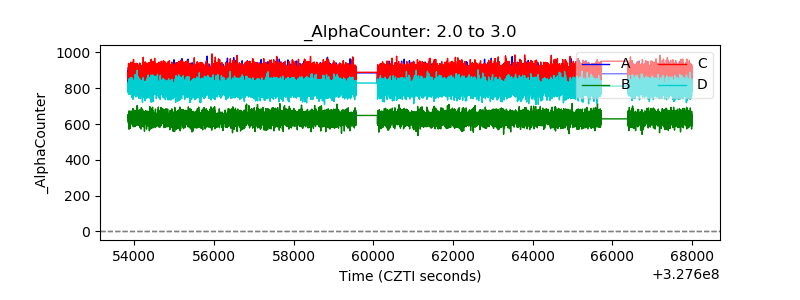 |
| _CPM_Rate | 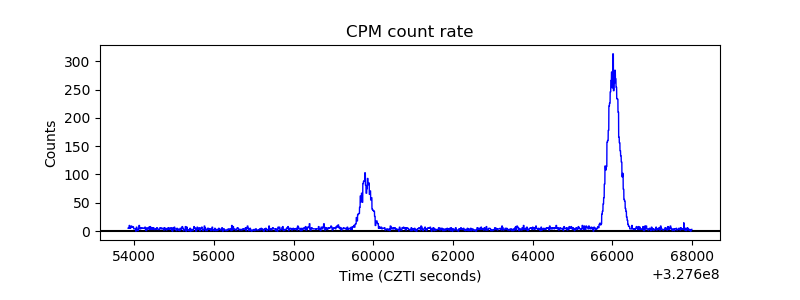 |
| CZT Counter | 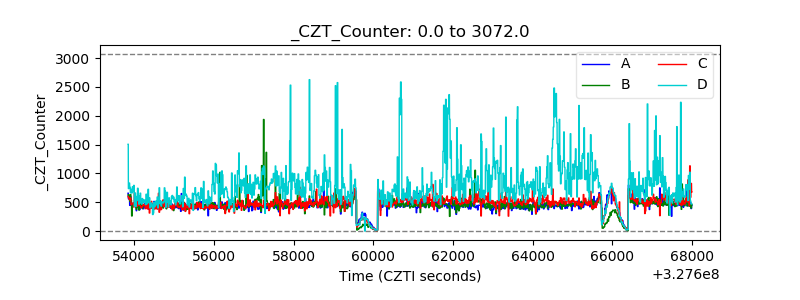 |
| +2.5 Volts monitor |  |
| +5 Volts monitor |  |
| _ROLL_ROT | 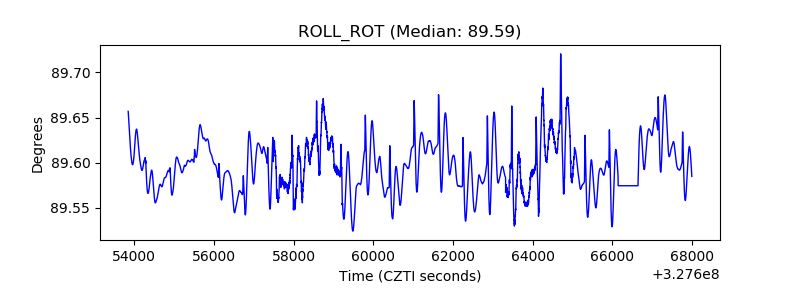 |
| _Roll_DEC | 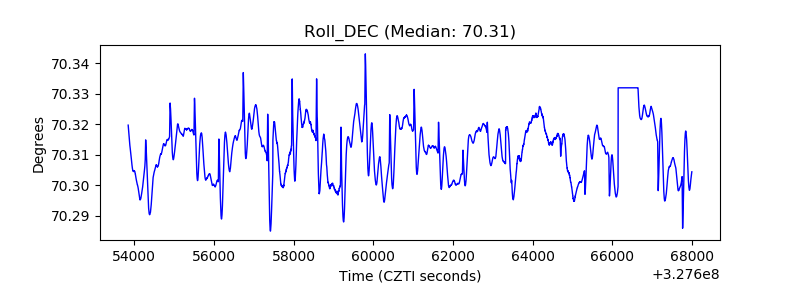 |
| _Roll_RA | 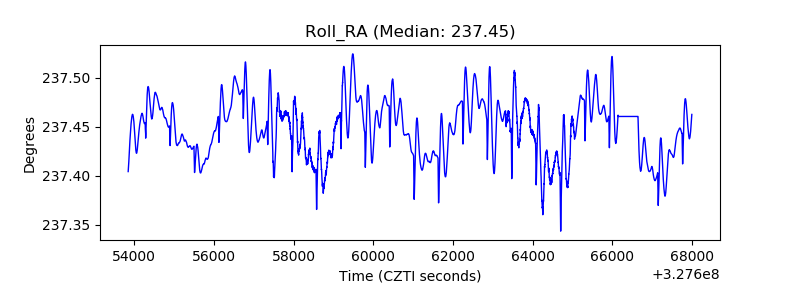 |
| Veto Counter | 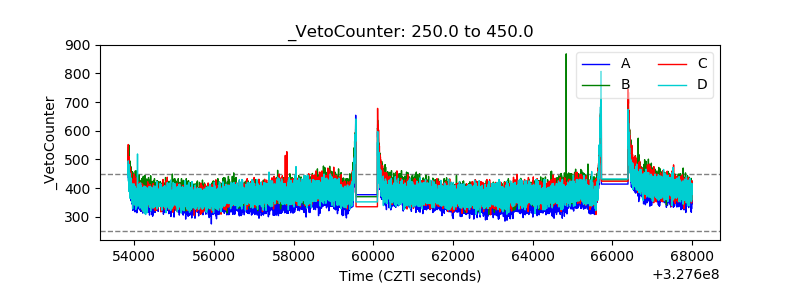 |