| Param | Original file | Final file |
|---|---|---|
| Filename | modeM0/AS1C05_012T06_9000003674_25108cztM0_level2.evt | modeM0/AS1C05_012T06_9000003674_25108cztM0_level2_quad_clean.evt |
| Size (bytes) | 475,056,000 | 88,424,640 |
| Size | 453.0 MB | 84.3 MB |
| Events in quadrant A | 2,894,482 | 581,136 |
| Events in quadrant B | 2,994,299 | 587,679 |
| Events in quadrant C | 3,345,547 | 549,935 |
| Events in quadrant D | 4,728,611 | 522,976 |
| Mode M9 | |||
|---|---|---|---|
| Quadrant | BADHDUFLAG | Total packets | Discarded packets |
| A | 0 | 9 | 0 |
| B | 0 | 9 | 0 |
| C | 0 | 9 | 0 |
| D | 0 | 9 | 0 |
| Mode M0 | |||
|---|---|---|---|
| Quadrant | BADHDUFLAG | Total packets | Discarded packets |
| A | 0 | 12687 | 0 |
| B | 0 | 12922 | 0 |
| C | 0 | 13593 | 0 |
| D | 0 | 18265 | 0 |
| Quadrant | Total seconds | Saturated seconds | Saturation percentage |
|---|---|---|---|
| A | 6248 | 57 | 0.912292% |
| B | 6249 | 57 | 0.912146% |
| C | 6249 | 111 | 1.776284% |
| D | 6249 | 402 | 6.433029% |
Noise dominated data is calculated using 1-second bins in cleaned event files. If a bin has >2000 counts, and if more than 50% of those come from <1% of pixels, then it is considered to be noise-dominated and hence unusable.
| Quadrant | # 1 sec bins | Bins with >0 counts | Bins with >2000 counts | High rate bins dominated by noise | Noise dominated (total time) | Noise dominated (detector-on time) | Marked lightcurve |
|---|---|---|---|---|---|---|---|
| A | 7108 | 6248 | 0 | 0 | 0.00% | 0.00% | 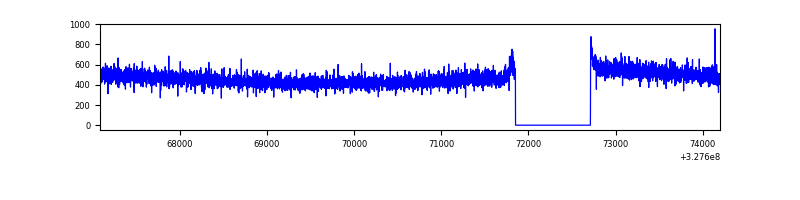 |
| B | 7109 | 6249 | 1 | 1 | 0.01% | 0.02% | 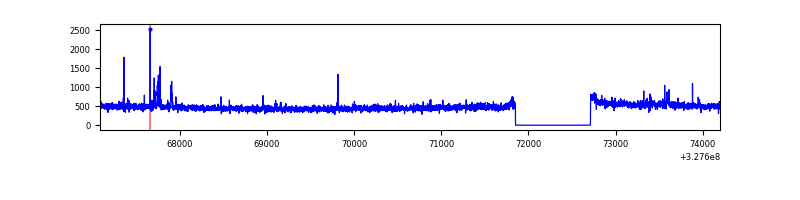 |
| C | 7109 | 6249 | 19 | 19 | 0.27% | 0.30% | 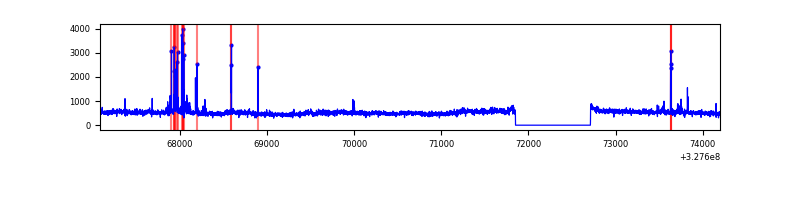 |
| D | 7109 | 6249 | 346 | 346 | 4.87% | 5.54% | 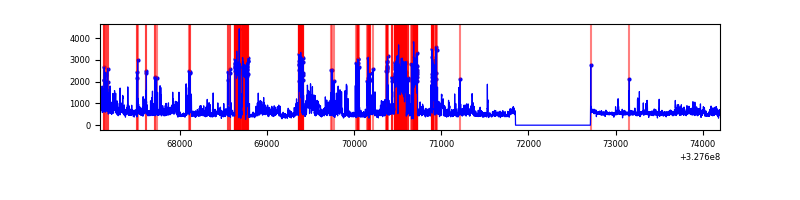 |
Top three noisy pixels from each quadrant. If the there are fewer than three noisy pixels in the level2.evt file, extra rows are filled as -1
| Pixel properties | Quadrant properties | ||||||
|---|---|---|---|---|---|---|---|
| Quadrant | DetID | PixID | Counts | Sigma | Mean | Median | Sigma |
| A | 13 | 254 | 10629 | 65.31 | 750 | 732 | 151.5 |
| A | 3 | 137 | 6623 | 38.88 | 750 | 732 | 151.5 |
| A | 0 | 226 | 6354 | 37.1 | 750 | 732 | 151.5 |
| B | 0 | 190 | 37900 | 258.13 | 745 | 725 | 144.0 |
| B | 0 | 189 | 31946 | 216.78 | 745 | 725 | 144.0 |
| B | 12 | 111 | 17408 | 115.84 | 745 | 725 | 144.0 |
| C | 7 | 247 | 291919 | 1740.6 | 713 | 717 | 167.3 |
| C | 0 | 207 | 115613 | 686.77 | 713 | 717 | 167.3 |
| C | 14 | 238 | 113781 | 675.82 | 713 | 717 | 167.3 |
| D | 1 | 52 | 1140123 | 6599.08 | 708 | 686 | 172.7 |
| D | 8 | 195 | 743768 | 4303.58 | 708 | 686 | 172.7 |
| D | 12 | 233 | 100015 | 575.27 | 708 | 686 | 172.7 |
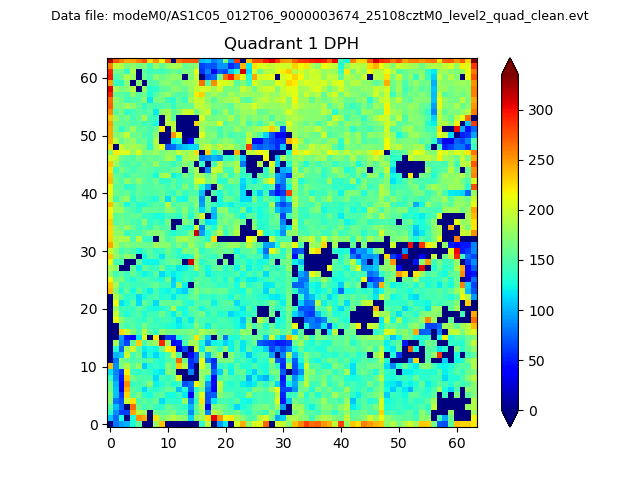
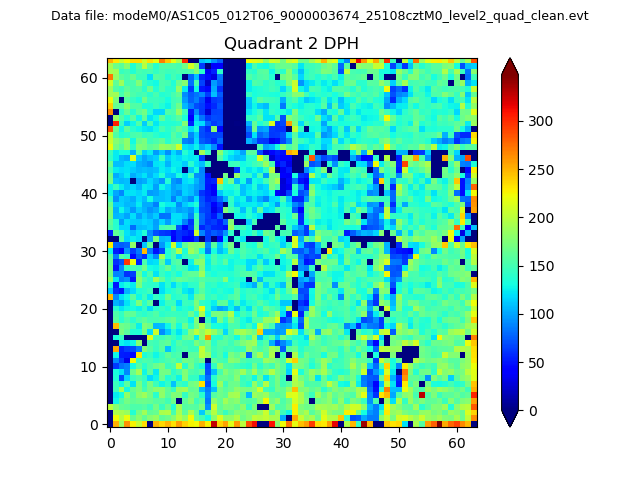
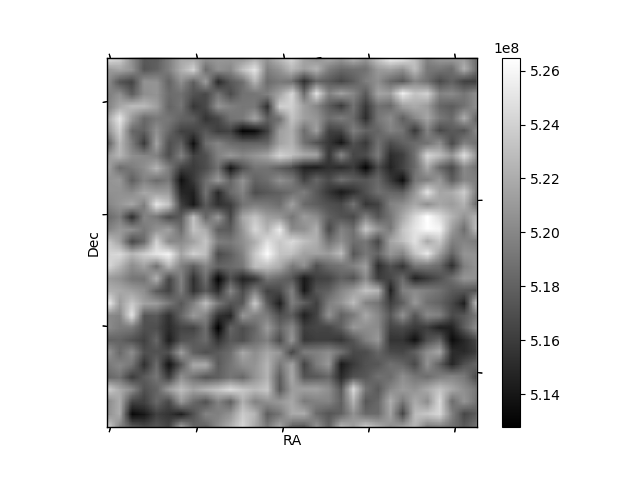
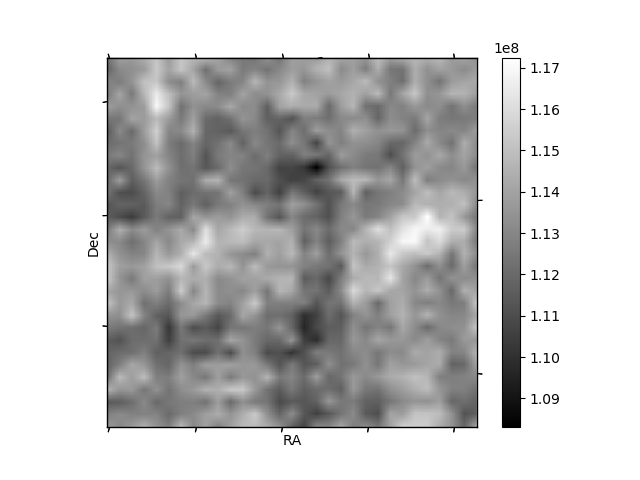
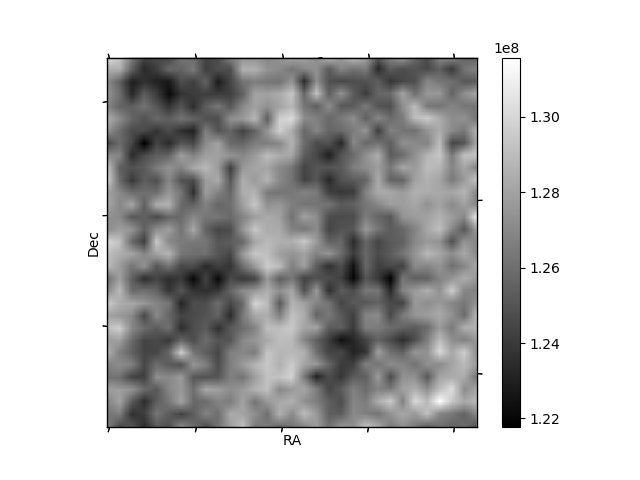
Histogram calculated using DETX and DETY for each event in the final _common_clean file
| Quadrant A |  |
 |
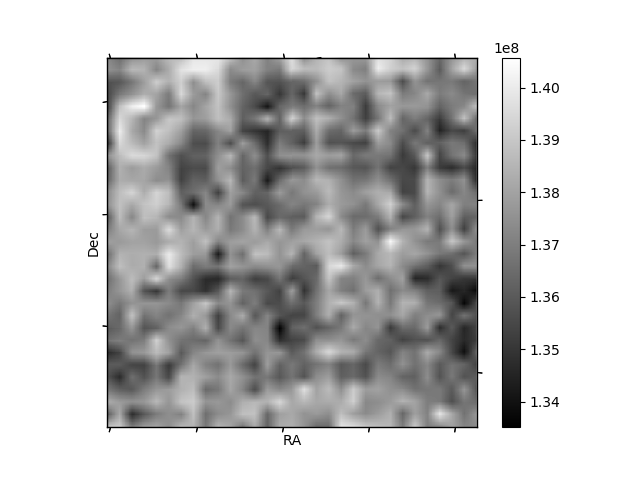
Quadrant B |
|---|---|---|---|
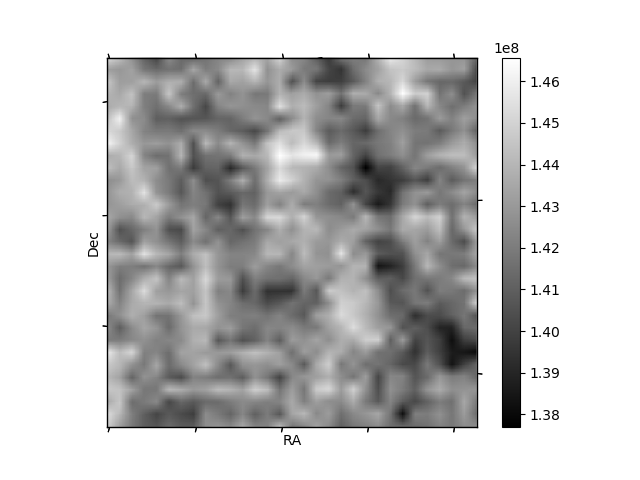
| Quadrant D | 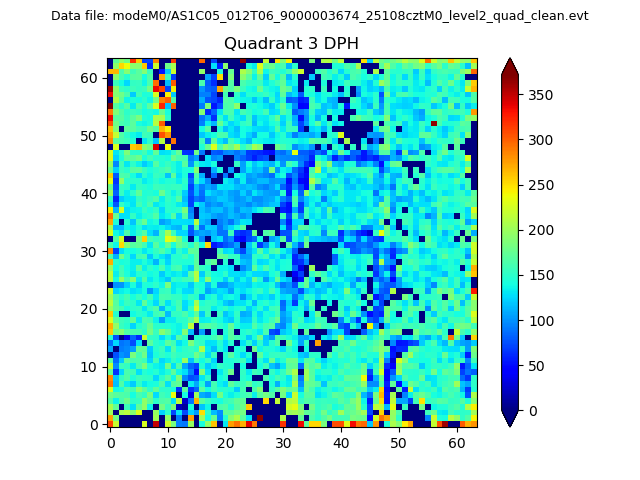 |
 |
Quadrant C |
| Plot type | Count rate plots | Images |
|---|---|---|
| Comparison with Poisson distribution Blue bars denote a histogram of data divided into 1 sec bins. Red curve is a Poisson curve with rate = median count rate of data. |
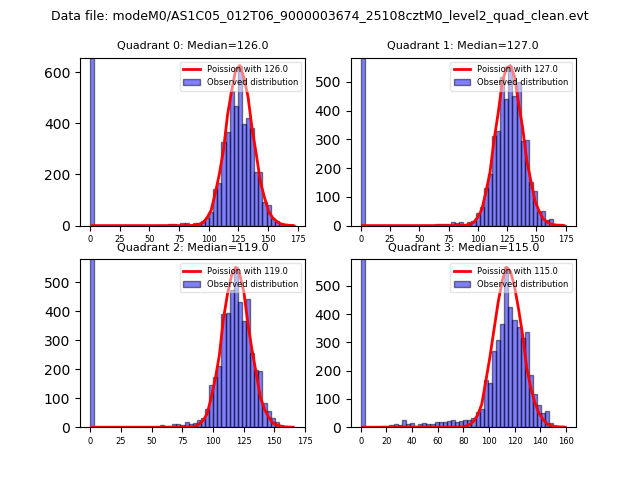 |
 |
| Quadrant-wise count rates Data is divided into 100 sec bins |
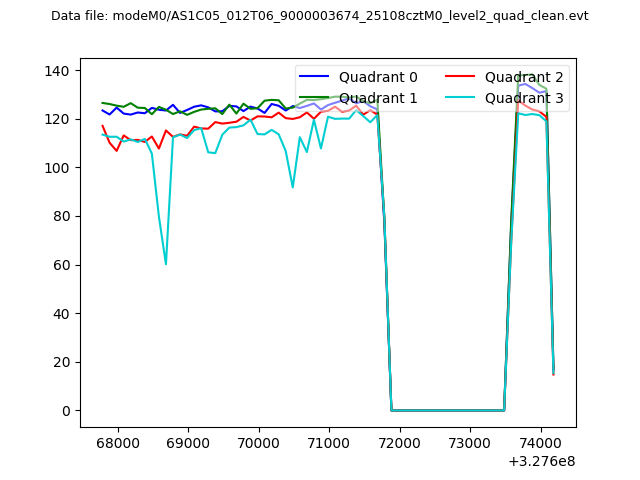 |
|
| Module-wise count rates for Quadrant A Data is divided into 100 sec bins |
 |
 |
| Module-wise count rates for Quadrant B Data is divided into 100 sec bins |
 |
 |
| Module-wise count rates for Quadrant C Data is divided into 100 sec bins |
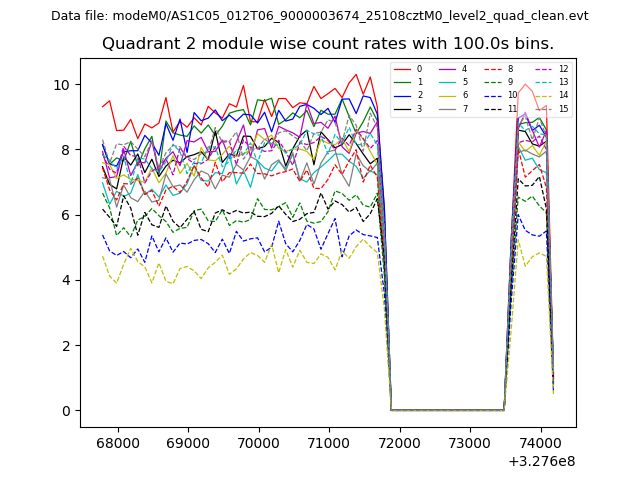 |
 |
| Module-wise count rates for Quadrant D Data is divided into 100 sec bins |
 |
 |
| Parameter | Plot |
|---|---|
| CZT HV Monitor | 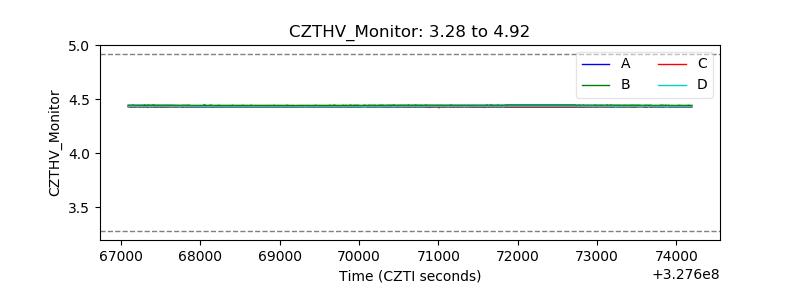 |
| D_VDD | 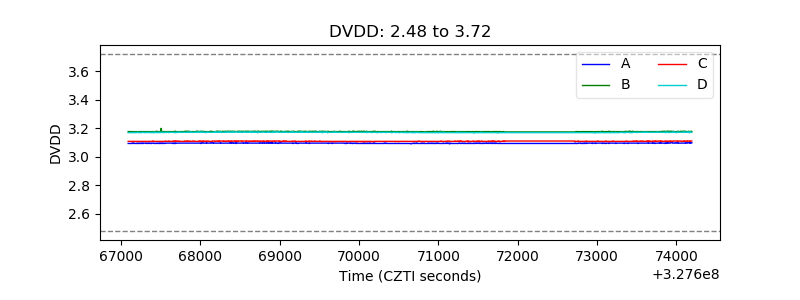 |
| Temperature 1 | 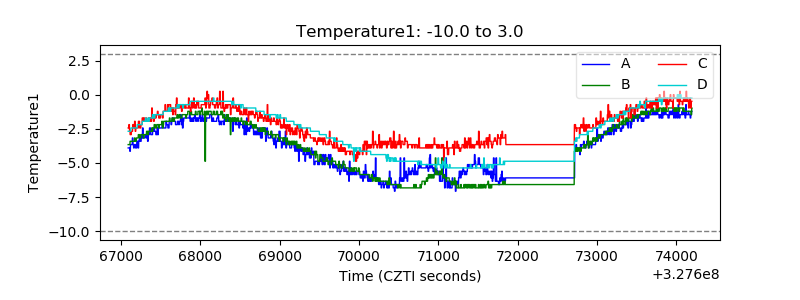 |
| Veto HV Monitor | 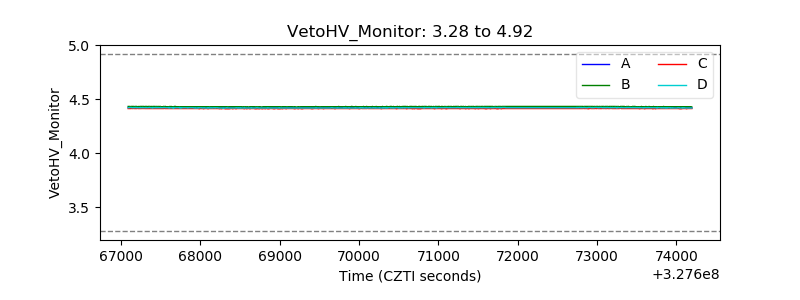 |
| Veto LLD | 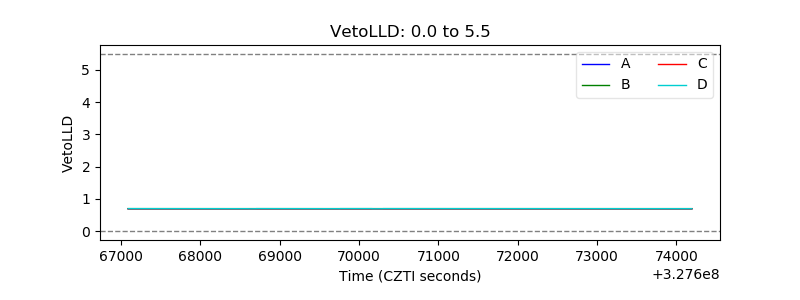 |
| Alpha Counter | 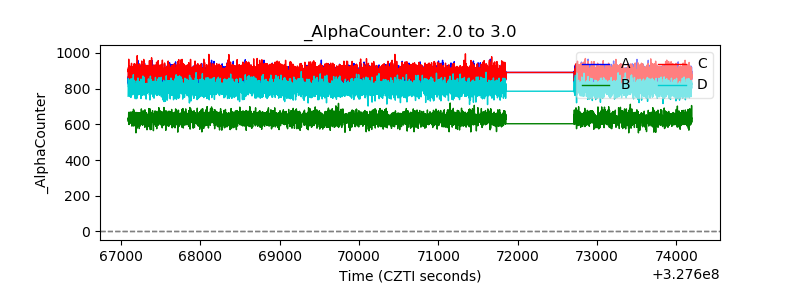 |
| _CPM_Rate | 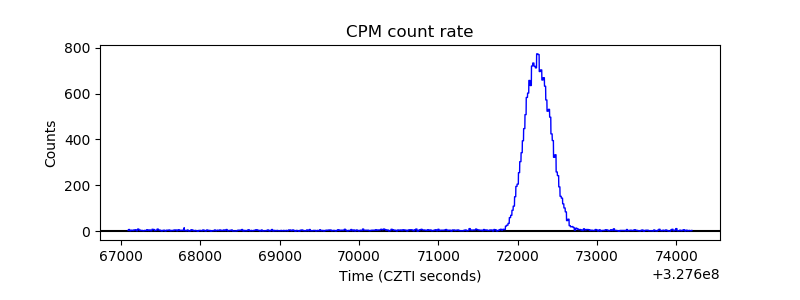 |
| CZT Counter | 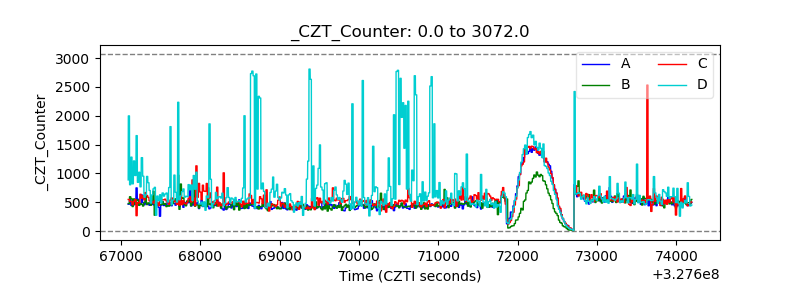 |
| +2.5 Volts monitor |  |
| +5 Volts monitor |  |
| _ROLL_ROT | 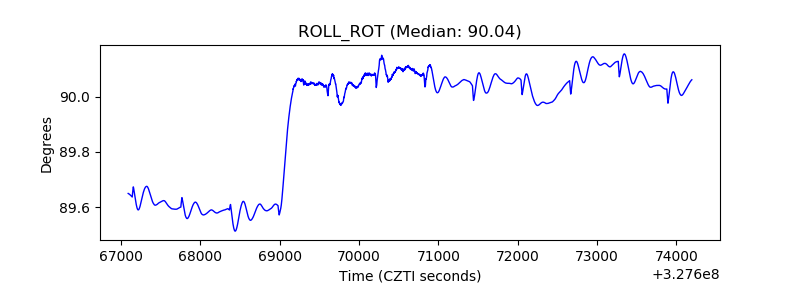 |
| _Roll_DEC | 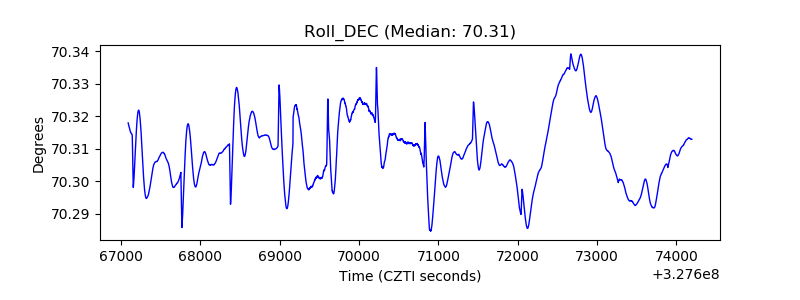 |
| _Roll_RA | 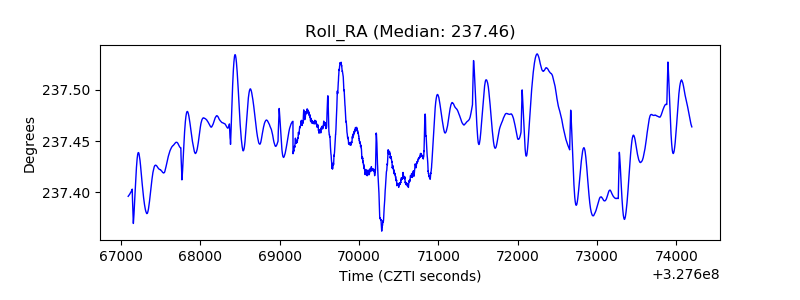 |
| Veto Counter | 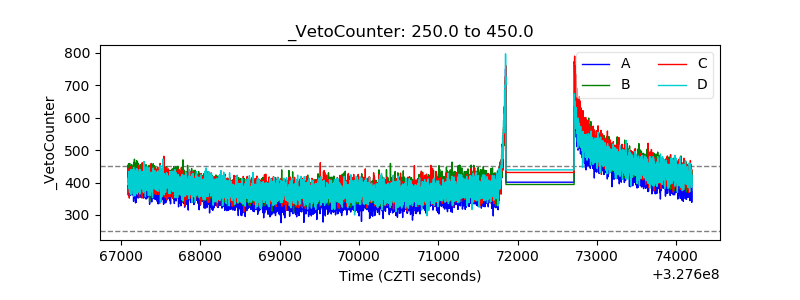 |