| Param | Original file | Final file |
|---|---|---|
| Filename | modeM0/AS1C05_012T06_9000003674_25109cztM0_level2.evt | modeM0/AS1C05_012T06_9000003674_25109cztM0_level2_quad_clean.evt |
| Size (bytes) | 517,622,400 | 103,766,400 |
| Size | 493.6 MB | 99.0 MB |
| Events in quadrant A | 3,220,409 | 692,234 |
| Events in quadrant B | 3,390,725 | 698,684 |
| Events in quadrant C | 3,438,189 | 662,980 |
| Events in quadrant D | 5,173,538 | 622,791 |
| Mode M9 | |||
|---|---|---|---|
| Quadrant | BADHDUFLAG | Total packets | Discarded packets |
| A | 0 | 15 | 0 |
| B | 0 | 16 | 0 |
| C | 0 | 16 | 0 |
| D | 0 | 16 | 0 |
| Mode M0 | |||
|---|---|---|---|
| Quadrant | BADHDUFLAG | Total packets | Discarded packets |
| A | 0 | 13962 | 0 |
| B | 0 | 14393 | 0 |
| C | 0 | 14525 | 0 |
| D | 0 | 19898 | 0 |
| Quadrant | Total seconds | Saturated seconds | Saturation percentage |
|---|---|---|---|
| A | 6687 | 46 | 0.687902% |
| B | 6687 | 52 | 0.777628% |
| C | 6687 | 92 | 1.375804% |
| D | 6687 | 472 | 7.058472% |
Noise dominated data is calculated using 1-second bins in cleaned event files. If a bin has >2000 counts, and if more than 50% of those come from <1% of pixels, then it is considered to be noise-dominated and hence unusable.
| Quadrant | # 1 sec bins | Bins with >0 counts | Bins with >2000 counts | High rate bins dominated by noise | Noise dominated (total time) | Noise dominated (detector-on time) | Marked lightcurve |
|---|---|---|---|---|---|---|---|
| A | 7717 | 6687 | 0 | 0 | 0.00% | 0.00% | 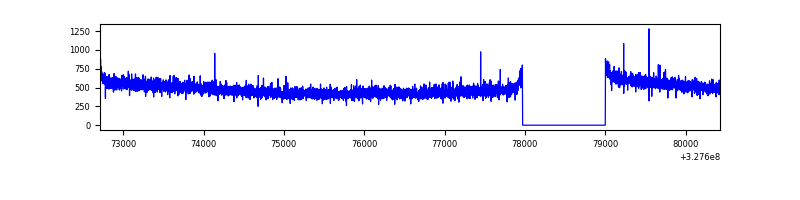 |
| B | 7717 | 6687 | 0 | 0 | 0.00% | 0.00% | 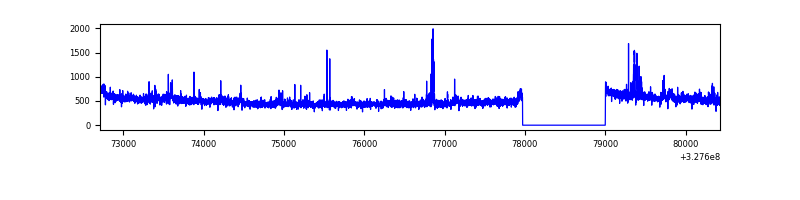 |
| C | 7717 | 6688 | 7 | 7 | 0.09% | 0.10% | 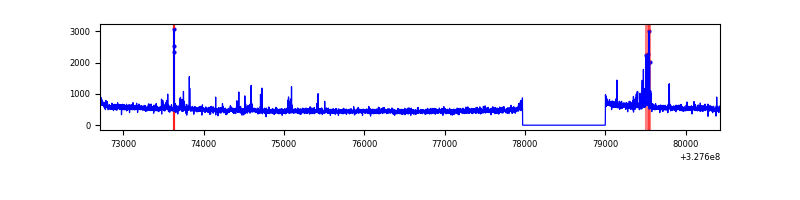 |
| D | 7717 | 6688 | 325 | 325 | 4.21% | 4.86% | 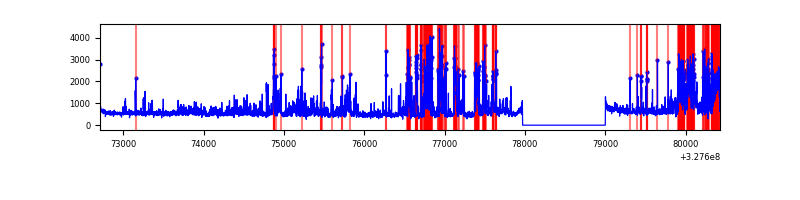 |
Top three noisy pixels from each quadrant. If the there are fewer than three noisy pixels in the level2.evt file, extra rows are filled as -1
| Pixel properties | Quadrant properties | ||||||
|---|---|---|---|---|---|---|---|
| Quadrant | DetID | PixID | Counts | Sigma | Mean | Median | Sigma |
| A | 13 | 254 | 11429 | 63.28 | 835 | 816 | 167.7 |
| A | 3 | 137 | 7298 | 38.65 | 835 | 816 | 167.7 |
| A | 0 | 226 | 7158 | 37.82 | 835 | 816 | 167.7 |
| B | 0 | 189 | 59555 | 379.42 | 826 | 806 | 154.8 |
| B | 0 | 190 | 52238 | 332.16 | 826 | 806 | 154.8 |
| B | 4 | 80 | 20056 | 124.32 | 826 | 806 | 154.8 |
| C | 14 | 238 | 127732 | 688.99 | 795 | 802 | 184.2 |
| C | 2 | 16 | 112759 | 607.71 | 795 | 802 | 184.2 |
| C | 7 | 247 | 73519 | 394.72 | 795 | 802 | 184.2 |
| D | 12 | 33 | 933381 | 4904.95 | 785 | 761 | 190.1 |
| D | 1 | 52 | 738297 | 3878.94 | 785 | 761 | 190.1 |
| D | 8 | 195 | 379342 | 1991.08 | 785 | 761 | 190.1 |
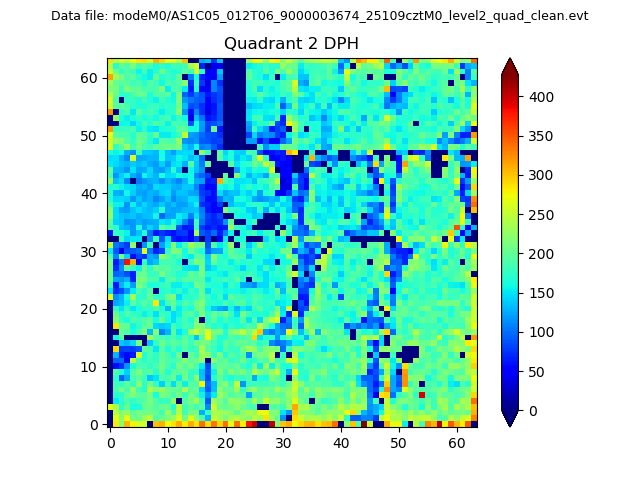
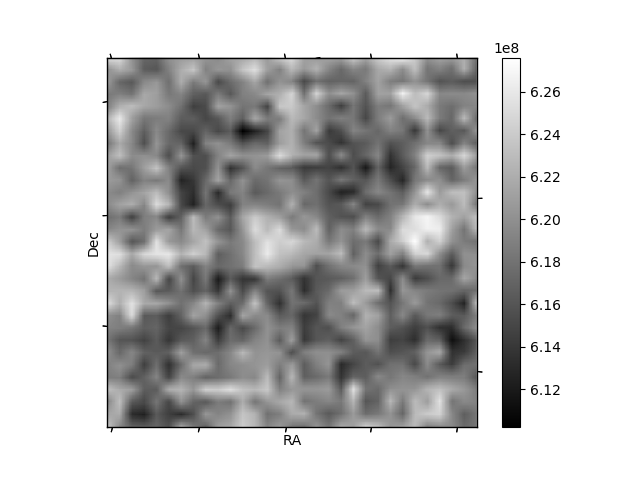
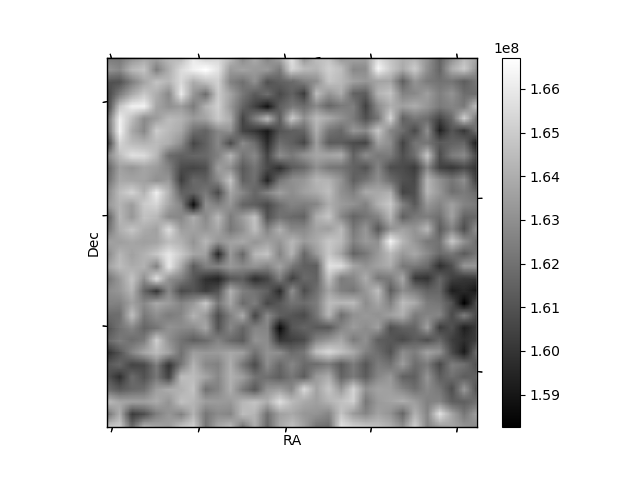
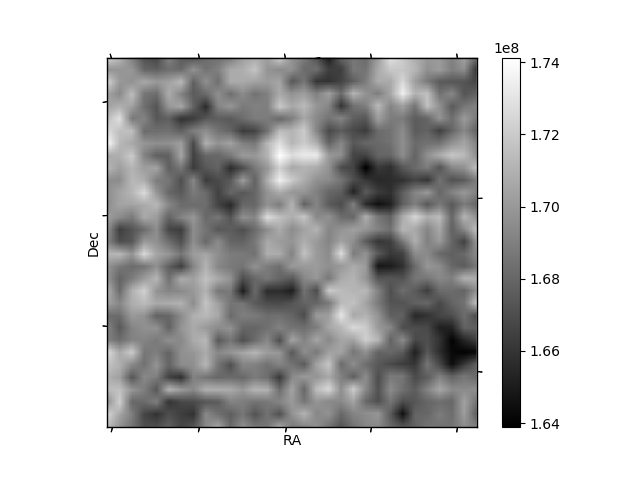
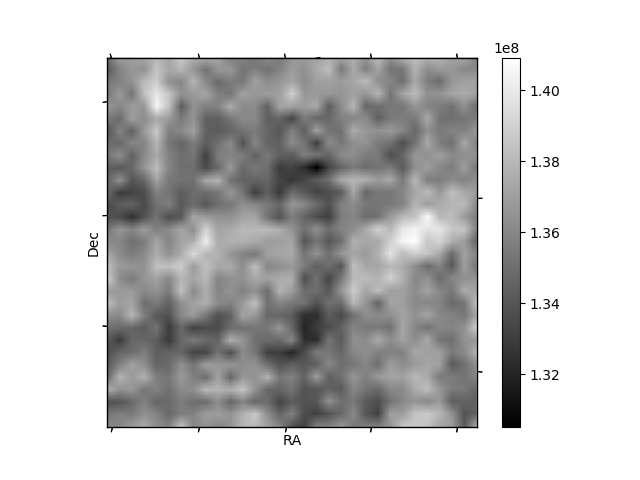
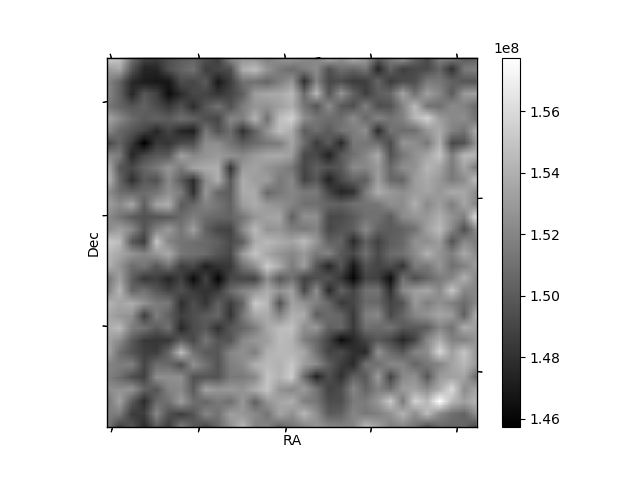
Histogram calculated using DETX and DETY for each event in the final _common_clean file
| Quadrant A | 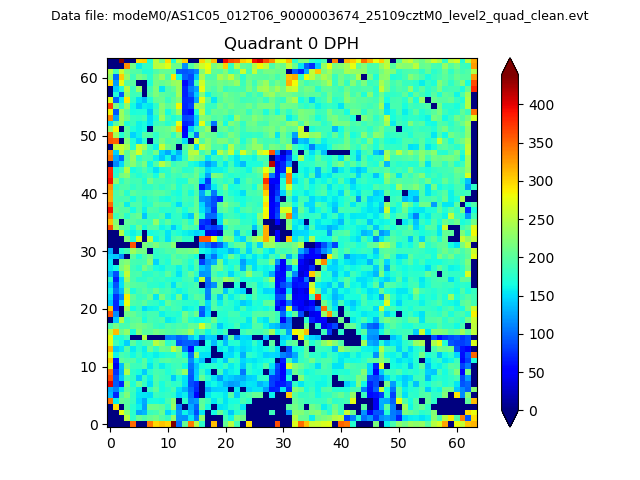 |
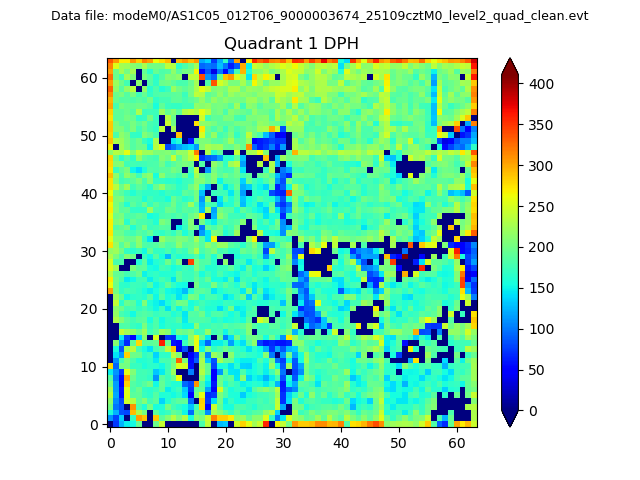 |
Quadrant B |
|---|---|---|---|
| Quadrant D | 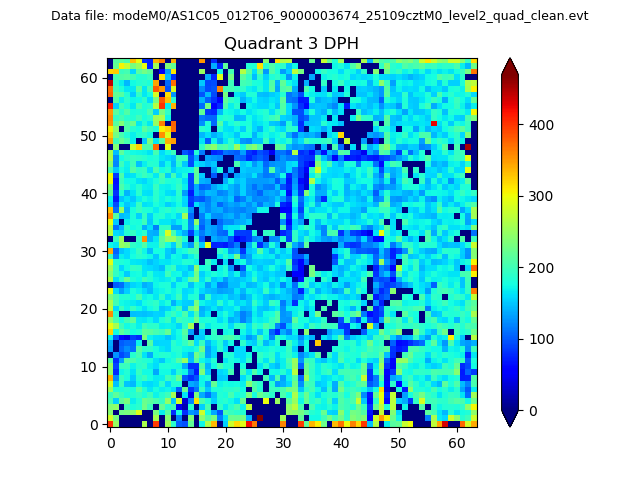 |
 |
Quadrant C |
| Plot type | Count rate plots | Images |
|---|---|---|
| Comparison with Poisson distribution Blue bars denote a histogram of data divided into 1 sec bins. Red curve is a Poisson curve with rate = median count rate of data. |
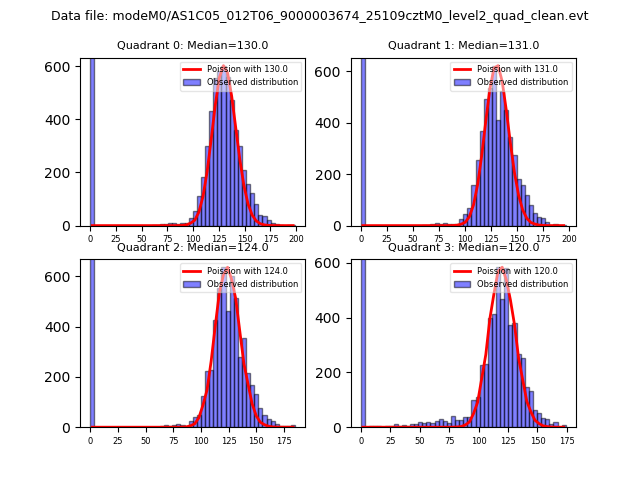 |
 |
| Quadrant-wise count rates Data is divided into 100 sec bins |
 |
|
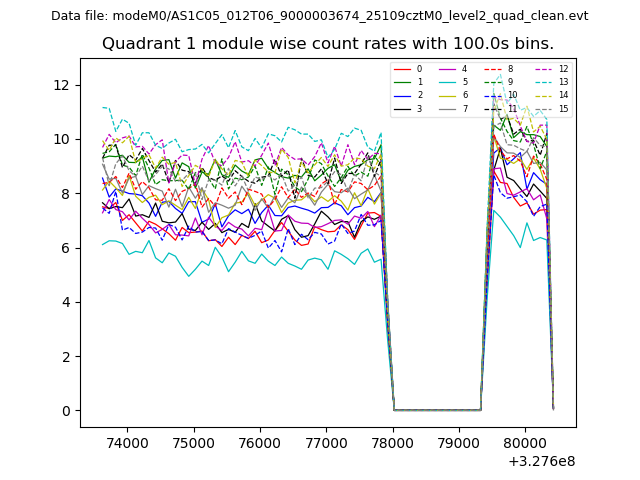
| Module-wise count rates for Quadrant A Data is divided into 100 sec bins |
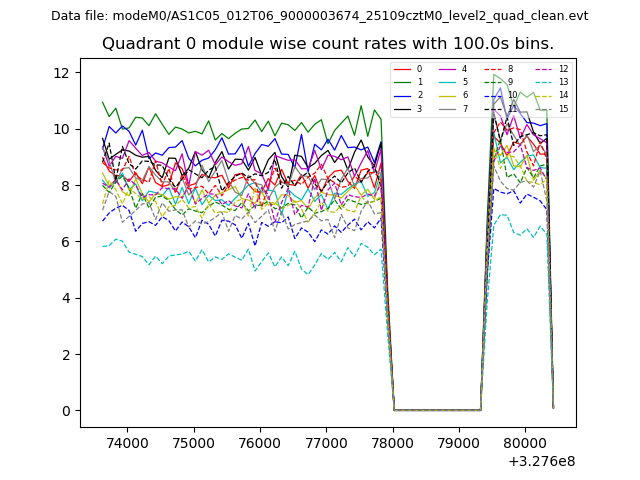 |
 |
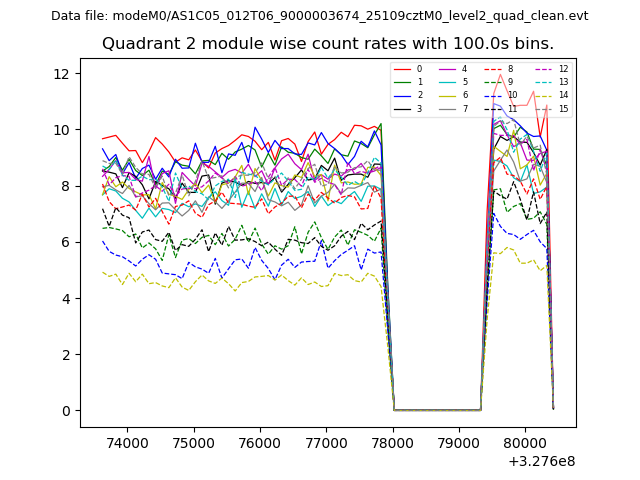
| Module-wise count rates for Quadrant B Data is divided into 100 sec bins |
 |
 |
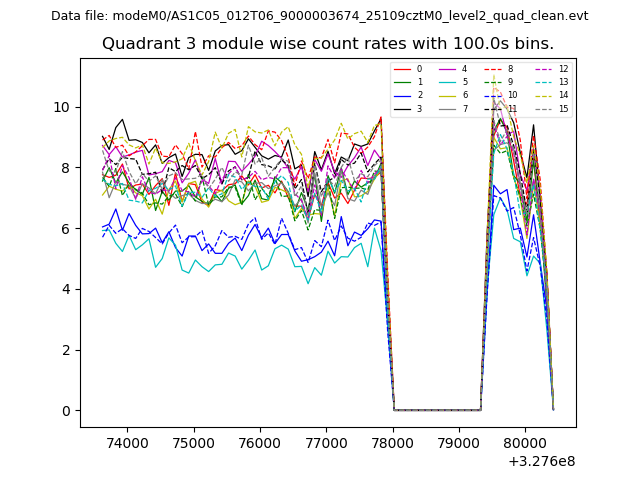
| Module-wise count rates for Quadrant C Data is divided into 100 sec bins |
 |
 |
| Module-wise count rates for Quadrant D Data is divided into 100 sec bins |
 |
 |
| Parameter | Plot |
|---|---|
| CZT HV Monitor | 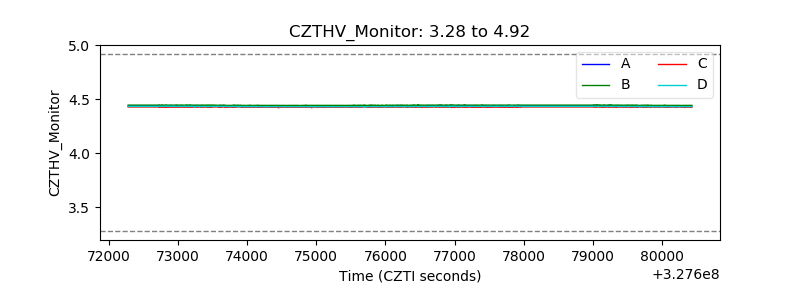 |
| D_VDD | 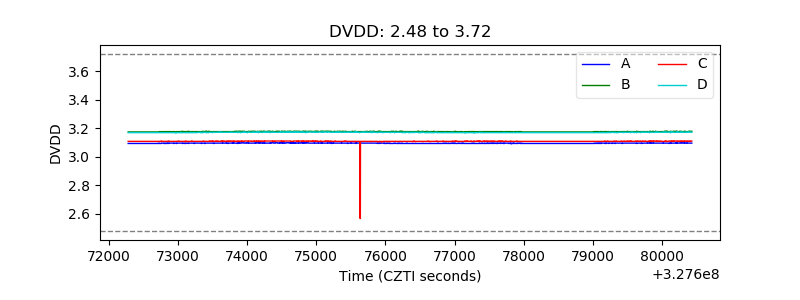 |
| Temperature 1 | 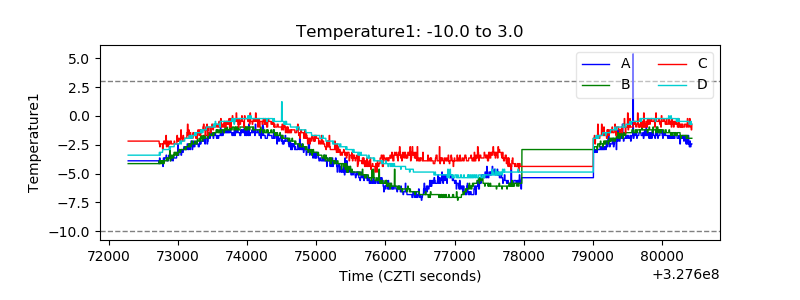 |
| Veto HV Monitor | 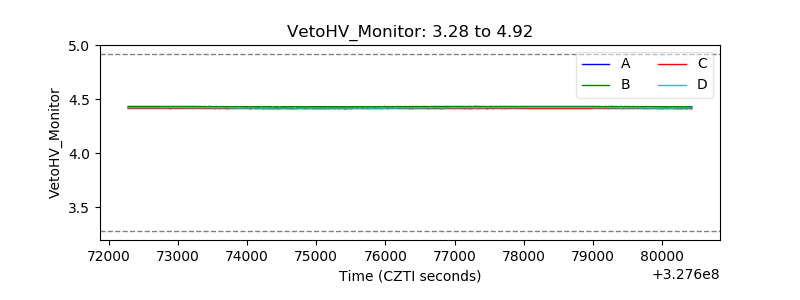 |
| Veto LLD | 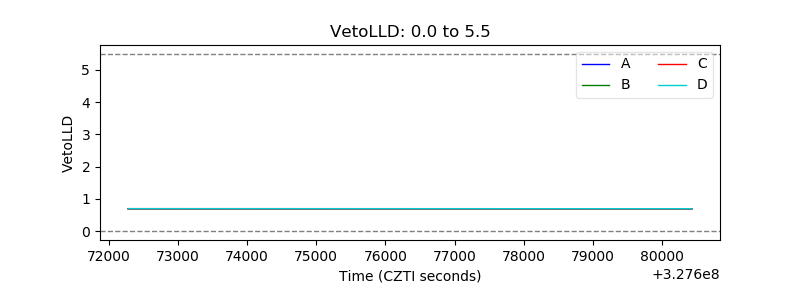 |
| Alpha Counter | 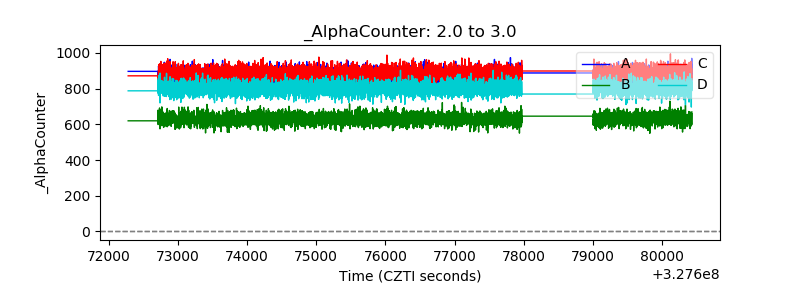 |
| _CPM_Rate |  |
| CZT Counter | 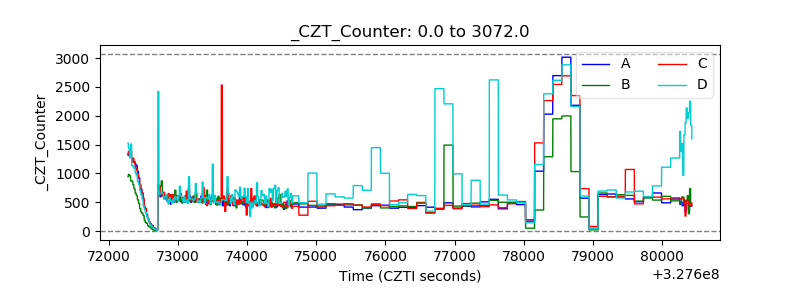 |
| +2.5 Volts monitor |  |
| +5 Volts monitor |  |
| _ROLL_ROT | 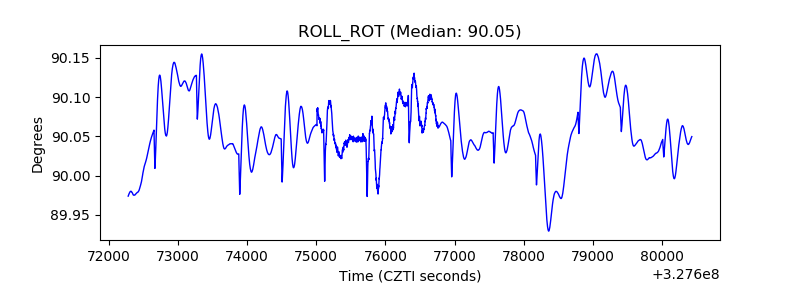 |
| _Roll_DEC | 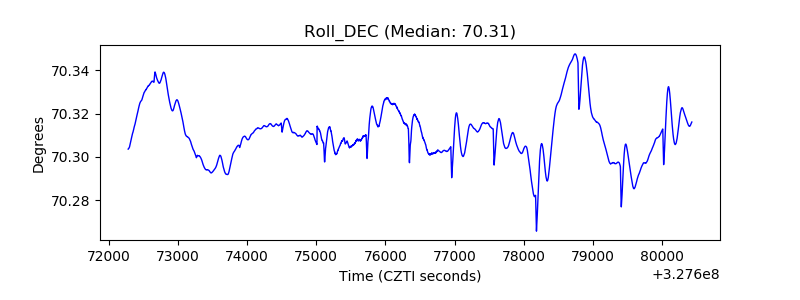 |
| _Roll_RA | 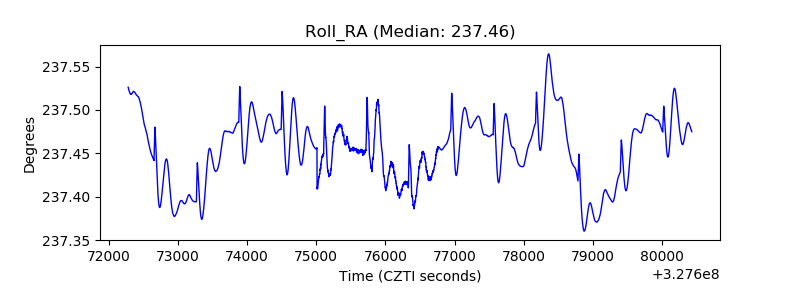 |
| Veto Counter | 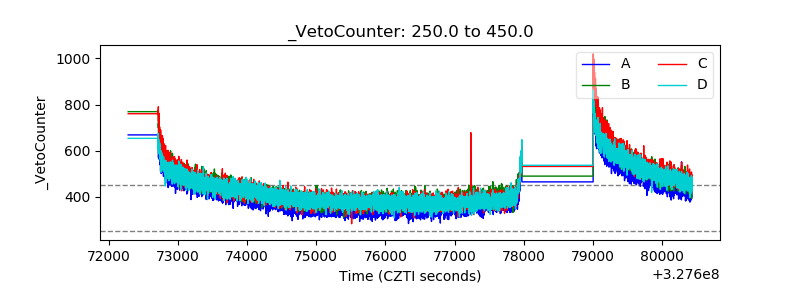 |