| Param | Original file | Final file |
|---|---|---|
| Filename | modeM0/AS1C05_012T06_9000003674_25111cztM0_level2.evt | modeM0/AS1C05_012T06_9000003674_25111cztM0_level2_quad_clean.evt |
| Size (bytes) | 507,703,680 | 119,784,960 |
| Size | 484.2 MB | 114.2 MB |
| Events in quadrant A | 3,141,071 | 820,826 |
| Events in quadrant B | 3,257,521 | 832,069 |
| Events in quadrant C | 3,472,765 | 796,349 |
| Events in quadrant D | 5,074,678 | 736,730 |
| Mode M9 | |||
|---|---|---|---|
| Quadrant | BADHDUFLAG | Total packets | Discarded packets |
| A | 0 | 12 | 0 |
| B | 0 | 12 | 0 |
| C | 0 | 12 | 0 |
| D | 0 | 12 | 0 |
| Mode M0 | |||
|---|---|---|---|
| Quadrant | BADHDUFLAG | Total packets | Discarded packets |
| A | 0 | 13644 | 0 |
| B | 0 | 14001 | 0 |
| C | 0 | 14564 | 0 |
| D | 0 | 19503 | 0 |
| Quadrant | Total seconds | Saturated seconds | Saturation percentage |
|---|---|---|---|
| A | 6335 | 54 | 0.852407% |
| B | 6334 | 63 | 0.994632% |
| C | 6334 | 126 | 1.989264% |
| D | 6334 | 606 | 9.567414% |
Noise dominated data is calculated using 1-second bins in cleaned event files. If a bin has >2000 counts, and if more than 50% of those come from <1% of pixels, then it is considered to be noise-dominated and hence unusable.
| Quadrant | # 1 sec bins | Bins with >0 counts | Bins with >2000 counts | High rate bins dominated by noise | Noise dominated (total time) | Noise dominated (detector-on time) | Marked lightcurve |
|---|---|---|---|---|---|---|---|
| A | 7495 | 6335 | 0 | 0 | 0.00% | 0.00% | 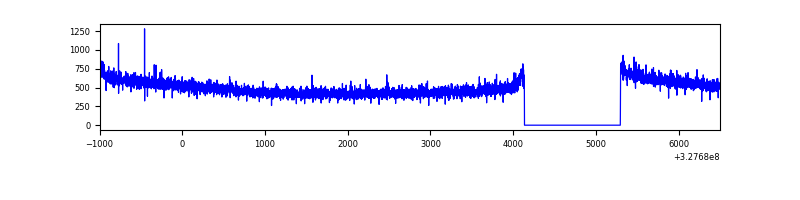 |
| B | 7494 | 6334 | 1 | 1 | 0.01% | 0.02% | 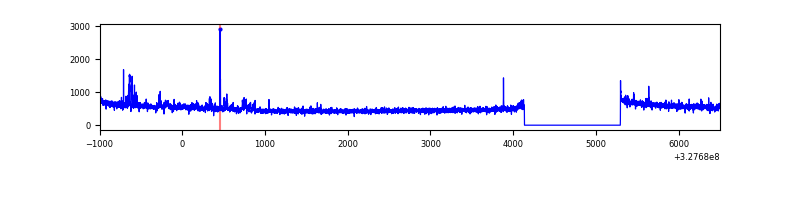 |
| C | 7494 | 6334 | 12 | 12 | 0.16% | 0.19% | 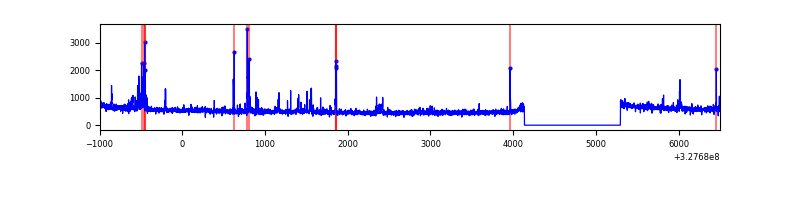 |
| D | 7494 | 6334 | 325 | 325 | 4.34% | 5.13% | 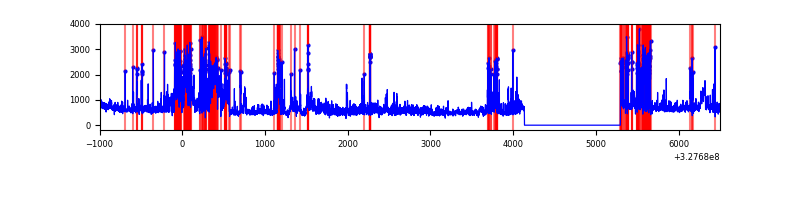 |
Top three noisy pixels from each quadrant. If the there are fewer than three noisy pixels in the level2.evt file, extra rows are filled as -1
| Pixel properties | Quadrant properties | ||||||
|---|---|---|---|---|---|---|---|
| Quadrant | DetID | PixID | Counts | Sigma | Mean | Median | Sigma |
| A | 13 | 254 | 10492 | 59.9 | 813 | 798 | 161.8 |
| A | 0 | 226 | 7062 | 38.71 | 813 | 798 | 161.8 |
| A | 3 | 137 | 7056 | 38.67 | 813 | 798 | 161.8 |
| B | 0 | 190 | 72462 | 478.23 | 806 | 786 | 149.9 |
| B | 0 | 189 | 20167 | 129.31 | 806 | 786 | 149.9 |
| B | 10 | 251 | 17657 | 112.57 | 806 | 786 | 149.9 |
| C | 2 | 16 | 124235 | 679.23 | 785 | 792 | 181.7 |
| C | 14 | 238 | 123998 | 677.93 | 785 | 792 | 181.7 |
| C | 7 | 247 | 72247 | 393.17 | 785 | 792 | 181.7 |
| D | 1 | 52 | 1306156 | 7209.89 | 757 | 737 | 181.1 |
| D | 12 | 33 | 372696 | 2054.35 | 757 | 737 | 181.1 |
| D | 8 | 195 | 280964 | 1547.71 | 757 | 737 | 181.1 |
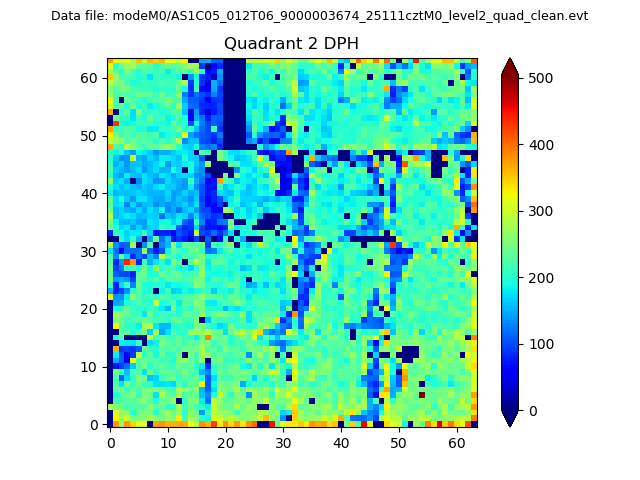
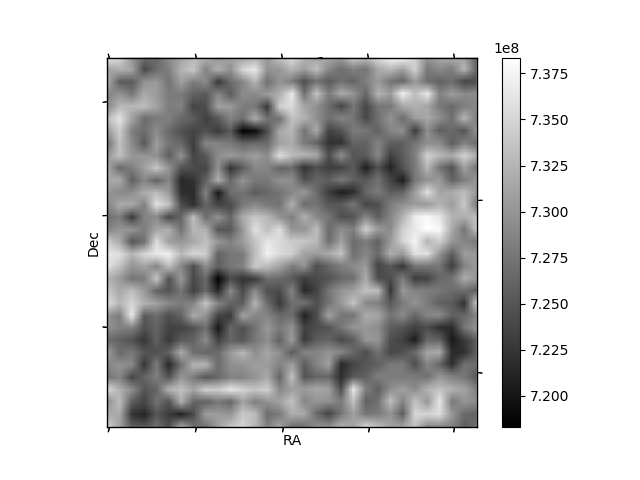
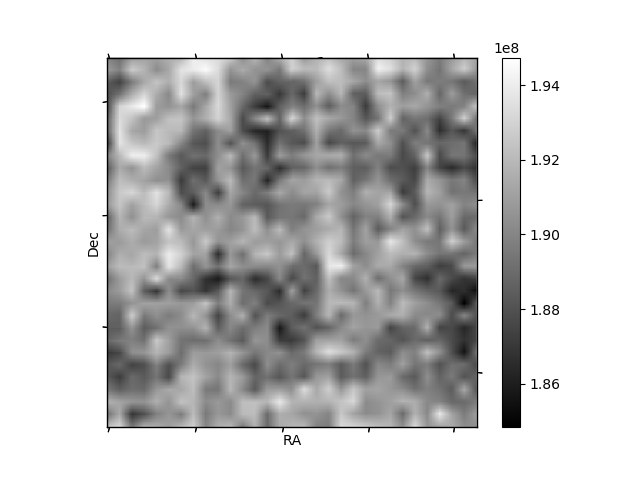
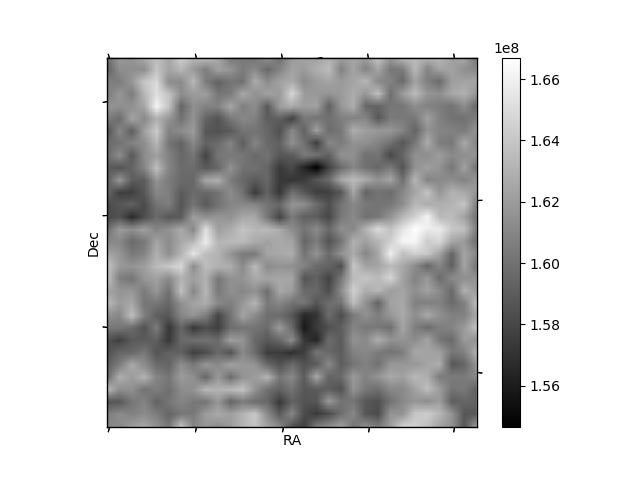
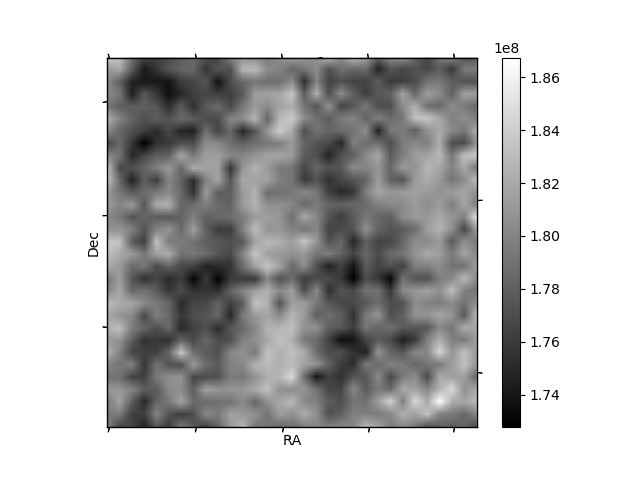
Histogram calculated using DETX and DETY for each event in the final _common_clean file
| Quadrant A | 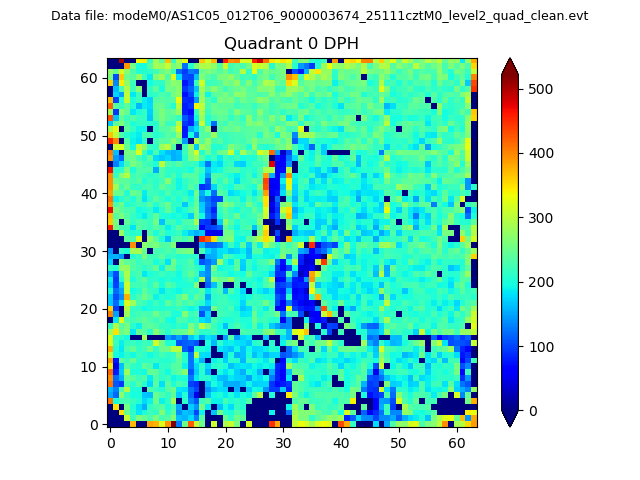 |
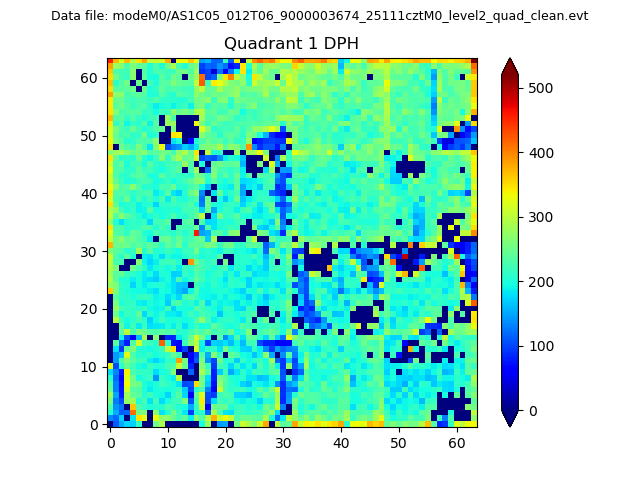 |
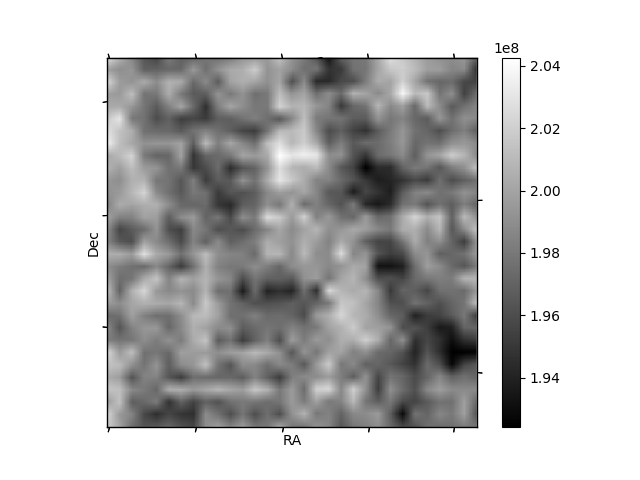
Quadrant B |
|---|---|---|---|
| Quadrant D | 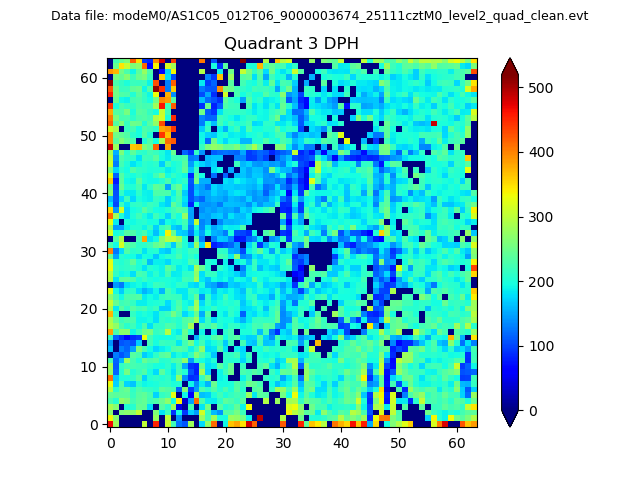 |
 |
Quadrant C |
| Plot type | Count rate plots | Images |
|---|---|---|
| Comparison with Poisson distribution Blue bars denote a histogram of data divided into 1 sec bins. Red curve is a Poisson curve with rate = median count rate of data. |
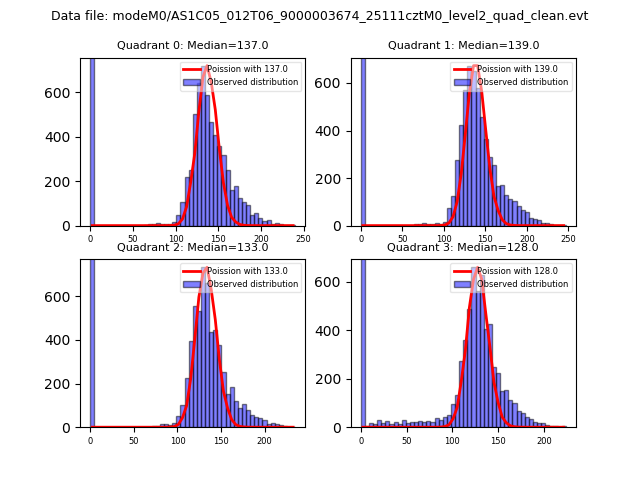 |
 |
| Quadrant-wise count rates Data is divided into 100 sec bins |
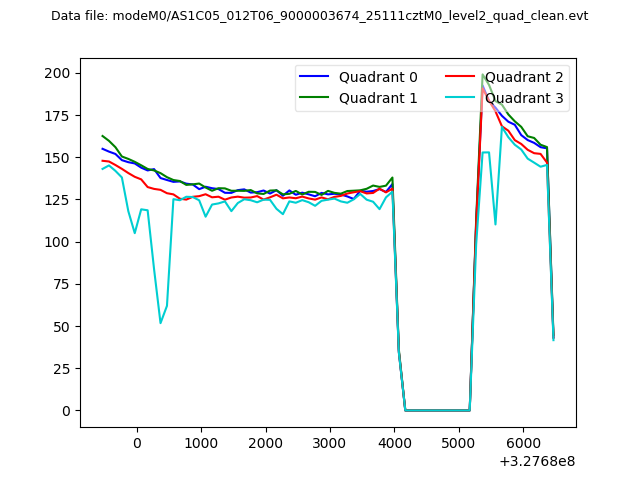 |
|
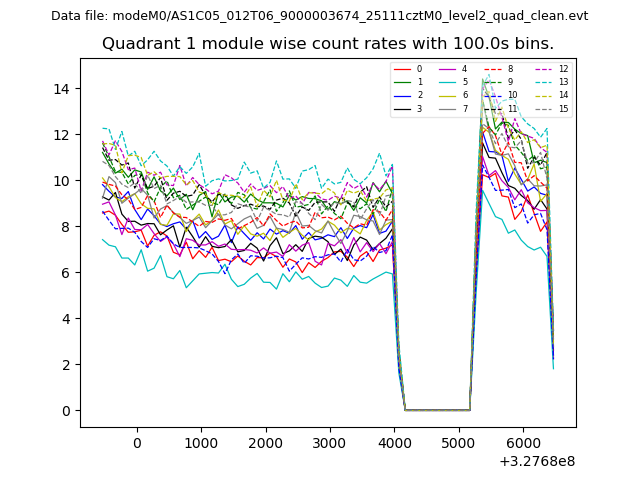
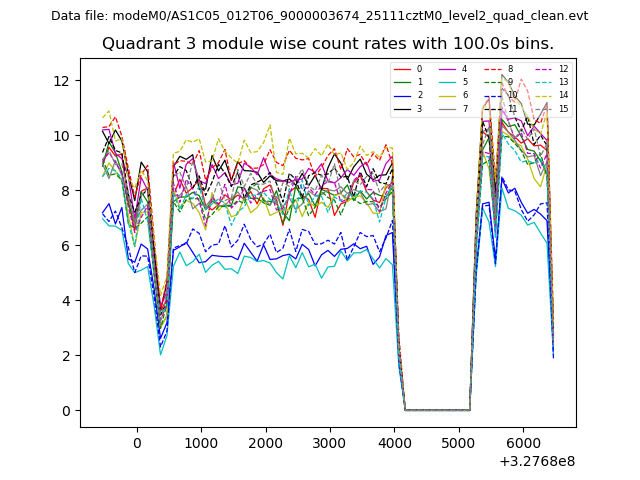
| Module-wise count rates for Quadrant A Data is divided into 100 sec bins |
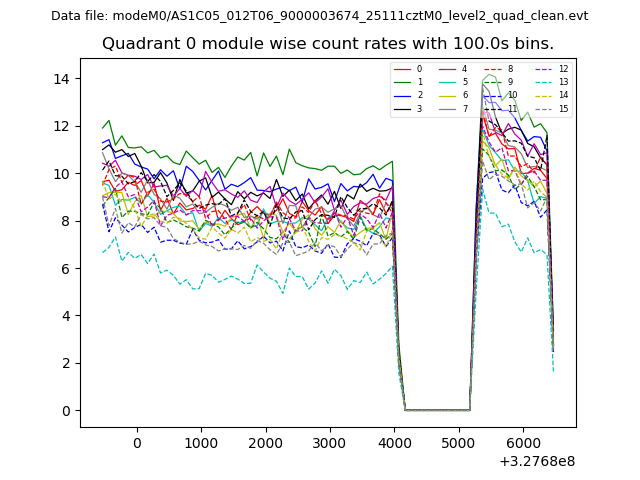 |
 |
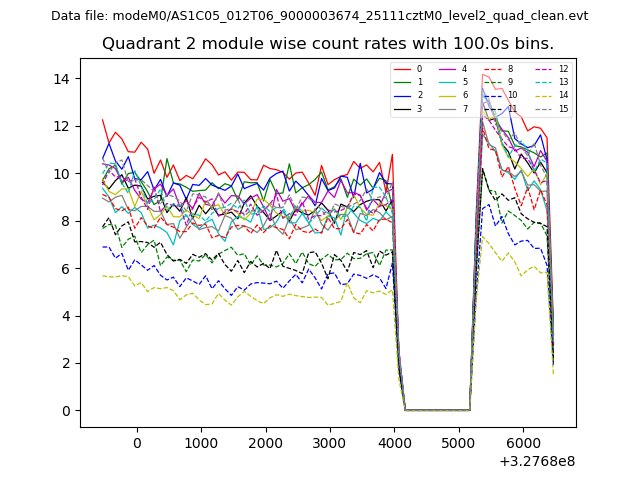
| Module-wise count rates for Quadrant B Data is divided into 100 sec bins |
 |
 |
| Module-wise count rates for Quadrant C Data is divided into 100 sec bins |
 |
 |
| Module-wise count rates for Quadrant D Data is divided into 100 sec bins |
 |
 |
| Parameter | Plot |
|---|---|
| CZT HV Monitor | 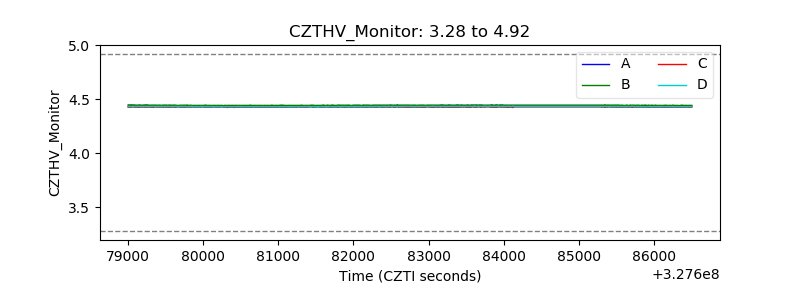 |
| D_VDD | 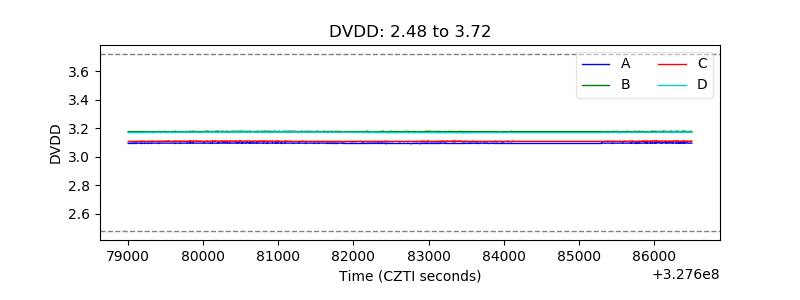 |
| Temperature 1 | 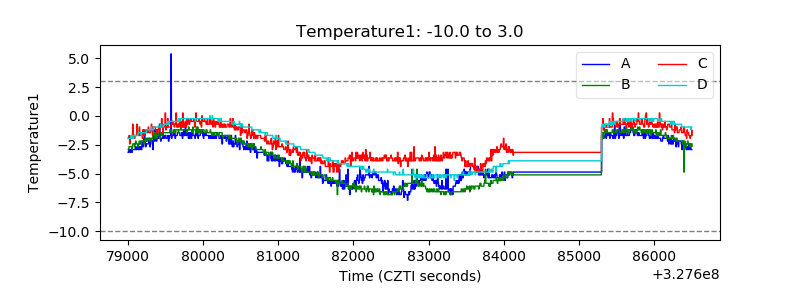 |
| Veto HV Monitor | 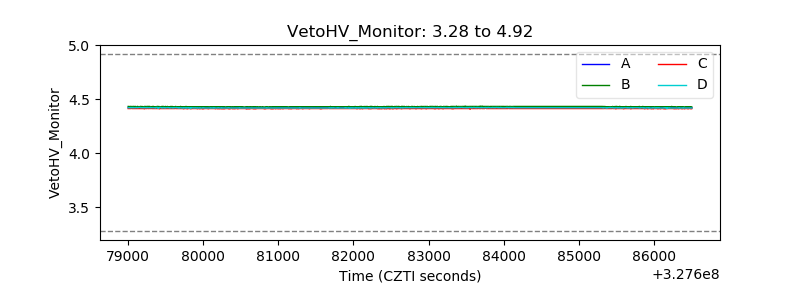 |
| Veto LLD | 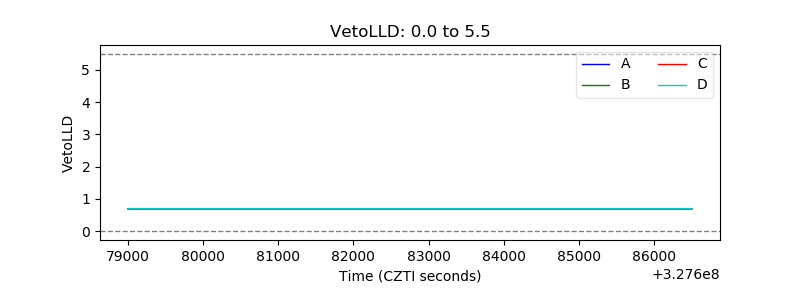 |
| Alpha Counter | 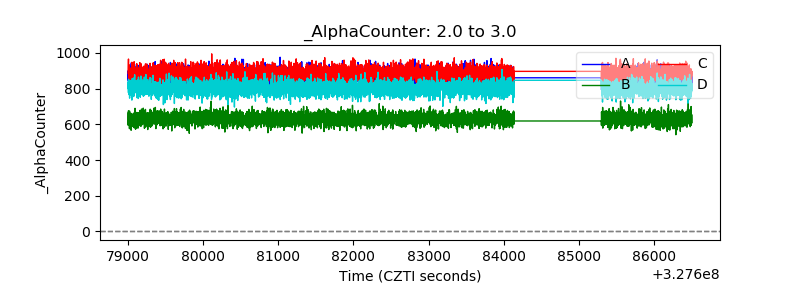 |
| _CPM_Rate | 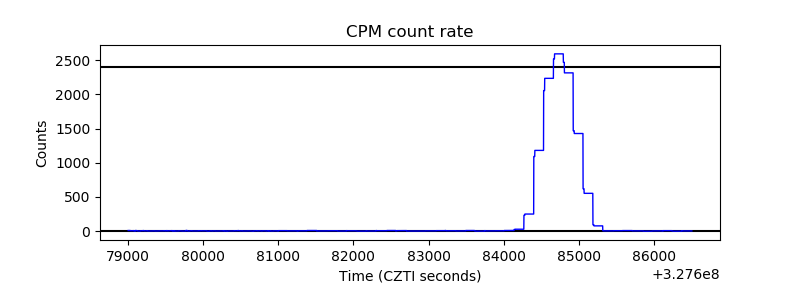 |
| CZT Counter | 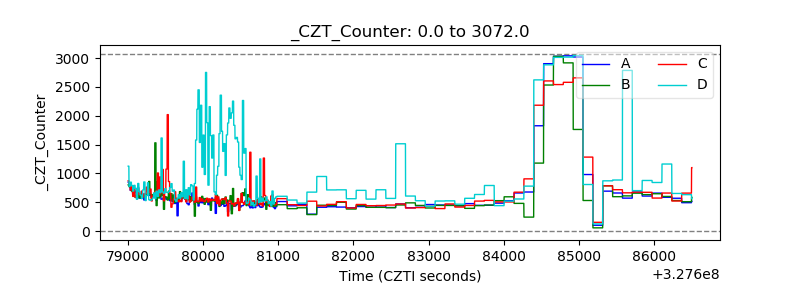 |
| +2.5 Volts monitor | 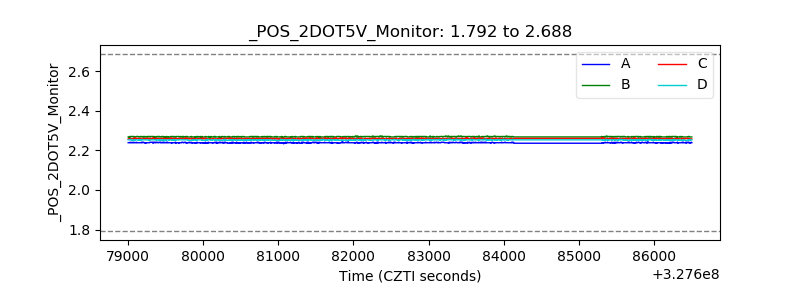 |
| +5 Volts monitor |  |
| _ROLL_ROT | 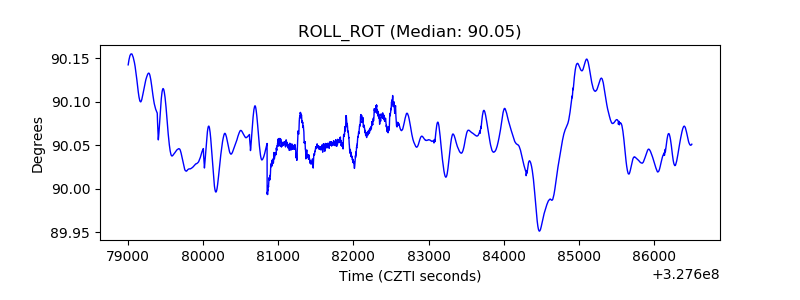 |
| _Roll_DEC | 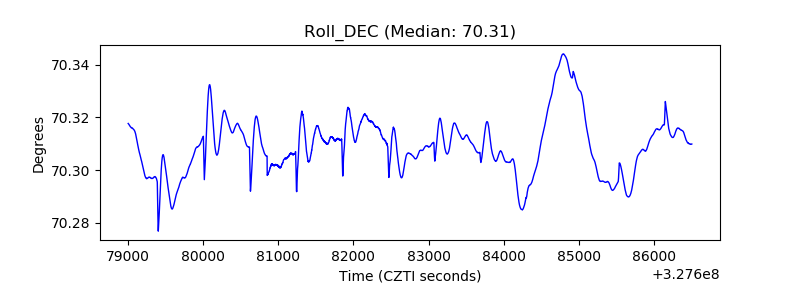 |
| _Roll_RA | 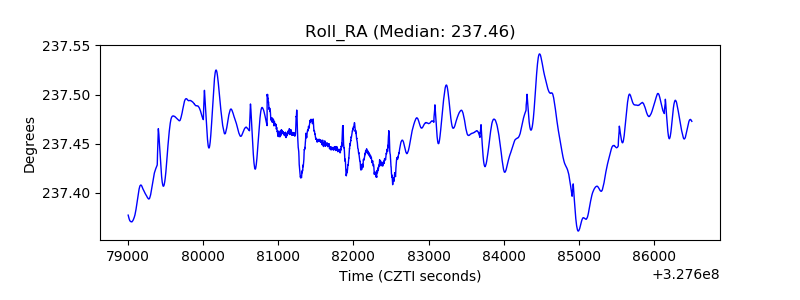 |
| Veto Counter | 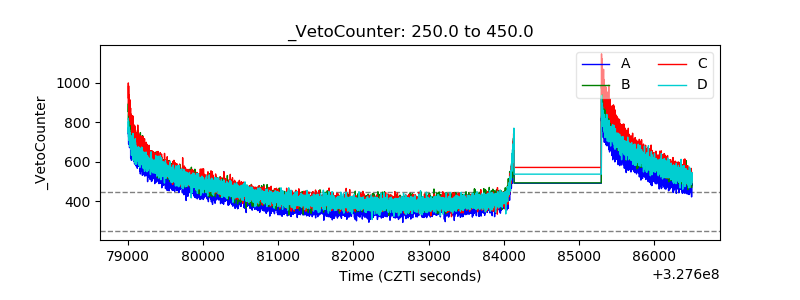 |