| Param | Original file | Final file |
|---|---|---|
| Filename | modeM0/AS1C05_012T06_9000003674_25113cztM0_level2.evt | modeM0/AS1C05_012T06_9000003674_25113cztM0_level2_quad_clean.evt |
| Size (bytes) | 502,309,440 | 126,414,720 |
| Size | 479.0 MB | 120.6 MB |
| Events in quadrant A | 3,135,299 | 853,903 |
| Events in quadrant B | 3,479,447 | 878,628 |
| Events in quadrant C | 3,431,441 | 855,128 |
| Events in quadrant D | 4,748,969 | 811,467 |
| Mode M9 | |||
|---|---|---|---|
| Quadrant | BADHDUFLAG | Total packets | Discarded packets |
| A | 0 | 18 | 0 |
| B | 0 | 19 | 0 |
| C | 0 | 19 | 0 |
| D | 0 | 19 | 0 |
| Mode M0 | |||
|---|---|---|---|
| Quadrant | BADHDUFLAG | Total packets | Discarded packets |
| A | 0 | 13389 | 0 |
| B | 0 | 14519 | 0 |
| C | 0 | 14403 | 0 |
| D | 0 | 18473 | 0 |
| Quadrant | Total seconds | Saturated seconds | Saturation percentage |
|---|---|---|---|
| A | 6161 | 30 | 0.486934% |
| B | 6161 | 108 | 1.752962% |
| C | 6161 | 106 | 1.720500% |
| D | 6161 | 133 | 2.158740% |
Noise dominated data is calculated using 1-second bins in cleaned event files. If a bin has >2000 counts, and if more than 50% of those come from <1% of pixels, then it is considered to be noise-dominated and hence unusable.
| Quadrant | # 1 sec bins | Bins with >0 counts | Bins with >2000 counts | High rate bins dominated by noise | Noise dominated (total time) | Noise dominated (detector-on time) | Marked lightcurve |
|---|---|---|---|---|---|---|---|
| A | 7511 | 6162 | 0 | 0 | 0.00% | 0.00% | 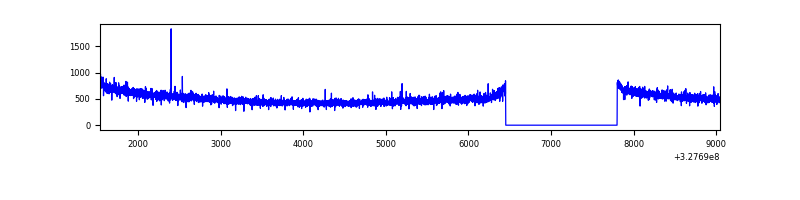 |
| B | 7511 | 6162 | 21 | 21 | 0.28% | 0.34% | 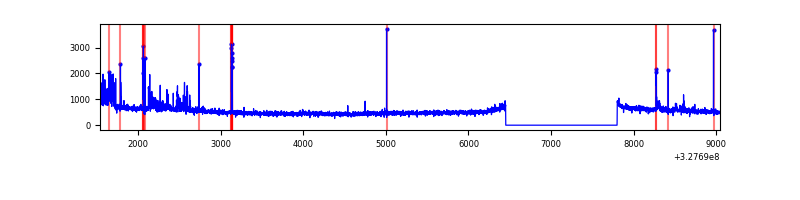 |
| C | 7511 | 6162 | 2 | 2 | 0.03% | 0.03% | 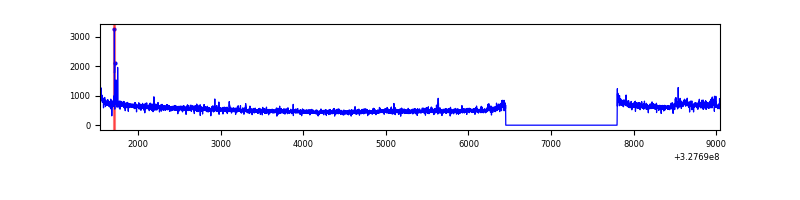 |
| D | 7511 | 6162 | 64 | 64 | 0.85% | 1.04% | 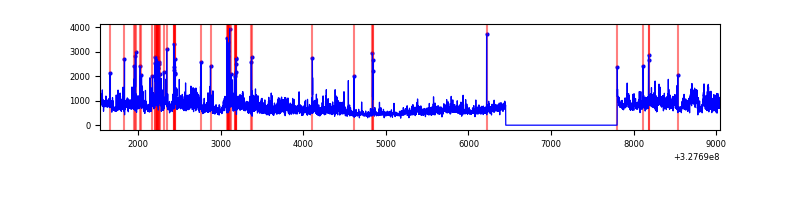 |
Top three noisy pixels from each quadrant. If the there are fewer than three noisy pixels in the level2.evt file, extra rows are filled as -1
| Pixel properties | Quadrant properties | ||||||
|---|---|---|---|---|---|---|---|
| Quadrant | DetID | PixID | Counts | Sigma | Mean | Median | Sigma |
| A | 13 | 254 | 10830 | 63.2 | 810 | 796 | 158.8 |
| A | 4 | 2 | 9996 | 57.95 | 810 | 796 | 158.8 |
| A | 0 | 226 | 7058 | 39.44 | 810 | 796 | 158.8 |
| B | 0 | 189 | 154579 | 1029.55 | 817 | 799 | 149.4 |
| B | 0 | 229 | 57641 | 380.56 | 817 | 799 | 149.4 |
| B | 15 | 36 | 29550 | 192.49 | 817 | 799 | 149.4 |
| C | 14 | 238 | 129505 | 699.92 | 803 | 810 | 183.9 |
| C | 7 | 247 | 111151 | 600.1 | 803 | 810 | 183.9 |
| C | 3 | 233 | 36686 | 195.11 | 803 | 810 | 183.9 |
| D | 8 | 195 | 1099919 | 5775.65 | 799 | 778 | 190.3 |
| D | 12 | 233 | 172612 | 902.93 | 799 | 778 | 190.3 |
| D | 1 | 52 | 170860 | 893.73 | 799 | 778 | 190.3 |
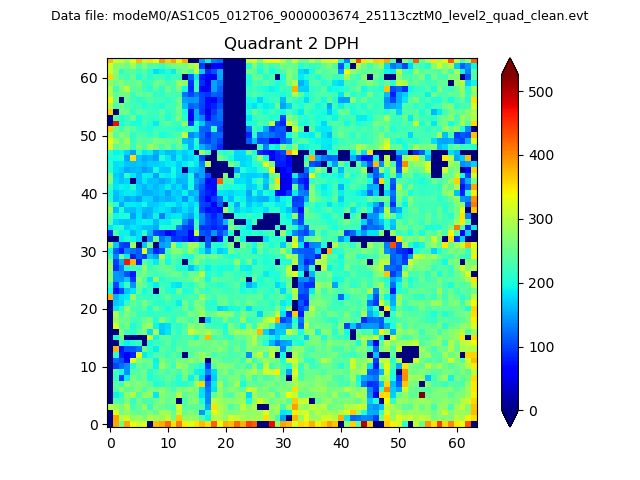
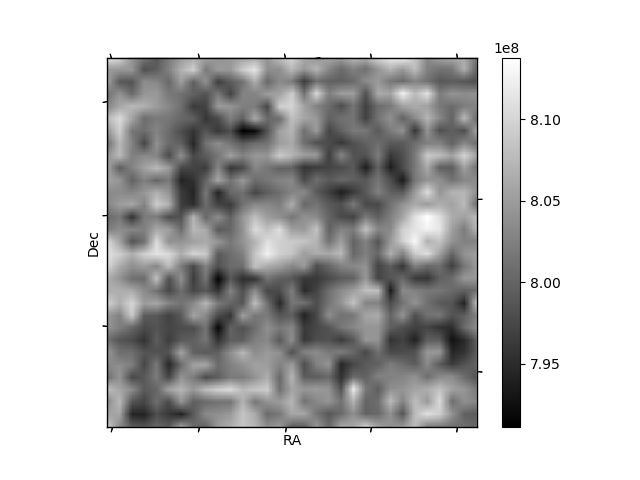
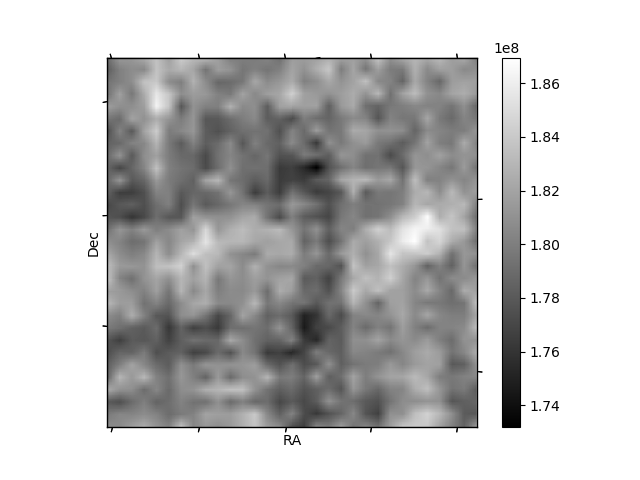
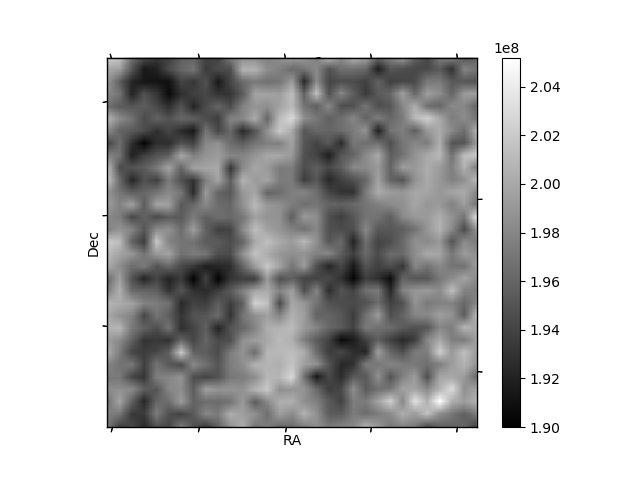
Histogram calculated using DETX and DETY for each event in the final _common_clean file
| Quadrant A | 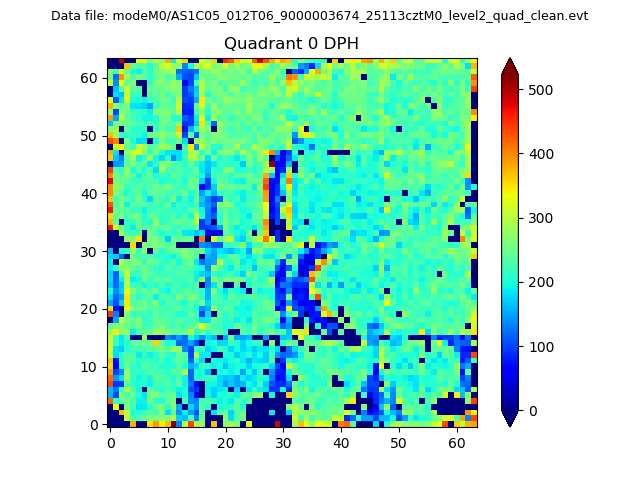 |
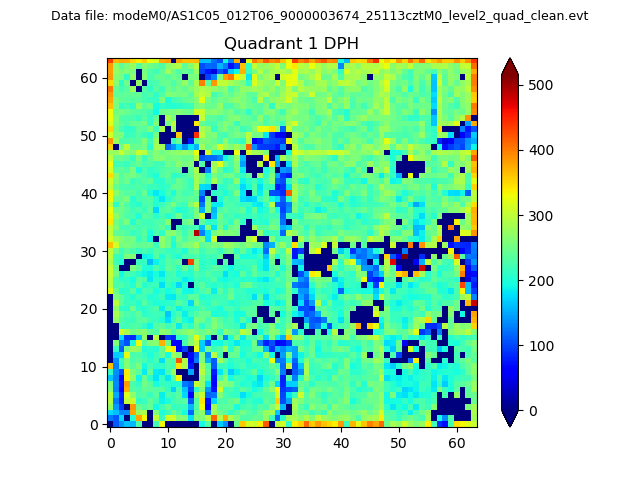 |
Quadrant B |
|---|---|---|---|
| Quadrant D | 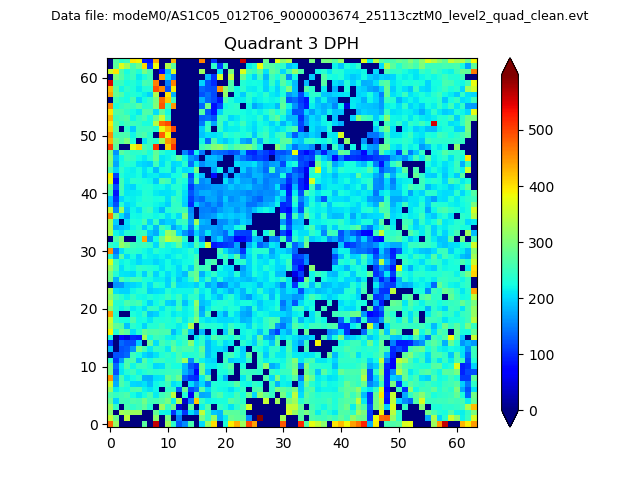 |
 |
Quadrant C |
| Plot type | Count rate plots | Images |
|---|---|---|
| Comparison with Poisson distribution Blue bars denote a histogram of data divided into 1 sec bins. Red curve is a Poisson curve with rate = median count rate of data. |
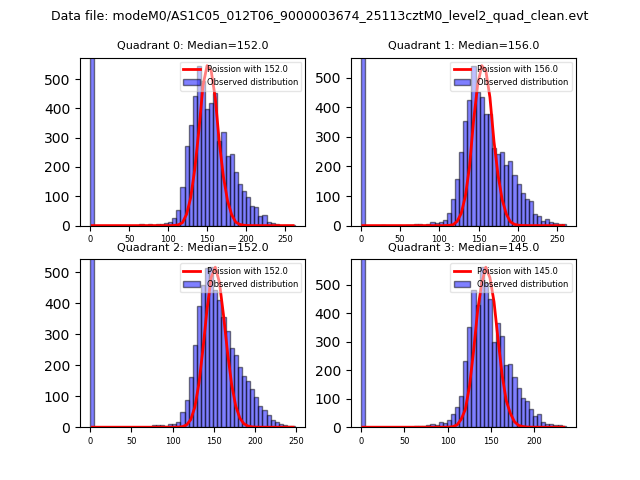 |
 |
| Quadrant-wise count rates Data is divided into 100 sec bins |
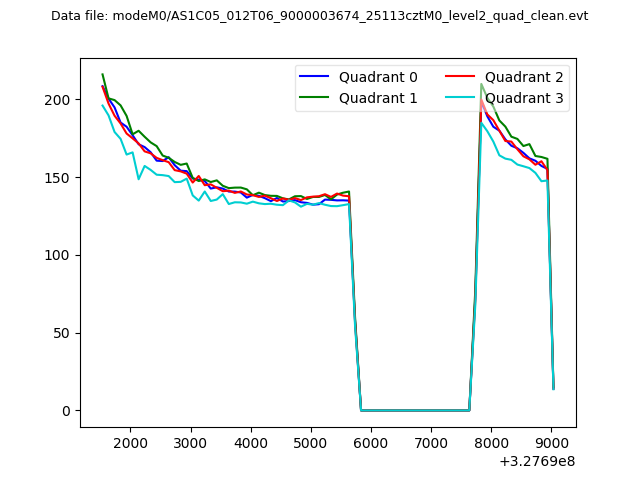 |
|
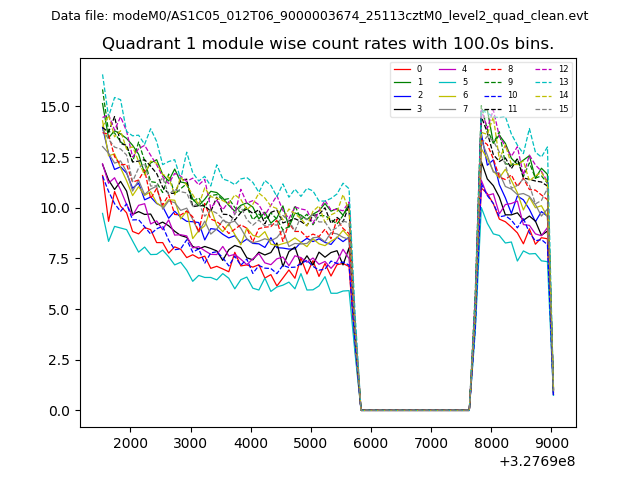
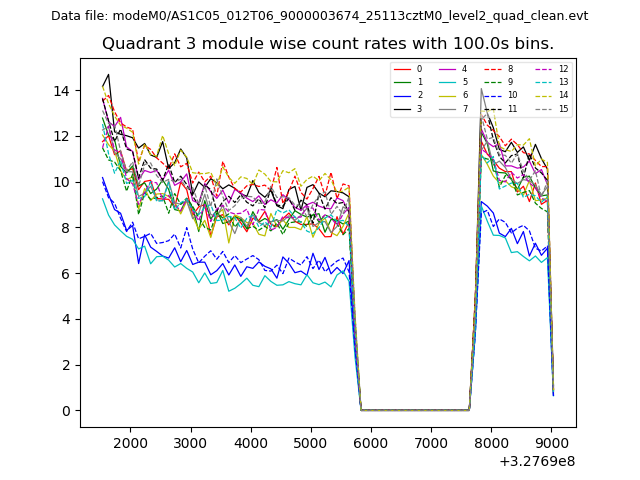
| Module-wise count rates for Quadrant A Data is divided into 100 sec bins |
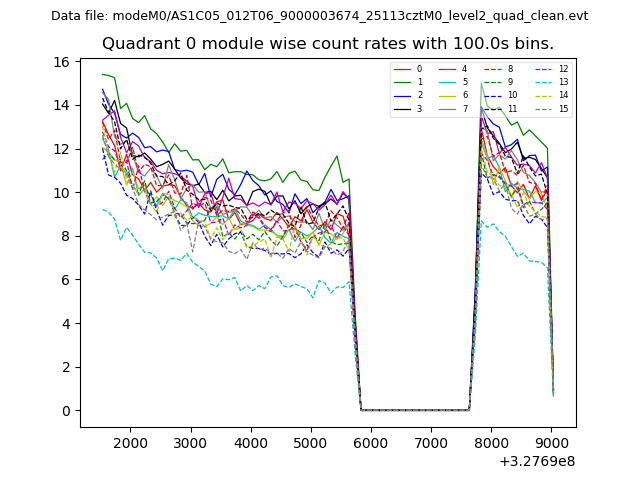 |
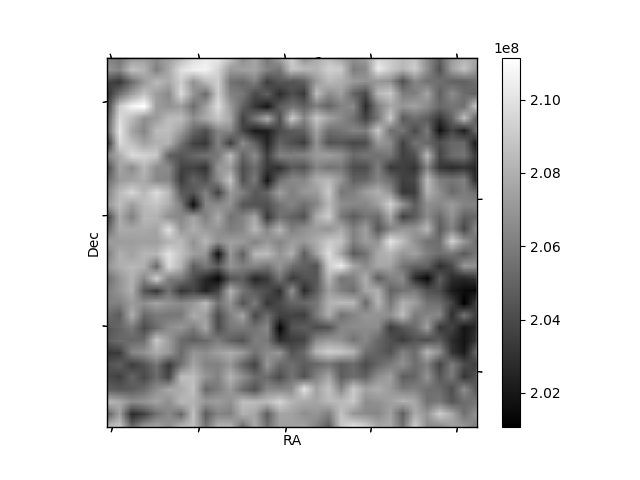 |
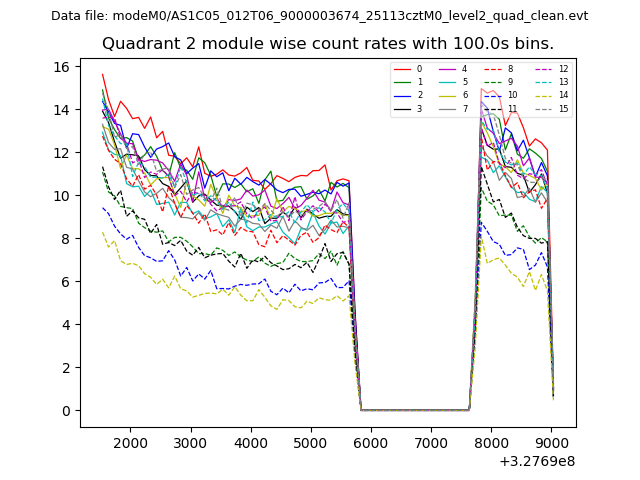
| Module-wise count rates for Quadrant B Data is divided into 100 sec bins |
 |
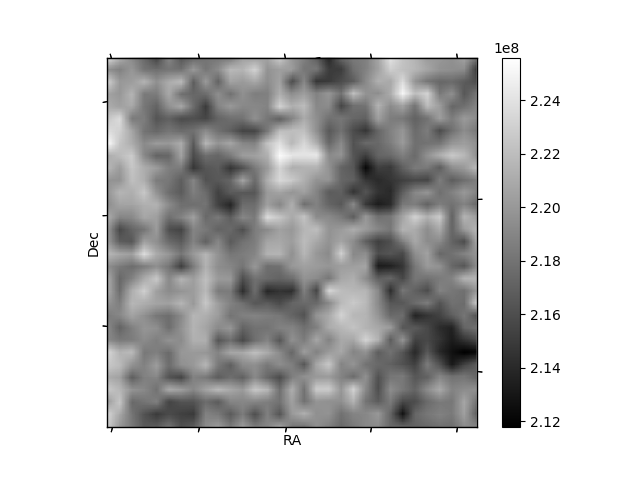 |
| Module-wise count rates for Quadrant C Data is divided into 100 sec bins |
 |
 |
| Module-wise count rates for Quadrant D Data is divided into 100 sec bins |
 |
 |
| Parameter | Plot |
|---|---|
| CZT HV Monitor | 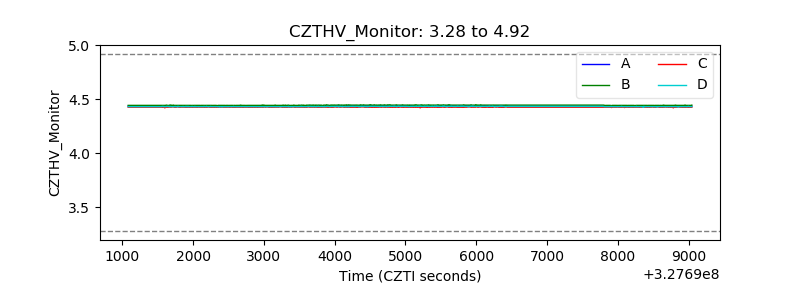 |
| D_VDD | 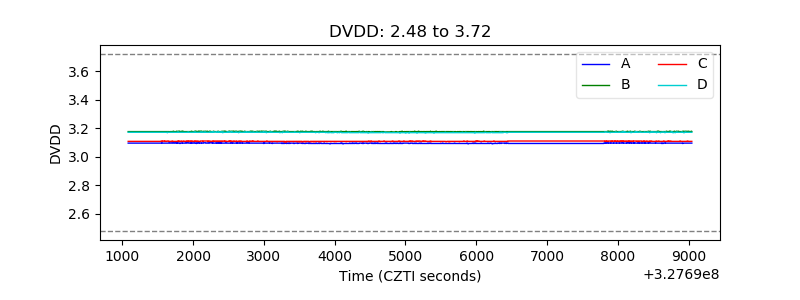 |
| Temperature 1 | 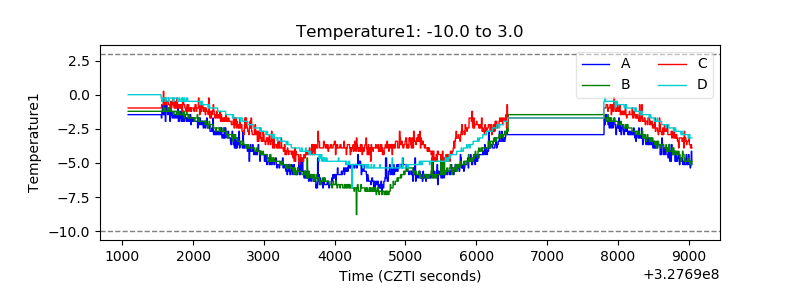 |
| Veto HV Monitor | 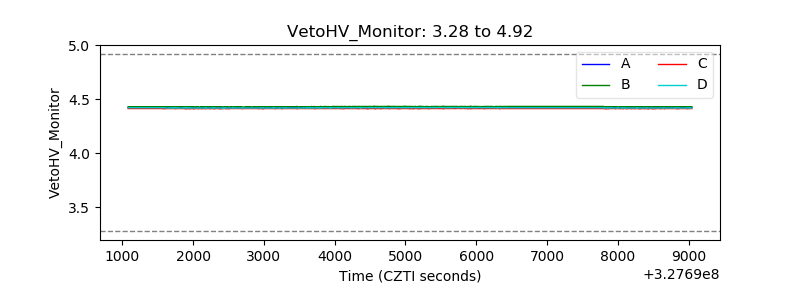 |
| Veto LLD | 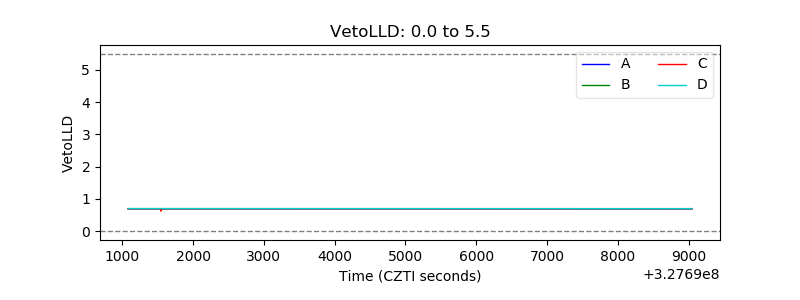 |
| Alpha Counter | 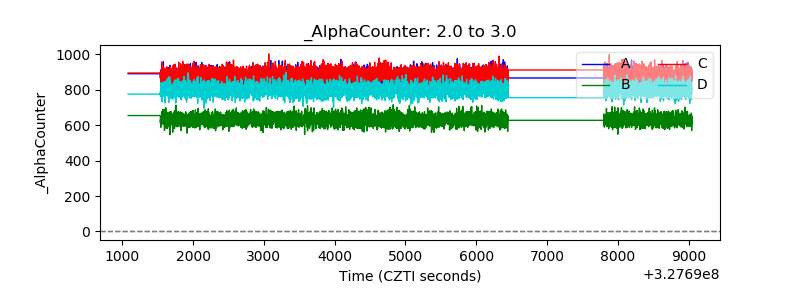 |
| _CPM_Rate | 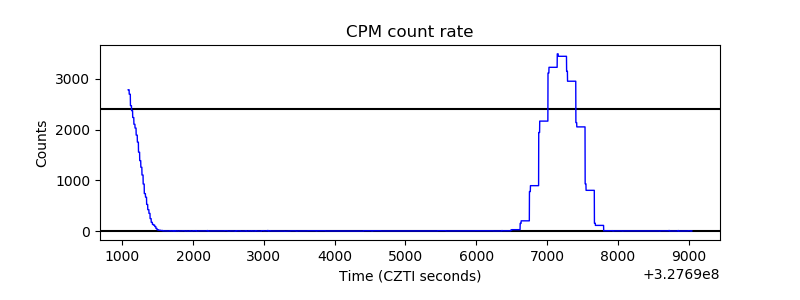 |
| CZT Counter | 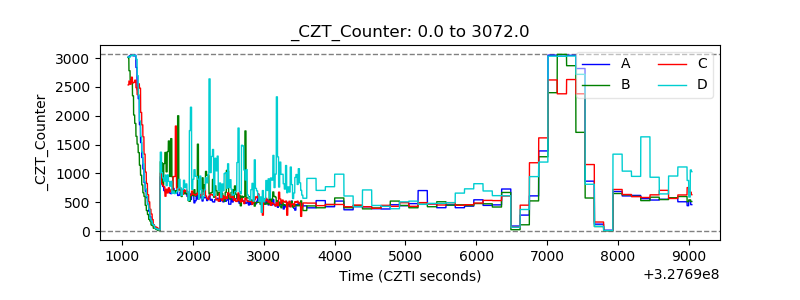 |
| +2.5 Volts monitor |  |
| +5 Volts monitor | 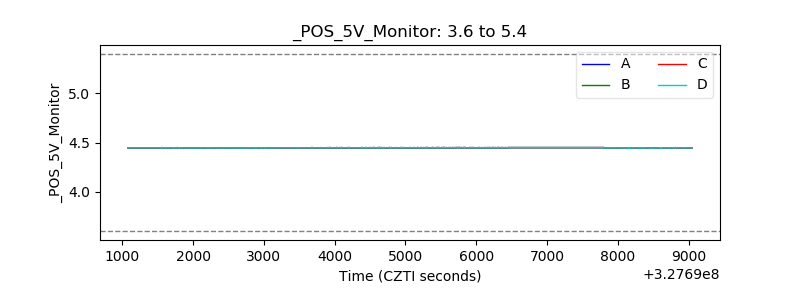 |
| _ROLL_ROT | 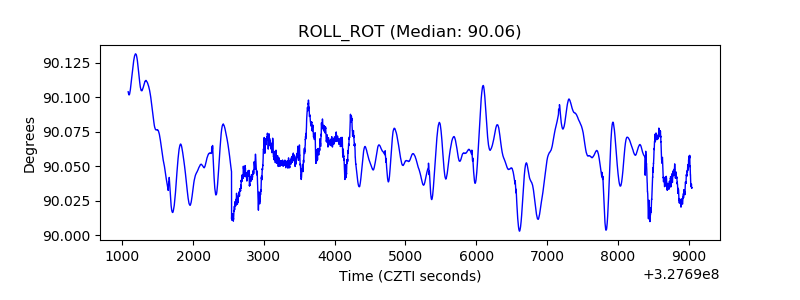 |
| _Roll_DEC | 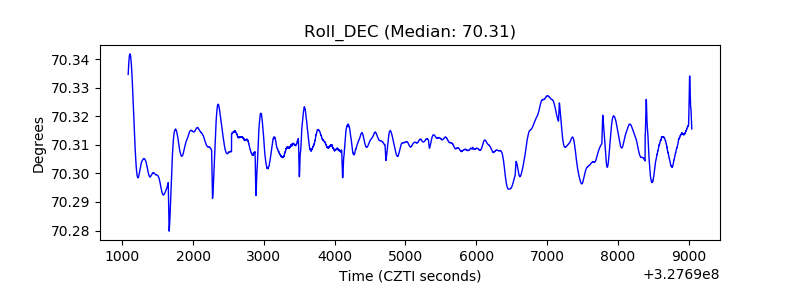 |
| _Roll_RA | 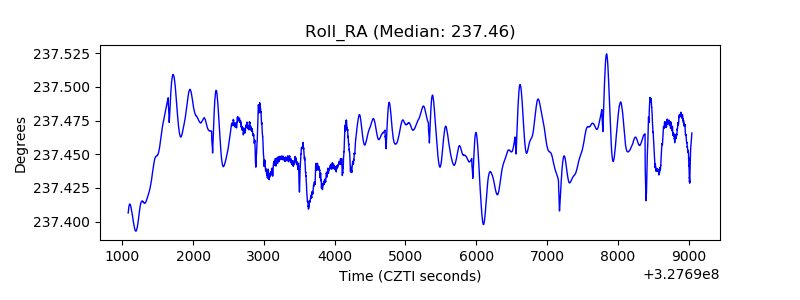 |
| Veto Counter | 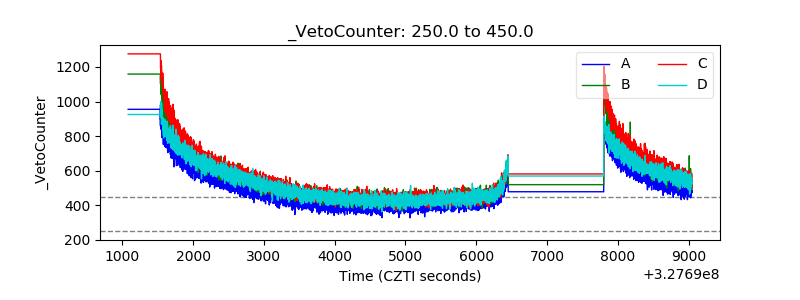 |