| Param | Original file | Final file |
|---|---|---|
| Filename | modeM0/AS1C05_012T06_9000003674_25114cztM0_level2.evt | modeM0/AS1C05_012T06_9000003674_25114cztM0_level2_quad_clean.evt |
| Size (bytes) | 530,046,720 | 117,158,400 |
| Size | 505.5 MB | 111.7 MB |
| Events in quadrant A | 3,057,307 | 780,327 |
| Events in quadrant B | 3,218,229 | 811,915 |
| Events in quadrant C | 4,315,632 | 781,422 |
| Events in quadrant D | 5,043,207 | 743,637 |
| Mode M9 | |||
|---|---|---|---|
| Quadrant | BADHDUFLAG | Total packets | Discarded packets |
| A | 0 | 17 | 0 |
| B | 0 | 18 | 0 |
| C | 0 | 18 | 0 |
| D | 0 | 18 | 0 |
| Mode M0 | |||
|---|---|---|---|
| Quadrant | BADHDUFLAG | Total packets | Discarded packets |
| A | 0 | 13093 | 0 |
| B | 0 | 13551 | 0 |
| C | 0 | 17617 | 0 |
| D | 0 | 19439 | 0 |
| Quadrant | Total seconds | Saturated seconds | Saturation percentage |
|---|---|---|---|
| A | 6184 | 17 | 0.274903% |
| B | 6183 | 46 | 0.743975% |
| C | 6183 | 129 | 2.086366% |
| D | 6183 | 110 | 1.779072% |
Noise dominated data is calculated using 1-second bins in cleaned event files. If a bin has >2000 counts, and if more than 50% of those come from <1% of pixels, then it is considered to be noise-dominated and hence unusable.
| Quadrant | # 1 sec bins | Bins with >0 counts | Bins with >2000 counts | High rate bins dominated by noise | Noise dominated (total time) | Noise dominated (detector-on time) | Marked lightcurve |
|---|---|---|---|---|---|---|---|
| A | 7559 | 6185 | 0 | 0 | 0.00% | 0.00% | 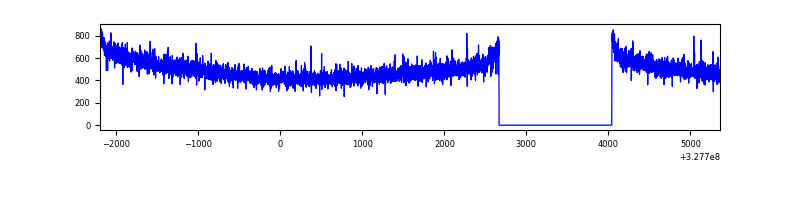 |
| B | 7558 | 6184 | 5 | 5 | 0.07% | 0.08% | 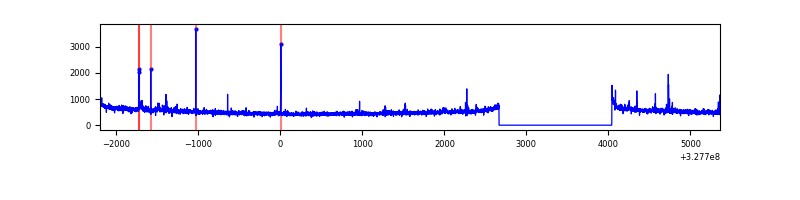 |
| C | 7558 | 6184 | 2 | 2 | 0.03% | 0.03% | 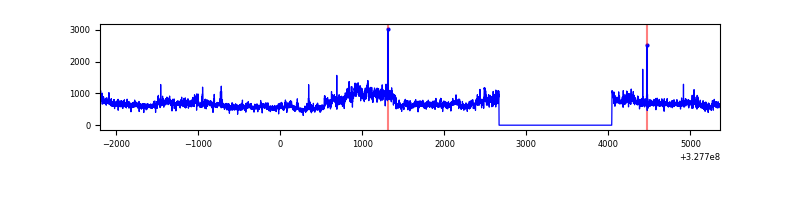 |
| D | 7558 | 6183 | 28 | 28 | 0.37% | 0.45% | 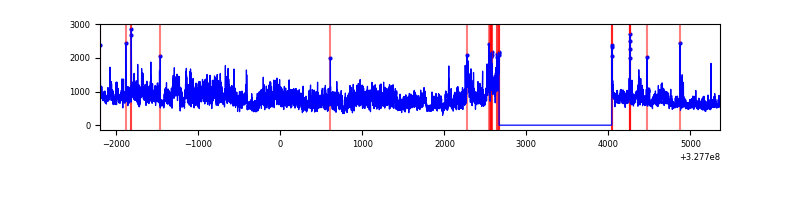 |
Top three noisy pixels from each quadrant. If the there are fewer than three noisy pixels in the level2.evt file, extra rows are filled as -1
| Pixel properties | Quadrant properties | ||||||
|---|---|---|---|---|---|---|---|
| Quadrant | DetID | PixID | Counts | Sigma | Mean | Median | Sigma |
| A | 13 | 254 | 10927 | 65.13 | 792 | 778 | 155.8 |
| A | 0 | 226 | 6894 | 39.25 | 792 | 778 | 155.8 |
| A | 3 | 137 | 6607 | 37.41 | 792 | 778 | 155.8 |
| B | 0 | 189 | 29104 | 191.81 | 804 | 784 | 147.6 |
| B | 10 | 251 | 25154 | 165.05 | 804 | 784 | 147.6 |
| B | 12 | 111 | 16656 | 107.5 | 804 | 784 | 147.6 |
| C | 7 | 247 | 1066326 | 5931.85 | 785 | 794 | 179.6 |
| C | 14 | 238 | 126953 | 702.33 | 785 | 794 | 179.6 |
| C | 3 | 233 | 36942 | 201.24 | 785 | 794 | 179.6 |
| D | 8 | 195 | 1575498 | 8462.13 | 779 | 756 | 186.1 |
| D | 1 | 52 | 241995 | 1296.34 | 779 | 756 | 186.1 |
| D | 7 | 223 | 78136 | 415.81 | 779 | 756 | 186.1 |
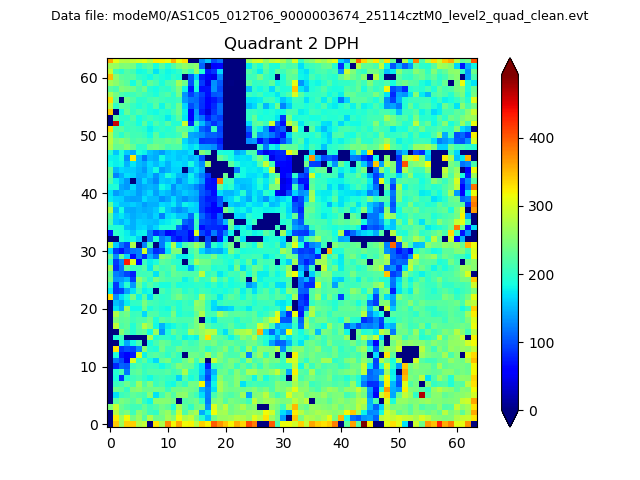
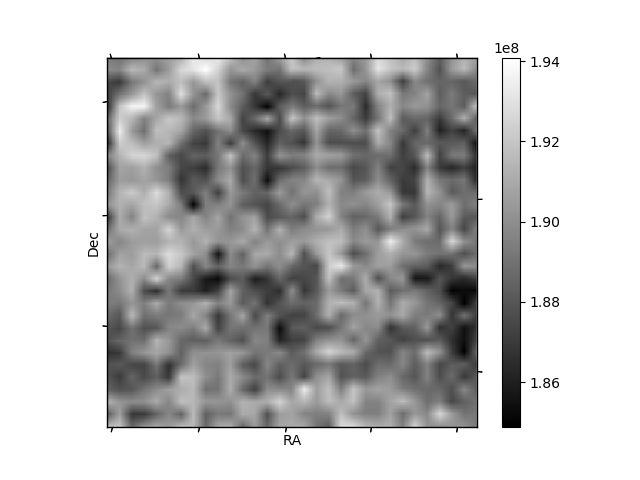
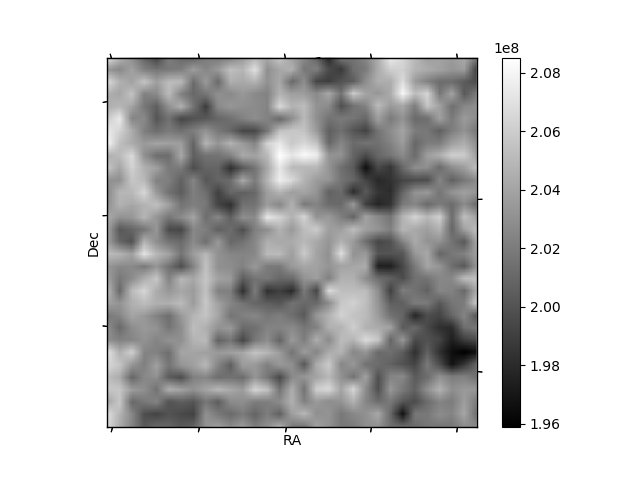
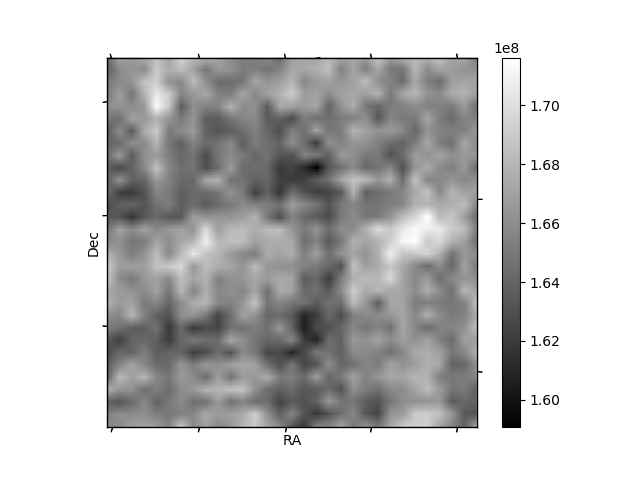
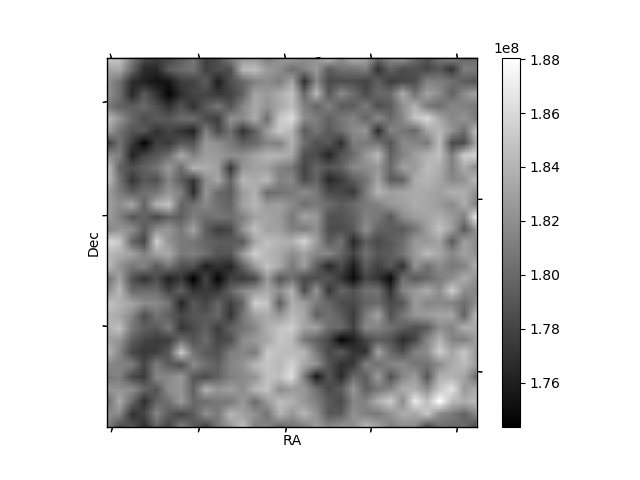
Histogram calculated using DETX and DETY for each event in the final _common_clean file
| Quadrant A |  |
 |
Quadrant B |
|---|---|---|---|
| Quadrant D | 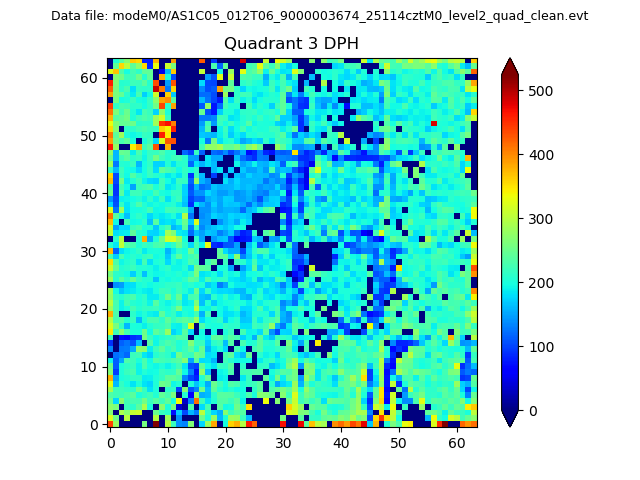 |
 |
Quadrant C |
| Plot type | Count rate plots | Images |
|---|---|---|
| Comparison with Poisson distribution Blue bars denote a histogram of data divided into 1 sec bins. Red curve is a Poisson curve with rate = median count rate of data. |
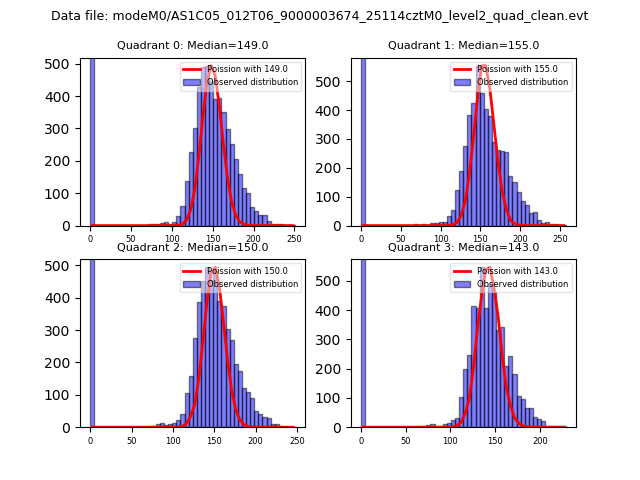 |
 |
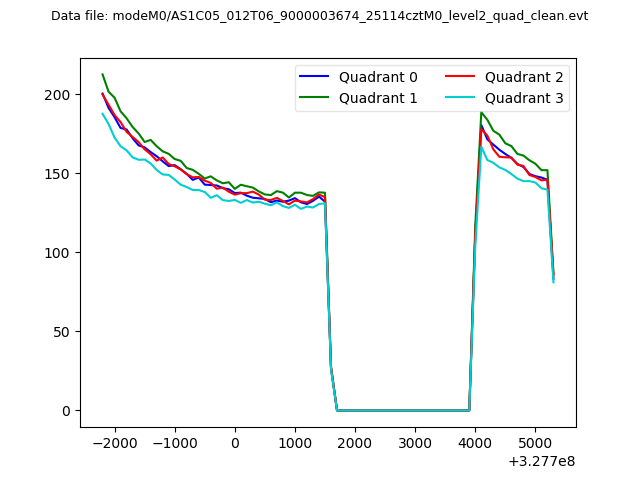
| Quadrant-wise count rates Data is divided into 100 sec bins |
 |
|
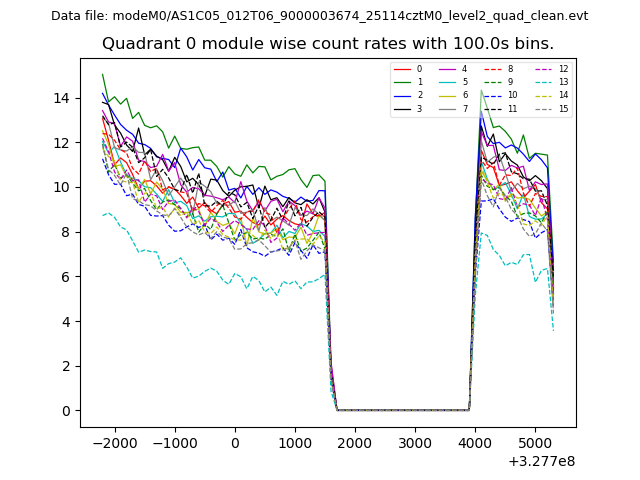
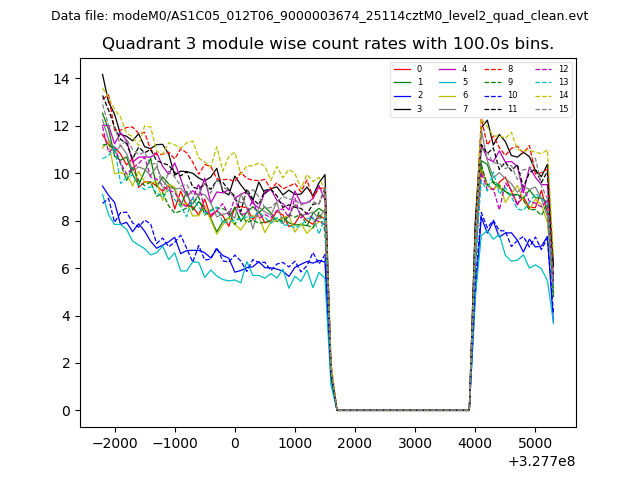
| Module-wise count rates for Quadrant A Data is divided into 100 sec bins |
 |
 |
| Module-wise count rates for Quadrant B Data is divided into 100 sec bins |
 |
 |
| Module-wise count rates for Quadrant C Data is divided into 100 sec bins |
 |
 |
| Module-wise count rates for Quadrant D Data is divided into 100 sec bins |
 |
 |
| Parameter | Plot |
|---|---|
| CZT HV Monitor |  |
| D_VDD | 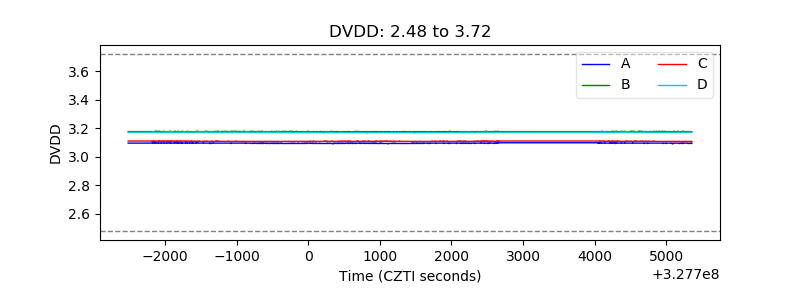 |
| Temperature 1 | 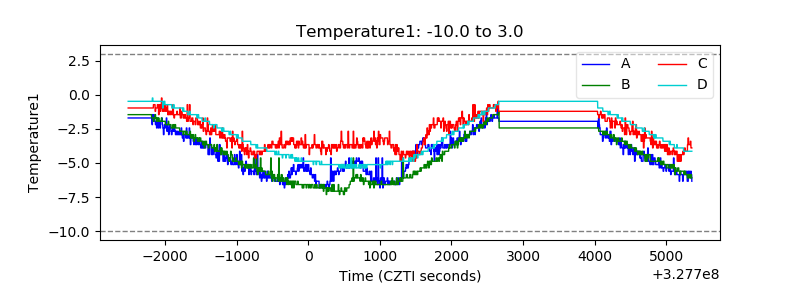 |
| Veto HV Monitor | 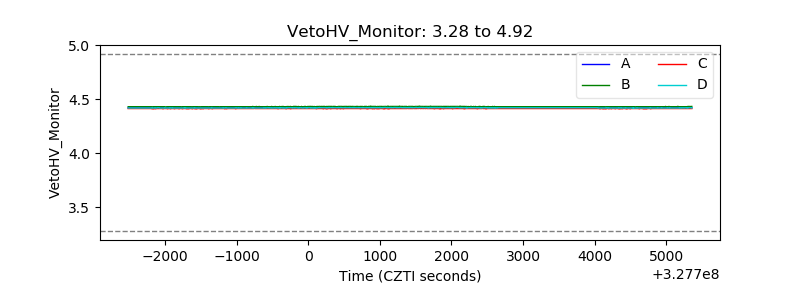 |
| Veto LLD | 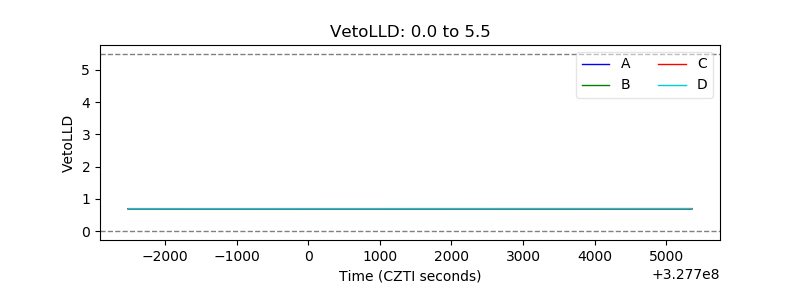 |
| Alpha Counter |  |
| _CPM_Rate | 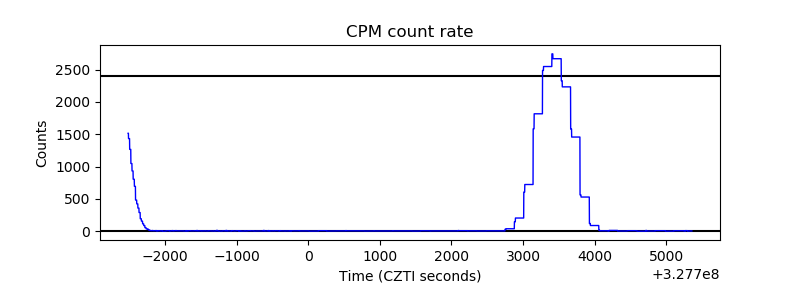 |
| CZT Counter | 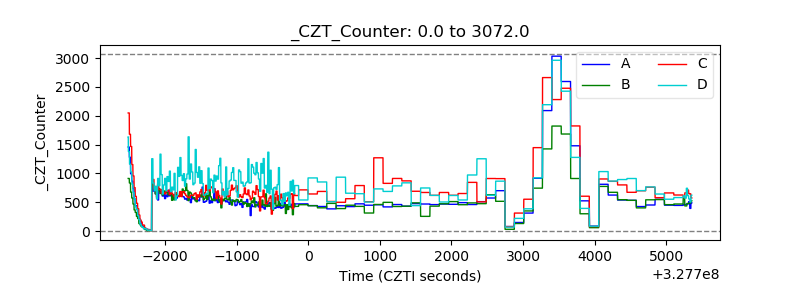 |
| +2.5 Volts monitor |  |
| +5 Volts monitor | 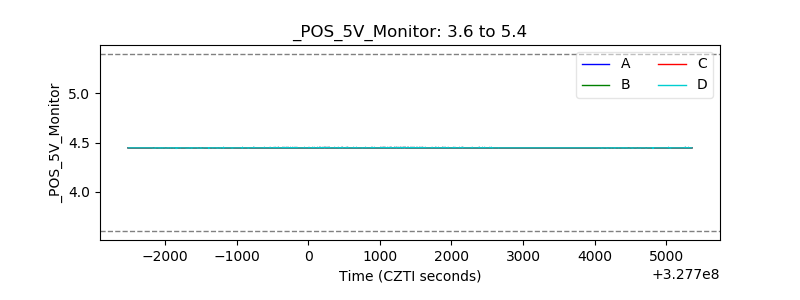 |
| _ROLL_ROT | 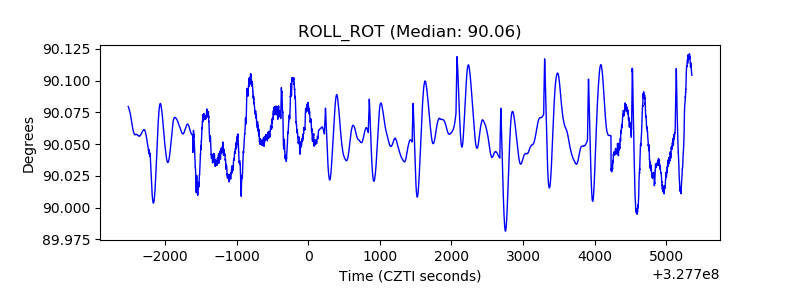 |
| _Roll_DEC | 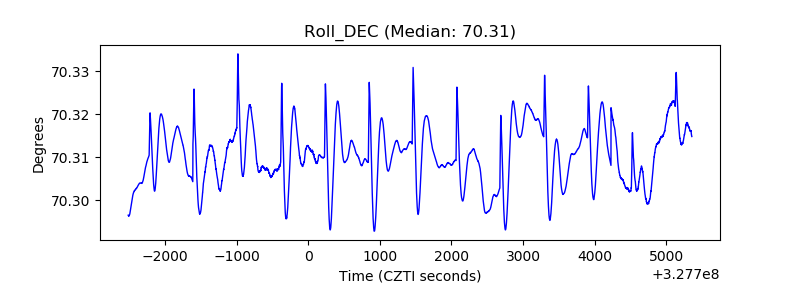 |
| _Roll_RA | 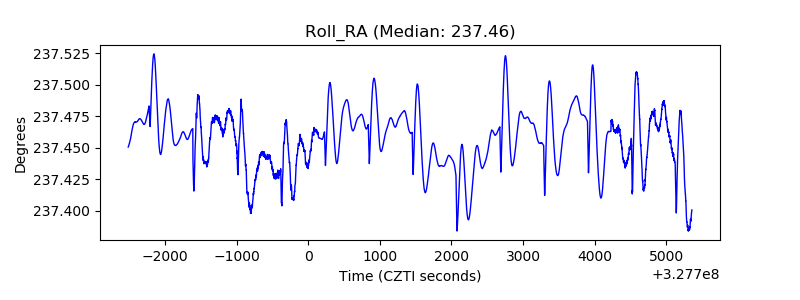 |
| Veto Counter | 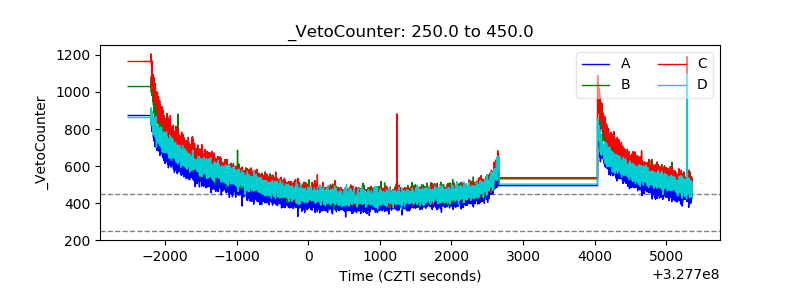 |