| Param | Original file | Final file |
|---|---|---|
| Filename | modeM0/AS1C05_012T06_9000003674_25117cztM0_level2.evt | modeM0/AS1C05_012T06_9000003674_25117cztM0_level2_quad_clean.evt |
| Size (bytes) | 726,713,280 | 106,332,480 |
| Size | 693.0 MB | 101.4 MB |
| Events in quadrant A | 3,188,993 | 753,130 |
| Events in quadrant B | 3,321,597 | 767,879 |
| Events in quadrant C | 4,247,648 | 733,134 |
| Events in quadrant D | 10,773,570 | 474,295 |
| Mode M9 | |||
|---|---|---|---|
| Quadrant | BADHDUFLAG | Total packets | Discarded packets |
| A | 0 | 16 | 0 |
| B | 0 | 16 | 0 |
| C | 0 | 16 | 0 |
| D | 0 | 16 | 0 |
| Mode M0 | |||
|---|---|---|---|
| Quadrant | BADHDUFLAG | Total packets | Discarded packets |
| A | 0 | 14400 | 0 |
| B | 0 | 14618 | 0 |
| C | 0 | 17471 | 0 |
| D | 0 | 36834 | 0 |
| Quadrant | Total seconds | Saturated seconds | Saturation percentage |
|---|---|---|---|
| A | 7049 | 16 | 0.226983% |
| B | 7049 | 54 | 0.766066% |
| C | 7049 | 109 | 1.546319% |
| D | 7049 | 2822 | 40.034047% |
Noise dominated data is calculated using 1-second bins in cleaned event files. If a bin has >2000 counts, and if more than 50% of those come from <1% of pixels, then it is considered to be noise-dominated and hence unusable.
| Quadrant | # 1 sec bins | Bins with >0 counts | Bins with >2000 counts | High rate bins dominated by noise | Noise dominated (total time) | Noise dominated (detector-on time) | Marked lightcurve |
|---|---|---|---|---|---|---|---|
| A | 8679 | 7051 | 0 | 0 | 0.00% | 0.00% |  |
| B | 8679 | 7051 | 3 | 3 | 0.03% | 0.04% | 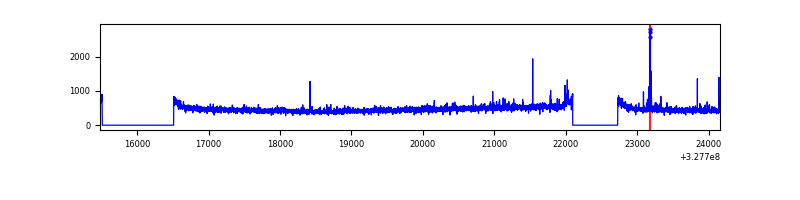 |
| C | 8679 | 7051 | 0 | 0 | 0.00% | 0.00% | 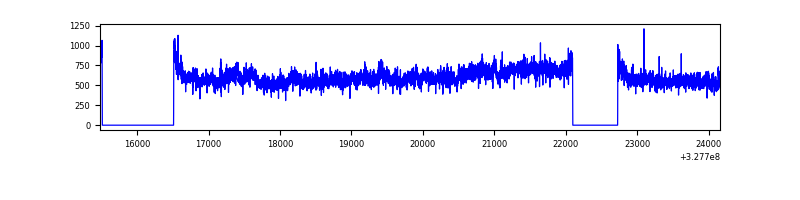 |
| D | 8679 | 7050 | 2731 | 2731 | 31.47% | 38.74% | 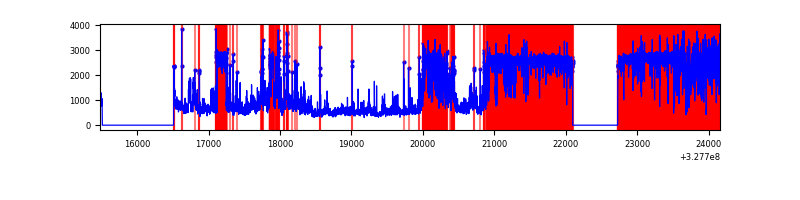 |
Top three noisy pixels from each quadrant. If the there are fewer than three noisy pixels in the level2.evt file, extra rows are filled as -1
| Pixel properties | Quadrant properties | ||||||
|---|---|---|---|---|---|---|---|
| Quadrant | DetID | PixID | Counts | Sigma | Mean | Median | Sigma |
| A | 13 | 254 | 11965 | 67.19 | 826 | 808 | 166.0 |
| A | 3 | 137 | 7481 | 40.19 | 826 | 808 | 166.0 |
| A | 0 | 226 | 6955 | 37.02 | 826 | 808 | 166.0 |
| B | 0 | 230 | 33392 | 206.81 | 831 | 811 | 157.5 |
| B | 0 | 190 | 27215 | 167.6 | 831 | 811 | 157.5 |
| B | 12 | 111 | 18964 | 115.23 | 831 | 811 | 157.5 |
| C | 7 | 247 | 970389 | 5161.04 | 801 | 803 | 187.9 |
| C | 14 | 238 | 128068 | 677.42 | 801 | 803 | 187.9 |
| C | 3 | 233 | 21476 | 110.04 | 801 | 803 | 187.9 |
| D | 12 | 235 | 7297238 | 51495.85 | 585 | 569 | 141.7 |
| D | 8 | 195 | 651106 | 4591.13 | 585 | 569 | 141.7 |
| D | 1 | 52 | 430695 | 3035.59 | 585 | 569 | 141.7 |
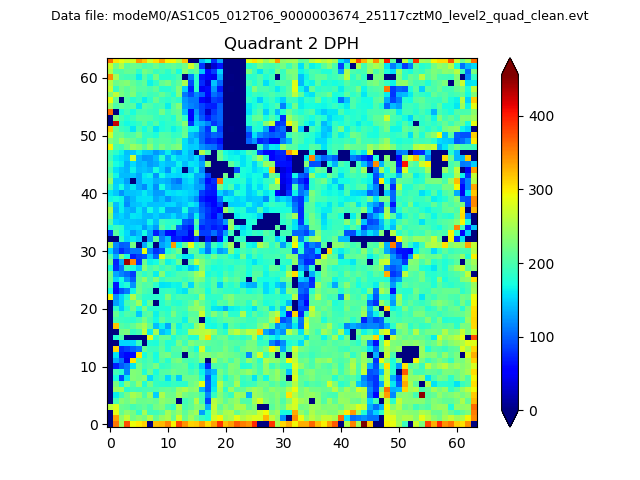
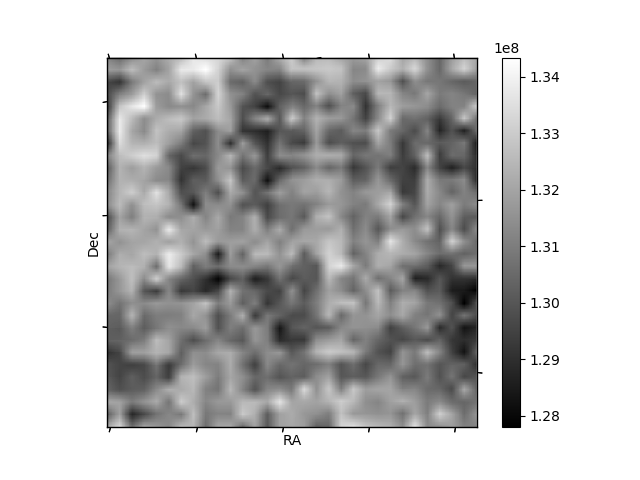
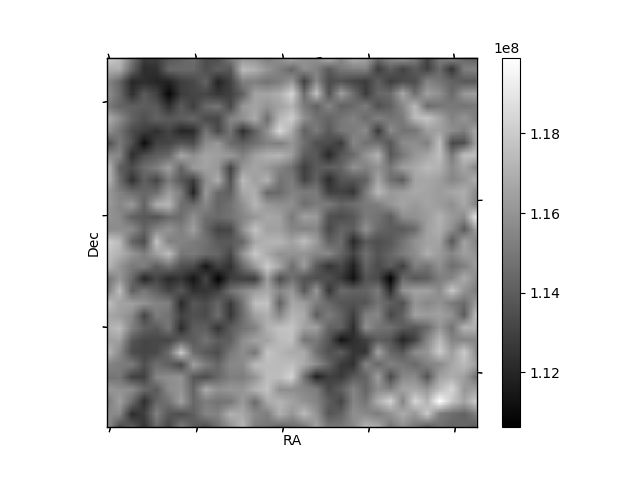
Histogram calculated using DETX and DETY for each event in the final _common_clean file
| Quadrant A | 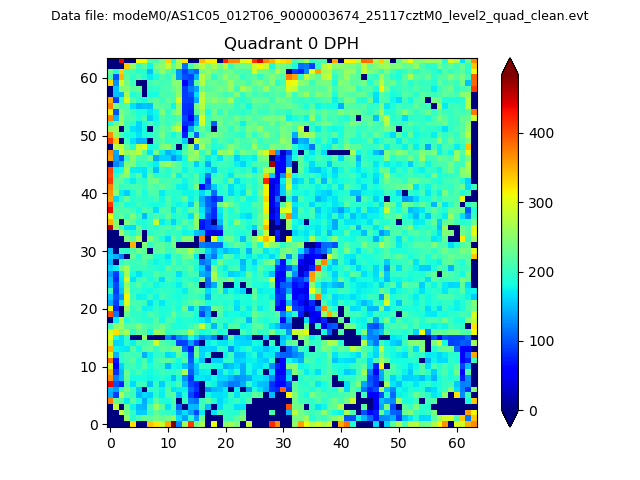 |
 |
Quadrant B |
|---|---|---|---|
| Quadrant D | 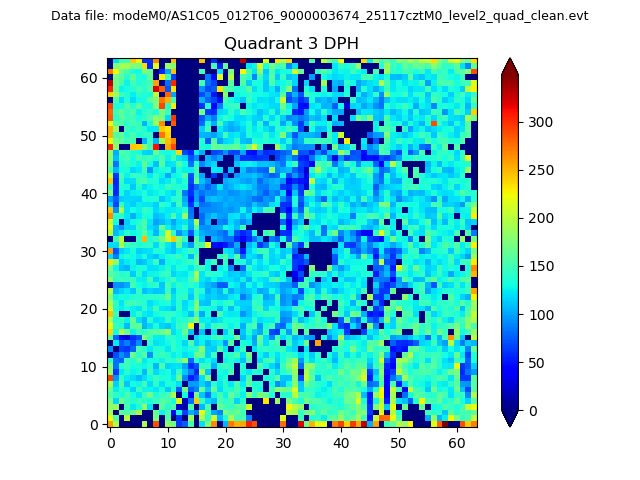 |
 |
Quadrant C |
| Plot type | Count rate plots | Images |
|---|---|---|
| Comparison with Poisson distribution Blue bars denote a histogram of data divided into 1 sec bins. Red curve is a Poisson curve with rate = median count rate of data. |
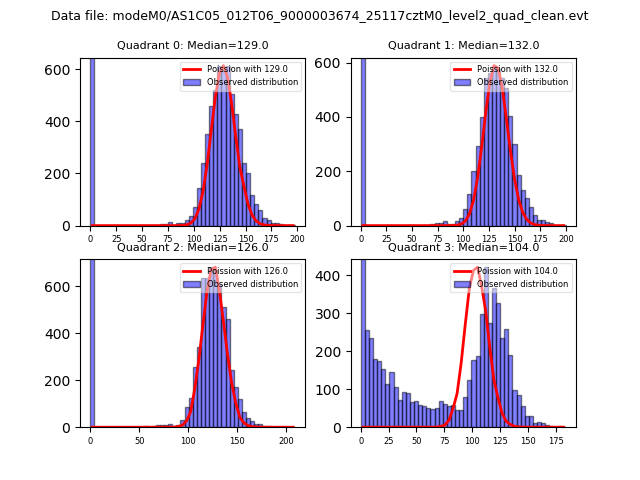 |
 |
| Quadrant-wise count rates Data is divided into 100 sec bins |
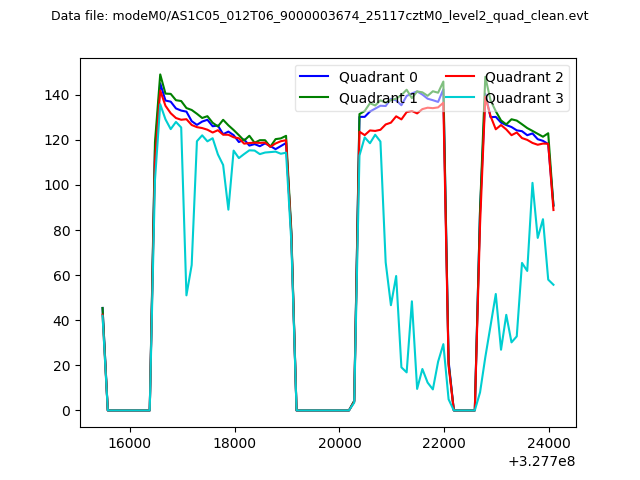 |
|
| Module-wise count rates for Quadrant A Data is divided into 100 sec bins |
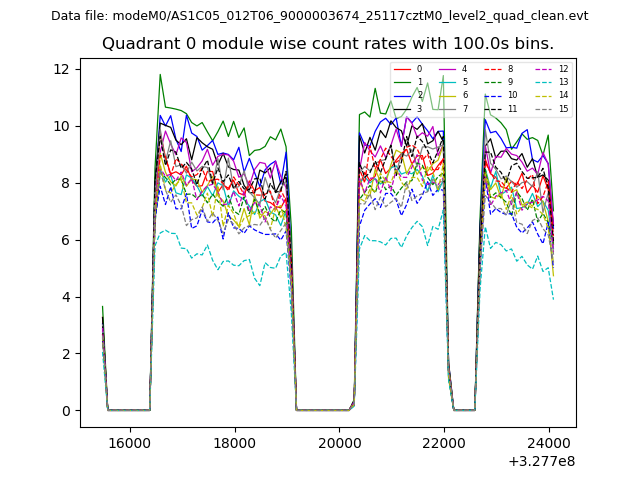 |
 |
| Module-wise count rates for Quadrant B Data is divided into 100 sec bins |
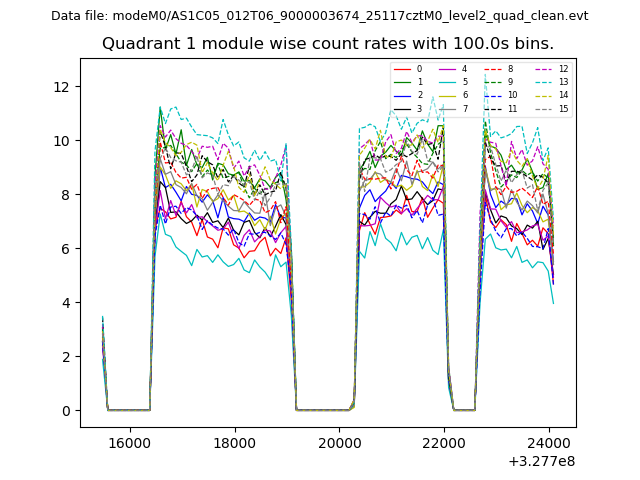 |
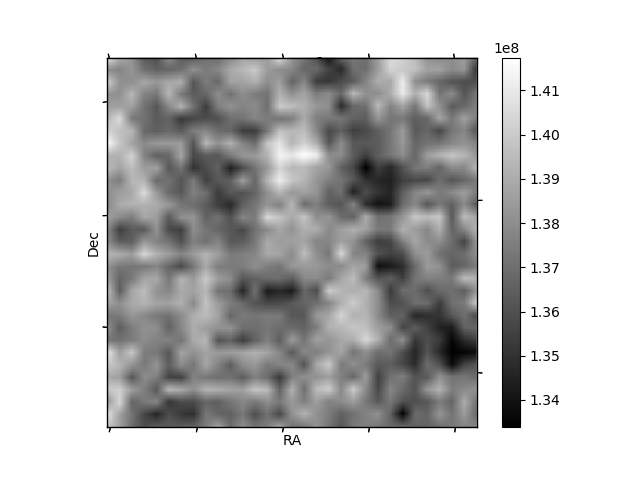 |
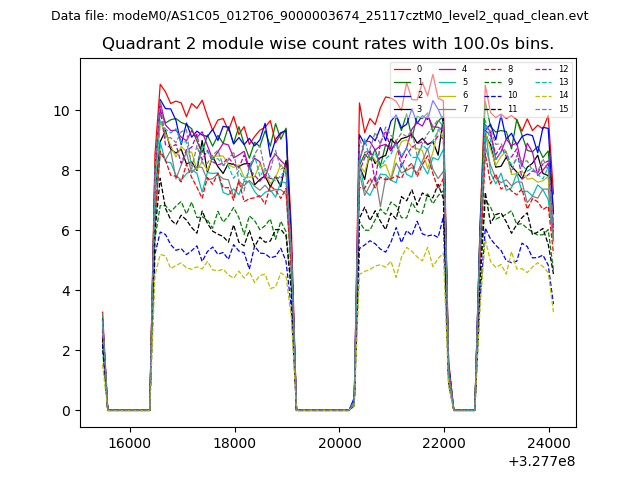
| Module-wise count rates for Quadrant C Data is divided into 100 sec bins |
 |
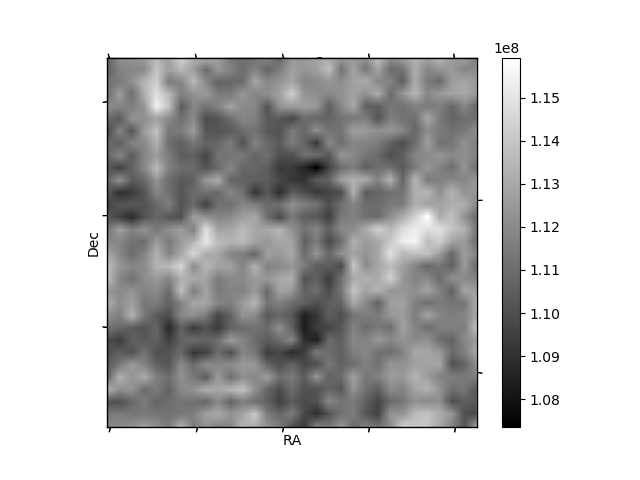 |
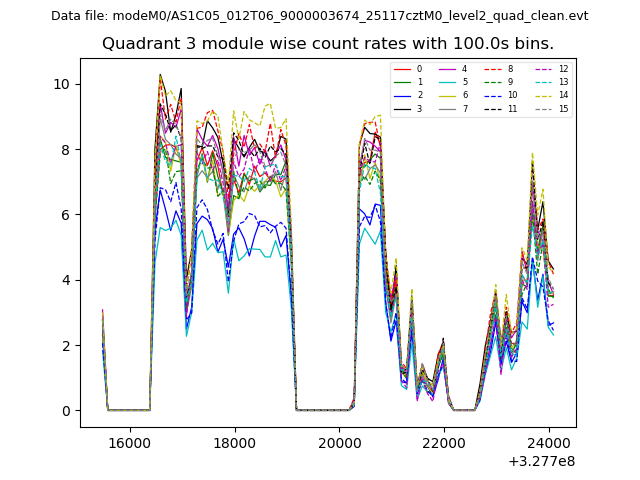
| Module-wise count rates for Quadrant D Data is divided into 100 sec bins |
 |
 |
| Parameter | Plot |
|---|---|
| CZT HV Monitor | 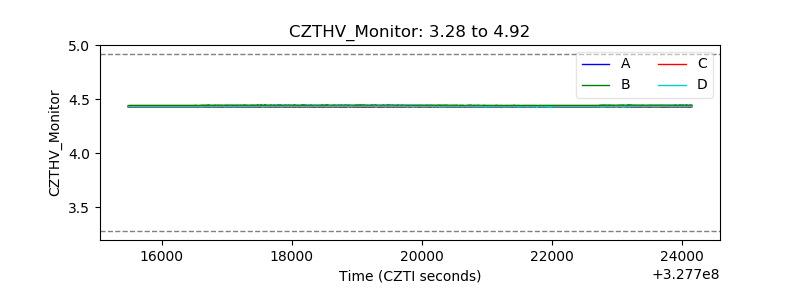 |
| D_VDD | 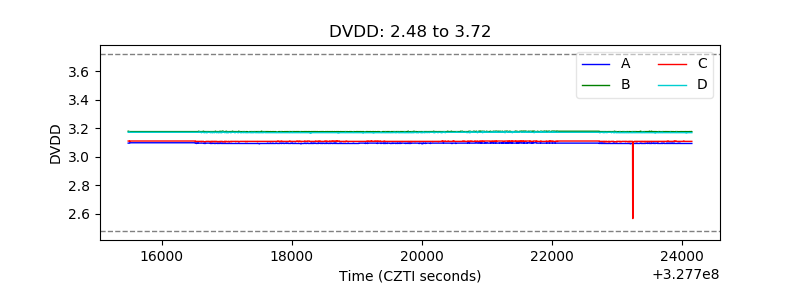 |
| Temperature 1 |  |
| Veto HV Monitor | 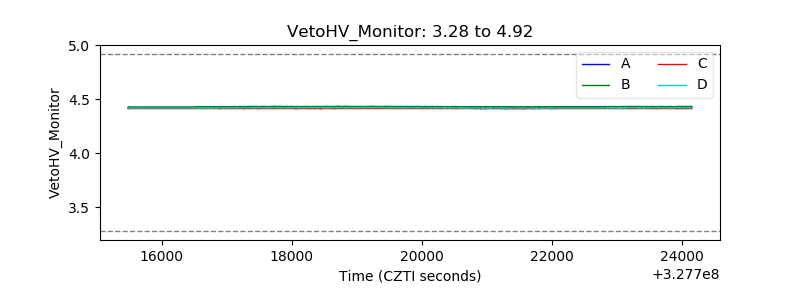 |
| Veto LLD |  |
| Alpha Counter | 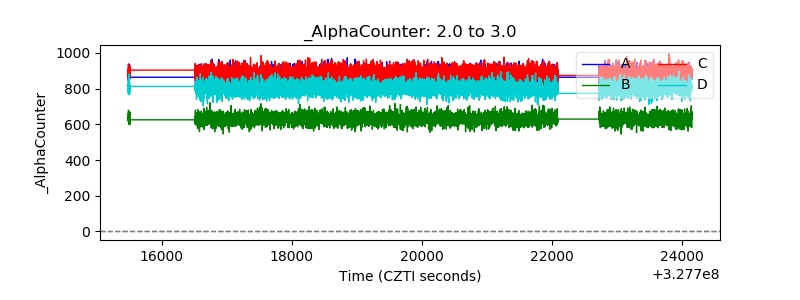 |
| _CPM_Rate | 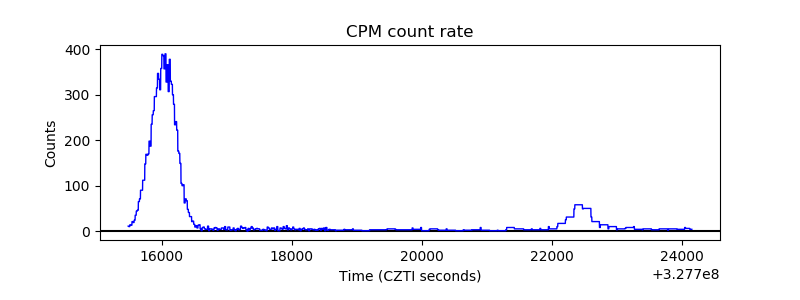 |
| CZT Counter | 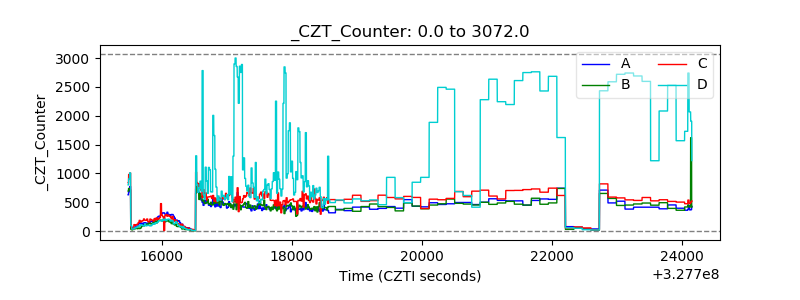 |
| +2.5 Volts monitor | 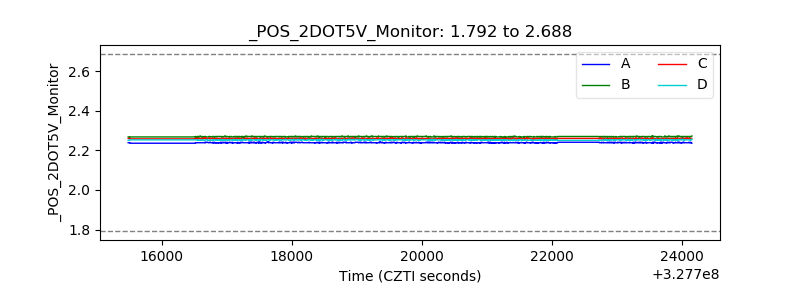 |
| +5 Volts monitor |  |
| _ROLL_ROT | 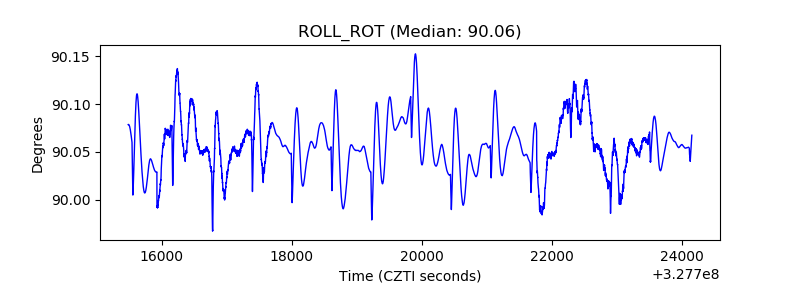 |
| _Roll_DEC | 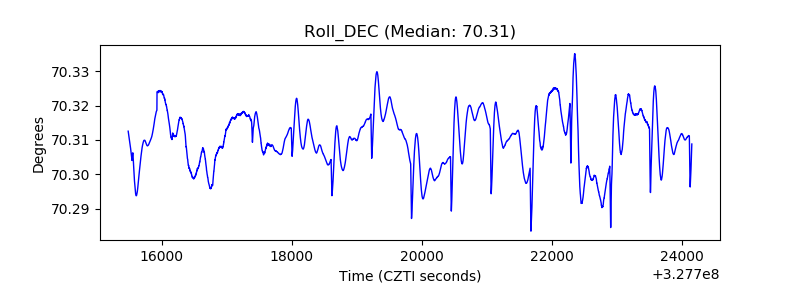 |
| _Roll_RA |  |
| Veto Counter | 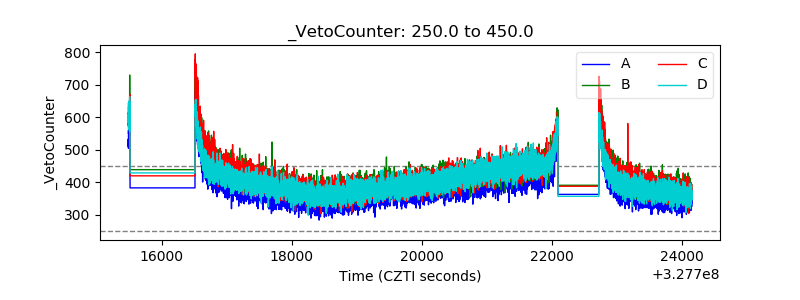 |