| Param | Original file | Final file |
|---|---|---|
| Filename | modeM0/AS1C05_012T06_9000003674_25118cztM0_level2.evt | modeM0/AS1C05_012T06_9000003674_25118cztM0_level2_quad_clean.evt |
| Size (bytes) | 867,700,800 | 104,592,960 |
| Size | 827.5 MB | 99.7 MB |
| Events in quadrant A | 3,255,128 | 758,130 |
| Events in quadrant B | 3,385,403 | 773,794 |
| Events in quadrant C | 4,365,421 | 738,037 |
| Events in quadrant D | 14,781,922 | 390,595 |
| Mode M9 | |||
|---|---|---|---|
| Quadrant | BADHDUFLAG | Total packets | Discarded packets |
| A | 0 | 3 | 0 |
| B | 0 | 3 | 0 |
| C | 0 | 3 | 0 |
| D | 0 | 3 | 0 |
| Mode M0 | |||
|---|---|---|---|
| Quadrant | BADHDUFLAG | Total packets | Discarded packets |
| A | 0 | 14754 | 0 |
| B | 0 | 14972 | 0 |
| C | 0 | 17791 | 0 |
| D | 0 | 48846 | 0 |
| Quadrant | Total seconds | Saturated seconds | Saturation percentage |
|---|---|---|---|
| A | 7257 | 68 | 0.937026% |
| B | 7258 | 109 | 1.501791% |
| C | 7258 | 163 | 2.245798% |
| D | 7258 | 4476 | 61.669882% |
Noise dominated data is calculated using 1-second bins in cleaned event files. If a bin has >2000 counts, and if more than 50% of those come from <1% of pixels, then it is considered to be noise-dominated and hence unusable.
| Quadrant | # 1 sec bins | Bins with >0 counts | Bins with >2000 counts | High rate bins dominated by noise | Noise dominated (total time) | Noise dominated (detector-on time) | Marked lightcurve |
|---|---|---|---|---|---|---|---|
| A | 7502 | 7259 | 1 | 1 | 0.01% | 0.01% | 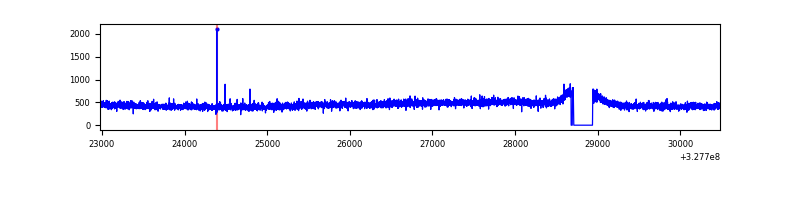 |
| B | 7503 | 7260 | 4 | 4 | 0.05% | 0.06% | 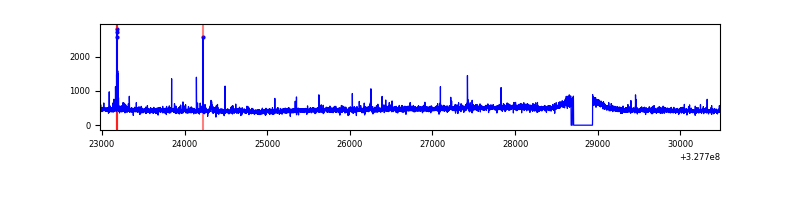 |
| C | 7503 | 7260 | 0 | 0 | 0.00% | 0.00% | 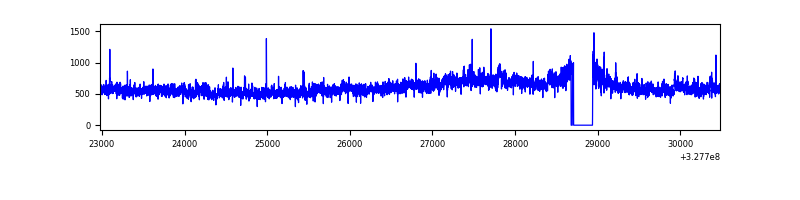 |
| D | 7503 | 7258 | 4464 | 4464 | 59.50% | 61.50% | 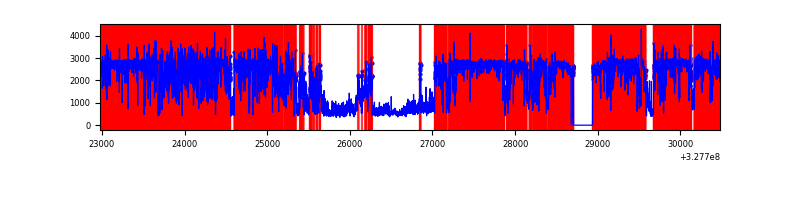 |
Top three noisy pixels from each quadrant. If the there are fewer than three noisy pixels in the level2.evt file, extra rows are filled as -1
| Pixel properties | Quadrant properties | ||||||
|---|---|---|---|---|---|---|---|
| Quadrant | DetID | PixID | Counts | Sigma | Mean | Median | Sigma |
| A | 13 | 254 | 13236 | 72.91 | 842 | 823 | 170.3 |
| A | 3 | 137 | 7722 | 40.52 | 842 | 823 | 170.3 |
| A | 0 | 226 | 7072 | 36.7 | 842 | 823 | 170.3 |
| B | 0 | 230 | 42545 | 259.23 | 845 | 826 | 160.9 |
| B | 12 | 111 | 19925 | 118.67 | 845 | 826 | 160.9 |
| B | 11 | 111 | 17481 | 103.49 | 845 | 826 | 160.9 |
| C | 7 | 247 | 993774 | 5245.51 | 814 | 817 | 189.3 |
| C | 14 | 238 | 131473 | 690.22 | 814 | 817 | 189.3 |
| C | 3 | 233 | 65138 | 339.79 | 814 | 817 | 189.3 |
| D | 12 | 235 | 11737689 | 90759.56 | 530 | 513 | 129.3 |
| D | 8 | 195 | 697564 | 5390.06 | 530 | 513 | 129.3 |
| D | 1 | 52 | 242771 | 1873.3 | 530 | 513 | 129.3 |
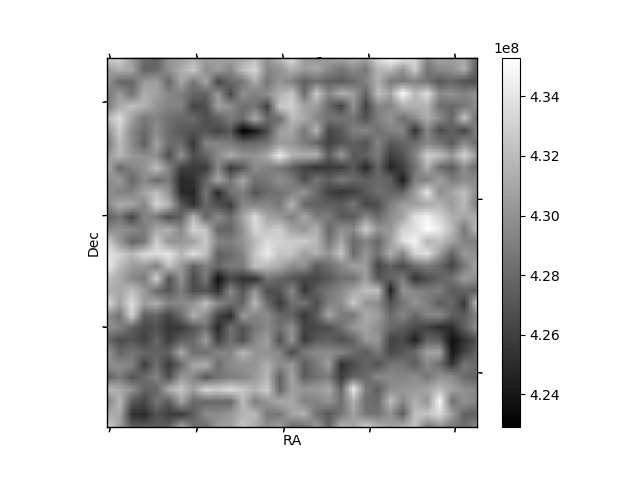
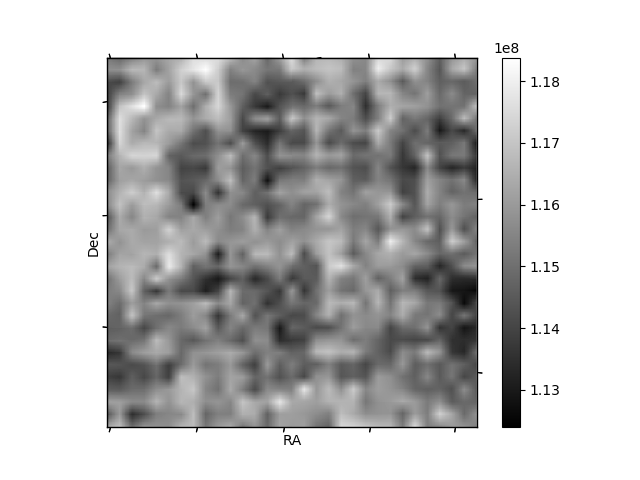
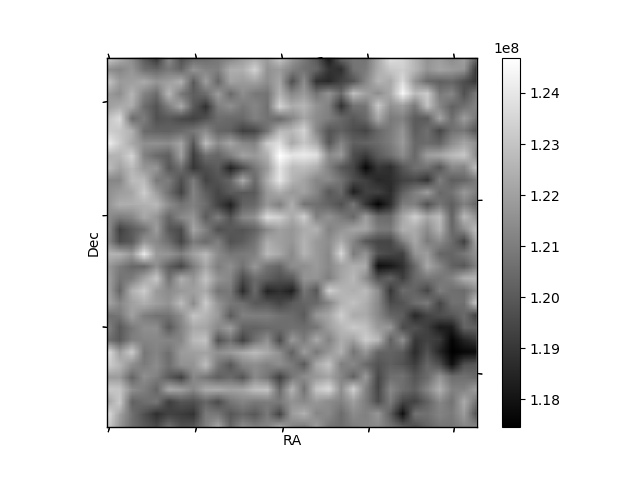
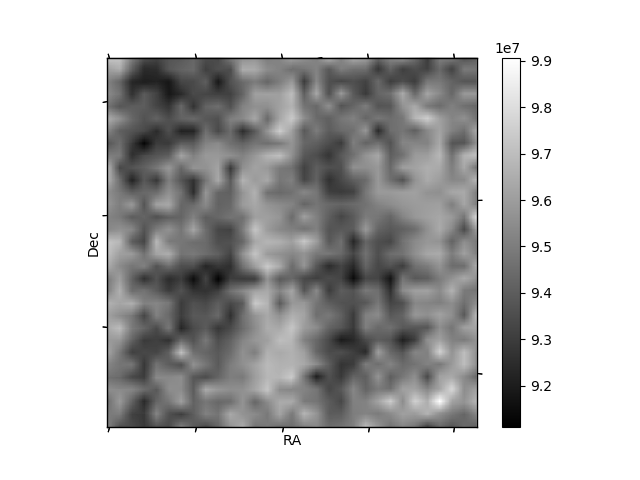
Histogram calculated using DETX and DETY for each event in the final _common_clean file
| Quadrant A | 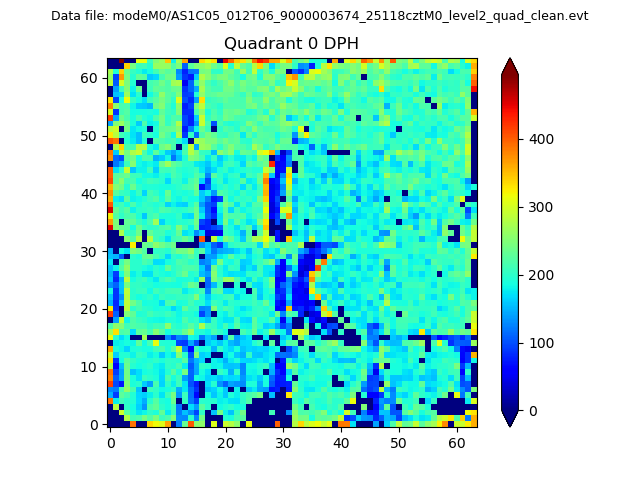 |
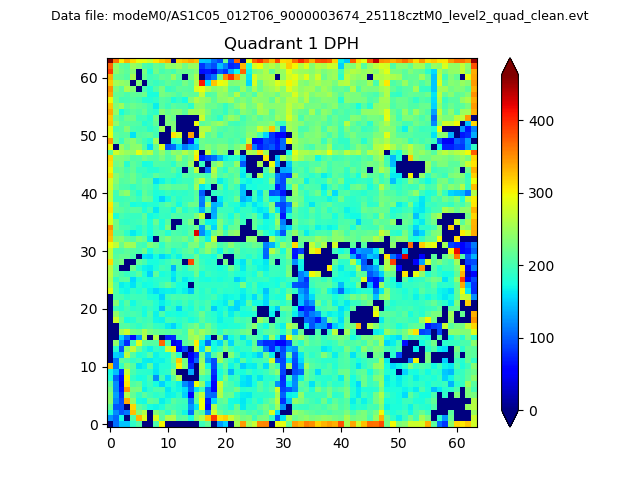 |
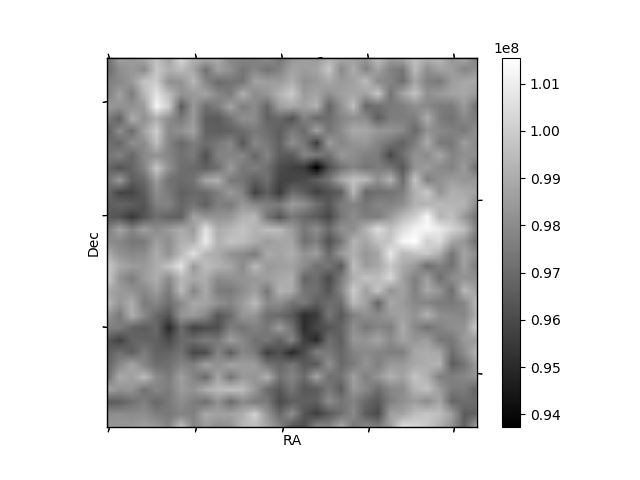
Quadrant B |
|---|---|---|---|
| Quadrant D |  |
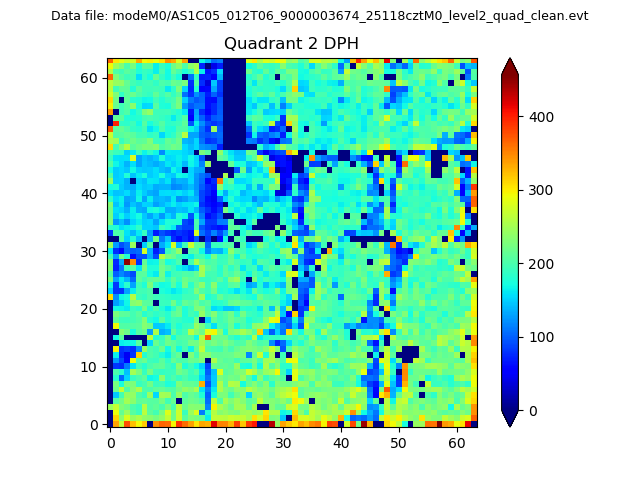 |
Quadrant C |
| Plot type | Count rate plots | Images |
|---|---|---|
| Comparison with Poisson distribution Blue bars denote a histogram of data divided into 1 sec bins. Red curve is a Poisson curve with rate = median count rate of data. |
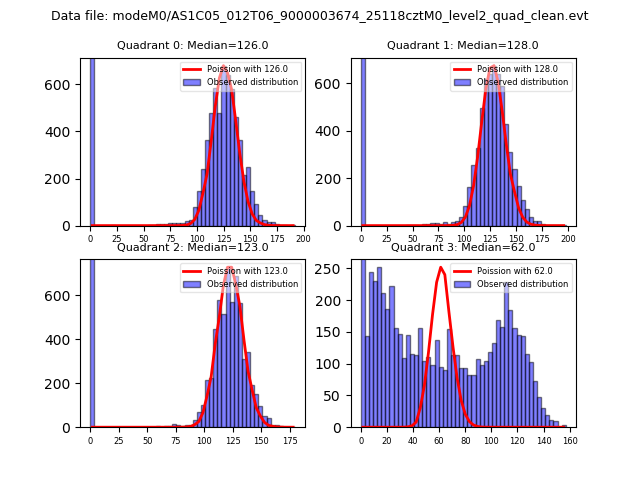 |
 |
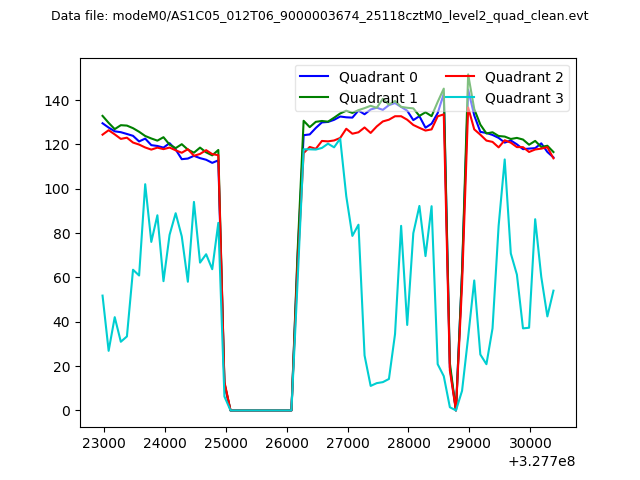
| Quadrant-wise count rates Data is divided into 100 sec bins |
 |
|
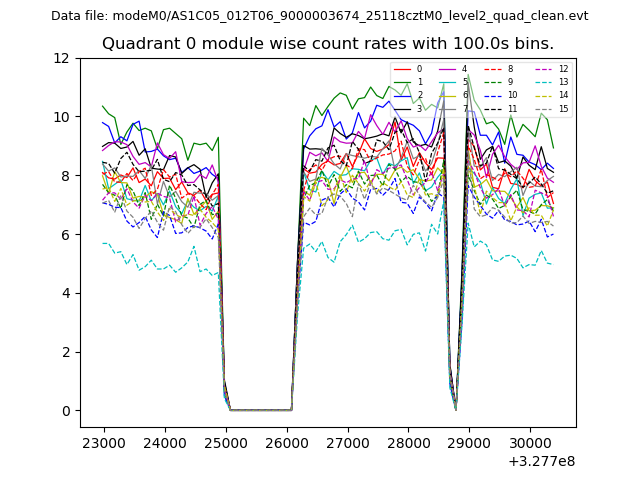
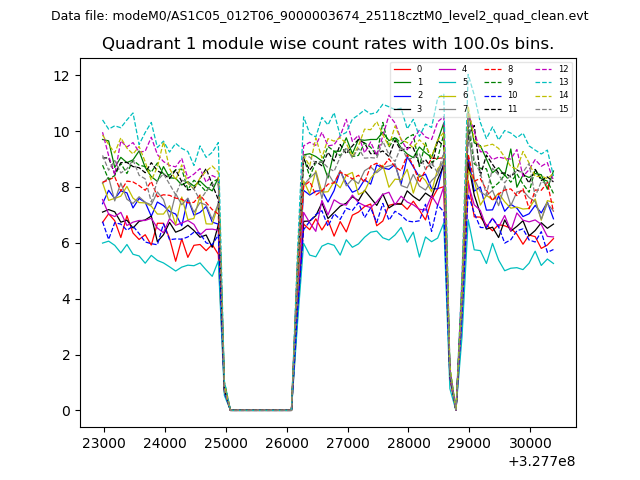
| Module-wise count rates for Quadrant A Data is divided into 100 sec bins |
 |
 |
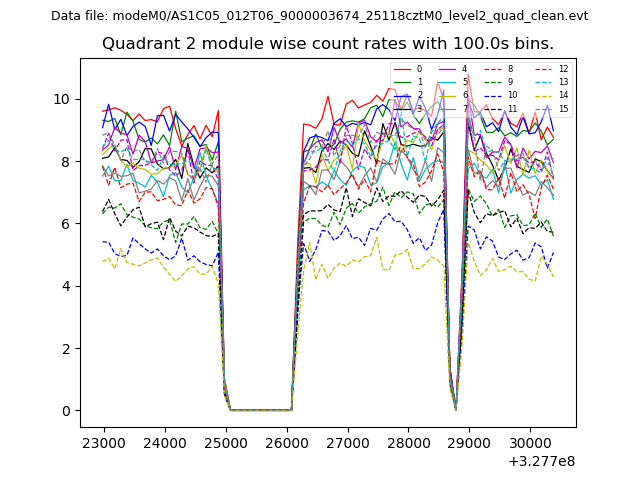
| Module-wise count rates for Quadrant B Data is divided into 100 sec bins |
 |
 |
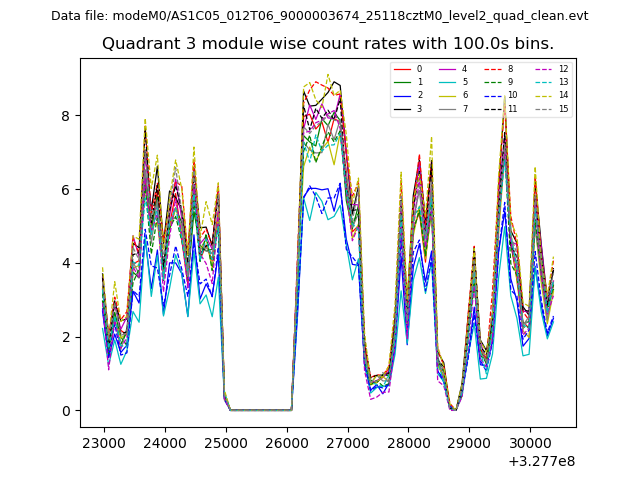
| Module-wise count rates for Quadrant C Data is divided into 100 sec bins |
 |
 |
| Module-wise count rates for Quadrant D Data is divided into 100 sec bins |
 |
 |
| Parameter | Plot |
|---|---|
| CZT HV Monitor | 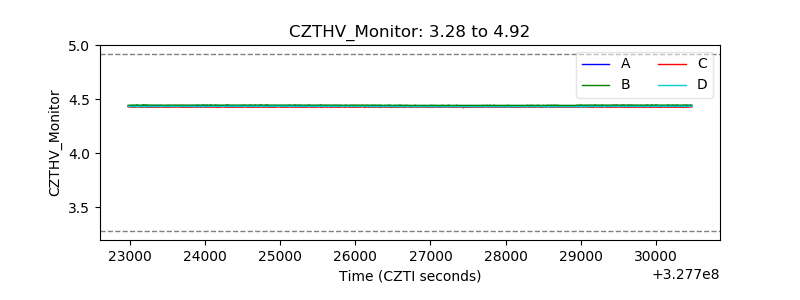 |
| D_VDD | 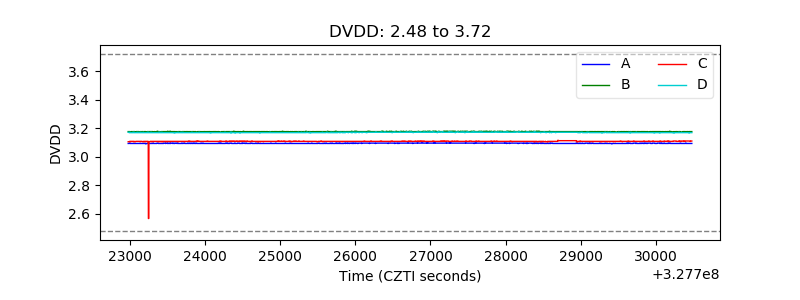 |
| Temperature 1 | 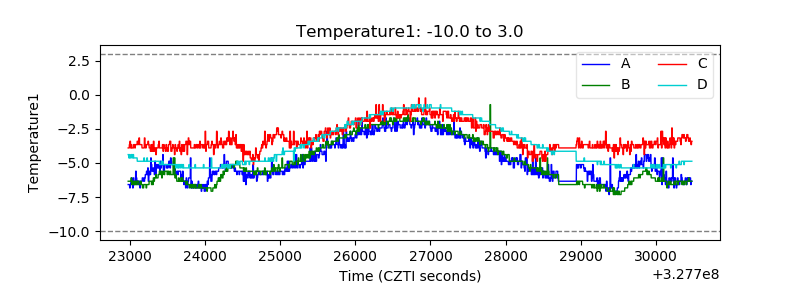 |
| Veto HV Monitor | 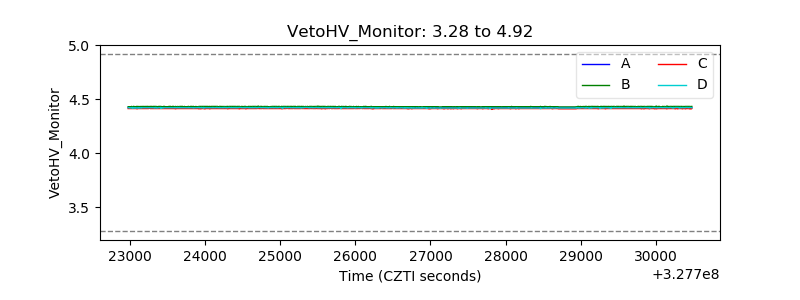 |
| Veto LLD | 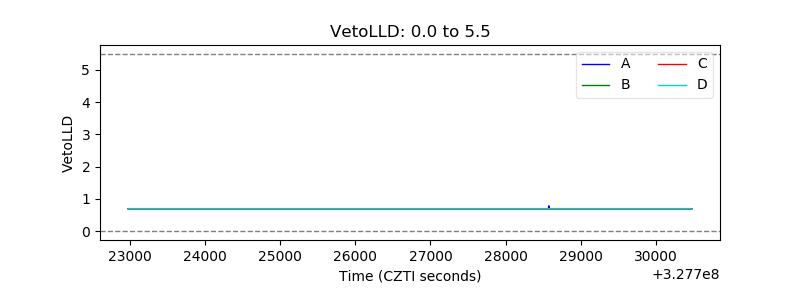 |
| Alpha Counter | 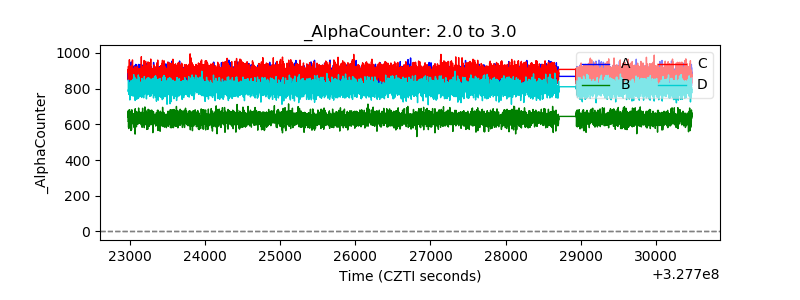 |
| _CPM_Rate | 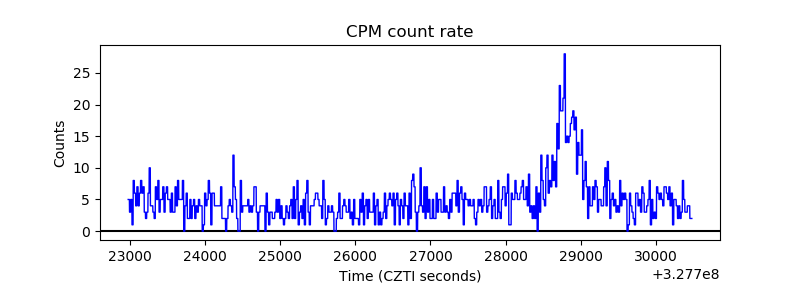 |
| CZT Counter |  |
| +2.5 Volts monitor | 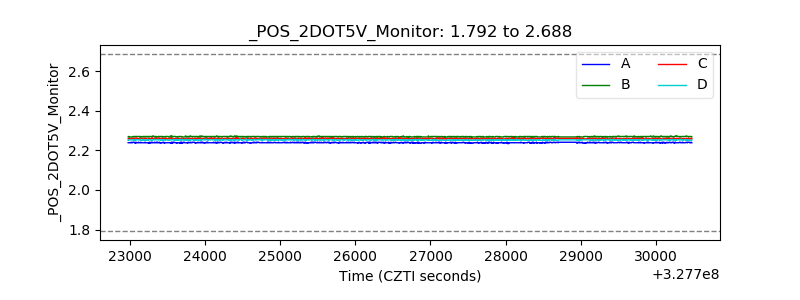 |
| +5 Volts monitor |  |
| _ROLL_ROT | 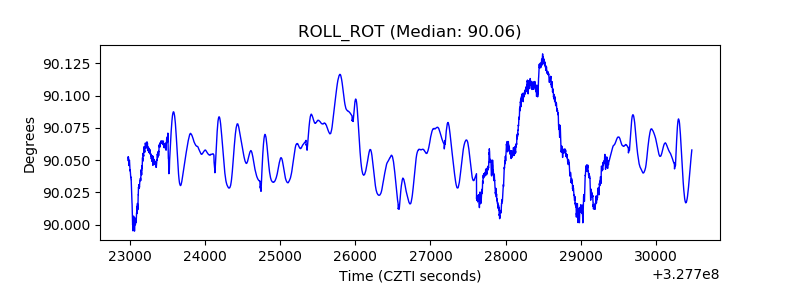 |
| _Roll_DEC |  |
| _Roll_RA | 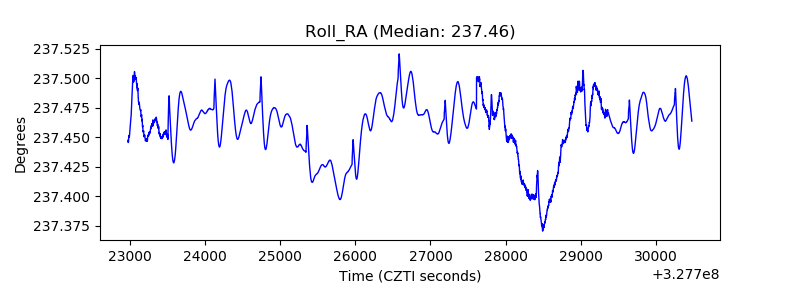 |
| Veto Counter | 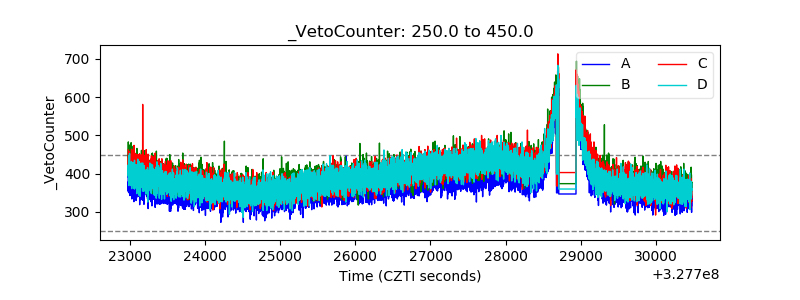 |