| Param | Original file | Final file |
|---|---|---|
| Filename | modeM0/AS1C05_012T06_9000003674_25122cztM0_level2.evt | modeM0/AS1C05_012T06_9000003674_25122cztM0_level2_quad_clean.evt |
| Size (bytes) | 1,924,940,160 | 244,771,200 |
| Size | 1.8 GB | 233.4 MB |
| Events in quadrant A | 8,219,074 | 1,639,082 |
| Events in quadrant B | 8,511,414 | 1,668,038 |
| Events in quadrant C | 11,401,039 | 1,571,123 |
| Events in quadrant D | 28,948,318 | 1,285,469 |
| Mode M9 | |||
|---|---|---|---|
| Quadrant | BADHDUFLAG | Total packets | Discarded packets |
| A | 0 | 19 | 0 |
| B | 0 | 19 | 0 |
| C | 0 | 19 | 0 |
| D | 0 | 19 | 0 |
| Mode M0 | |||
|---|---|---|---|
| Quadrant | BADHDUFLAG | Total packets | Discarded packets |
| A | 0 | 36530 | 0 |
| B | 0 | 37018 | 0 |
| C | 0 | 46999 | 0 |
| D | 0 | 98542 | 0 |
| Quadrant | Total seconds | Saturated seconds | Saturation percentage |
|---|---|---|---|
| A | 18105 | 163 | 0.900304% |
| B | 18106 | 200 | 1.104606% |
| C | 18105 | 317 | 1.750898% |
| D | 18105 | 5715 | 31.565866% |
Noise dominated data is calculated using 1-second bins in cleaned event files. If a bin has >2000 counts, and if more than 50% of those come from <1% of pixels, then it is considered to be noise-dominated and hence unusable.
| Quadrant | # 1 sec bins | Bins with >0 counts | Bins with >2000 counts | High rate bins dominated by noise | Noise dominated (total time) | Noise dominated (detector-on time) | Marked lightcurve |
|---|---|---|---|---|---|---|---|
| A | 20000 | 18106 | 0 | 0 | 0.00% | 0.00% | 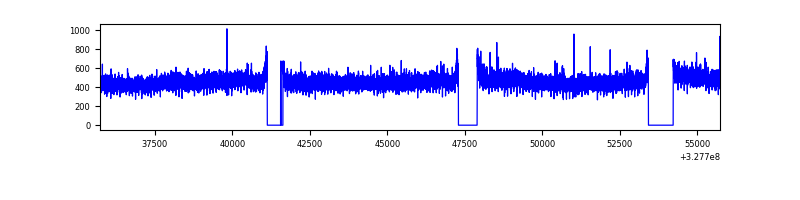 |
| B | 20001 | 18106 | 18 | 18 | 0.09% | 0.10% | 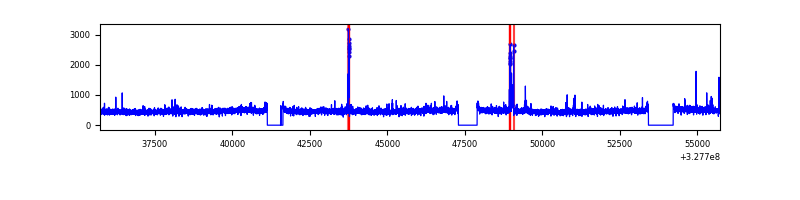 |
| C | 20000 | 18106 | 2 | 2 | 0.01% | 0.01% | 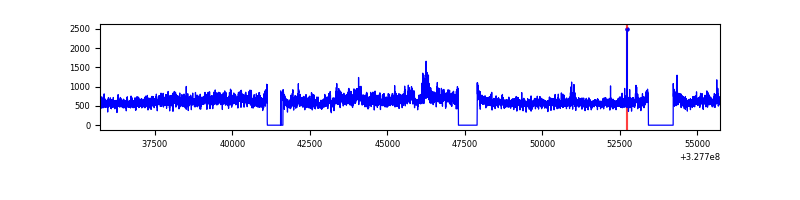 |
| D | 20000 | 18105 | 5468 | 5468 | 27.34% | 30.20% | 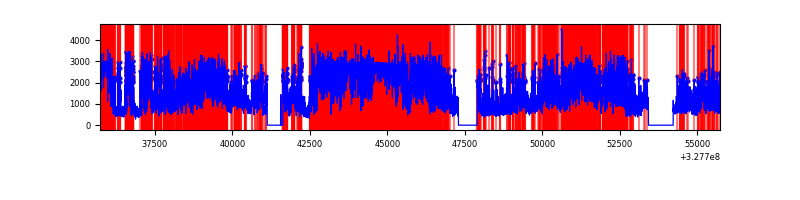 |
Top three noisy pixels from each quadrant. If the there are fewer than three noisy pixels in the level2.evt file, extra rows are filled as -1
| Pixel properties | Quadrant properties | ||||||
|---|---|---|---|---|---|---|---|
| Quadrant | DetID | PixID | Counts | Sigma | Mean | Median | Sigma |
| A | 13 | 254 | 28340 | 61.43 | 2128 | 2076 | 427.5 |
| A | 3 | 137 | 19916 | 41.73 | 2128 | 2076 | 427.5 |
| A | 0 | 226 | 18265 | 37.87 | 2128 | 2076 | 427.5 |
| B | 3 | 64 | 112377 | 276.22 | 2123 | 2071 | 399.3 |
| B | 0 | 190 | 51305 | 123.29 | 2123 | 2071 | 399.3 |
| B | 12 | 111 | 50210 | 120.55 | 2123 | 2071 | 399.3 |
| C | 7 | 247 | 3021423 | 6371.57 | 2035 | 2046 | 473.9 |
| C | 14 | 238 | 324742 | 680.96 | 2035 | 2046 | 473.9 |
| C | 7 | 87 | 46141 | 93.05 | 2035 | 2046 | 473.9 |
| D | 12 | 235 | 11054443 | 25051.82 | 1818 | 1764 | 441.2 |
| D | 8 | 195 | 5732933 | 12990.17 | 1818 | 1764 | 441.2 |
| D | 12 | 33 | 3104912 | 7033.55 | 1818 | 1764 | 441.2 |
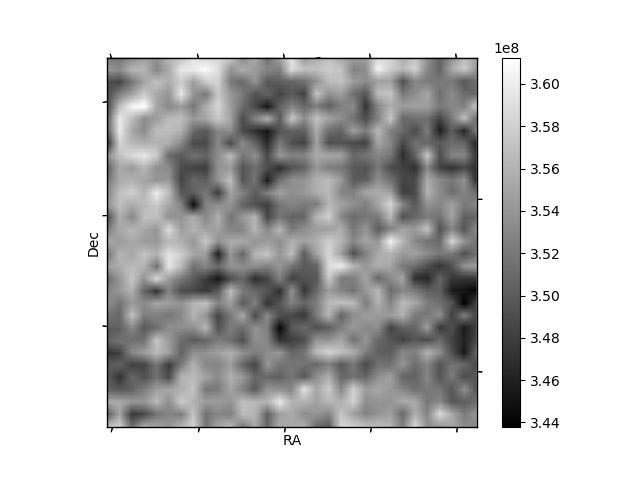
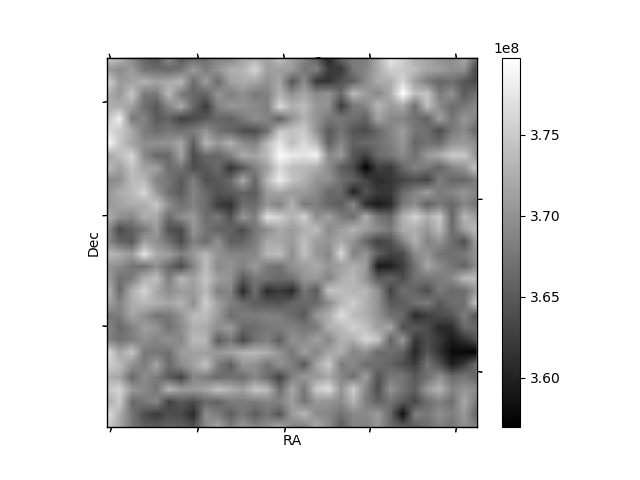
Histogram calculated using DETX and DETY for each event in the final _common_clean file
| Quadrant A |  |
 |
Quadrant B |
|---|---|---|---|
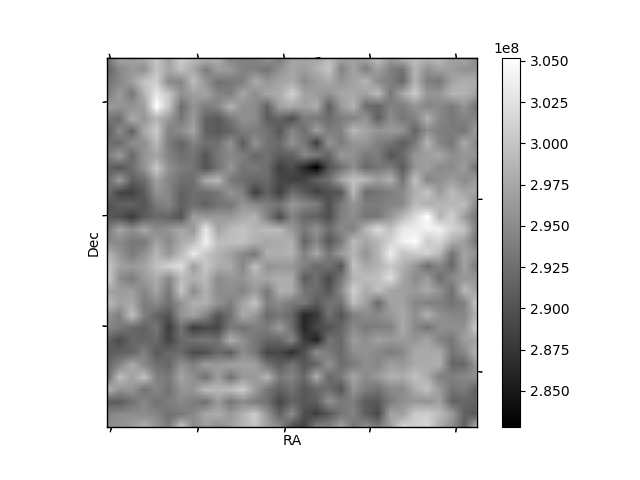
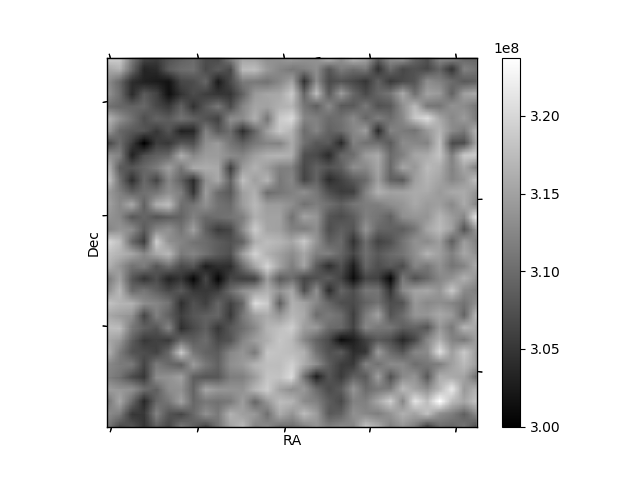
| Quadrant D | 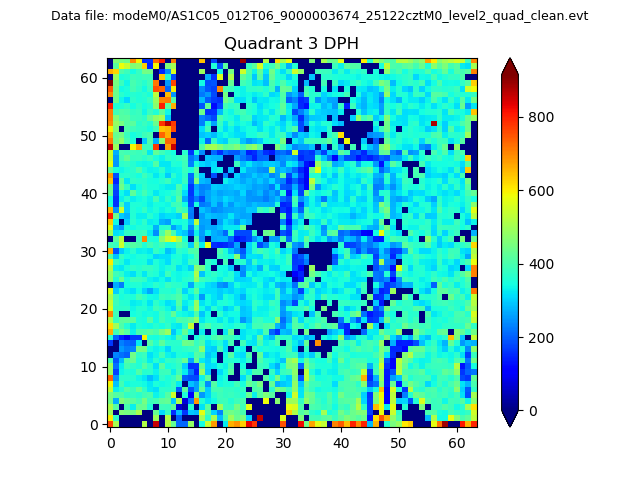 |
 |
Quadrant C |
| Plot type | Count rate plots | Images |
|---|---|---|
| Comparison with Poisson distribution Blue bars denote a histogram of data divided into 1 sec bins. Red curve is a Poisson curve with rate = median count rate of data. |
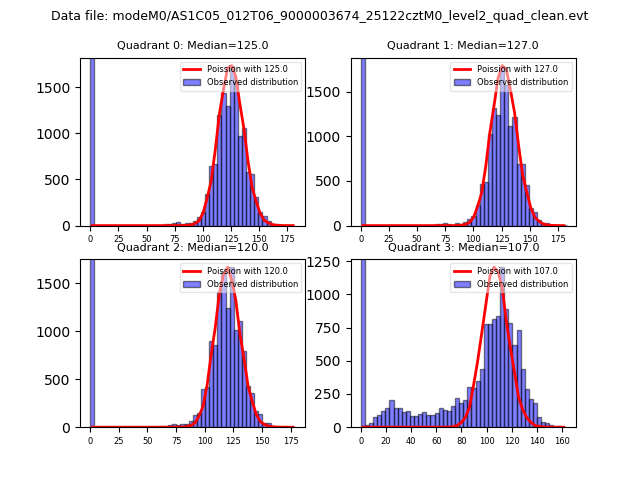 |
 |
| Quadrant-wise count rates Data is divided into 100 sec bins |
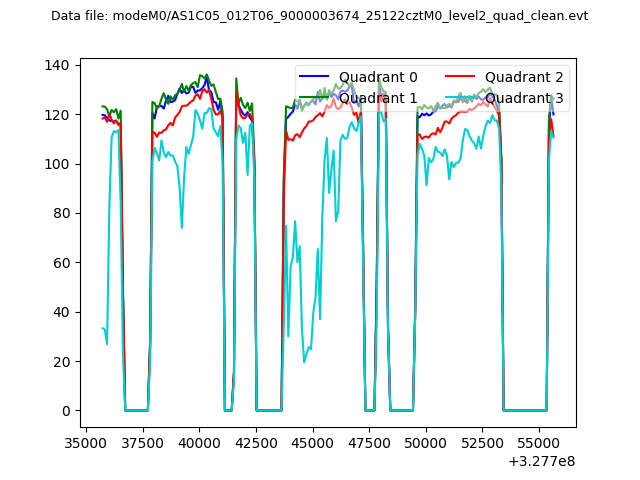 |
|
| Module-wise count rates for Quadrant A Data is divided into 100 sec bins |
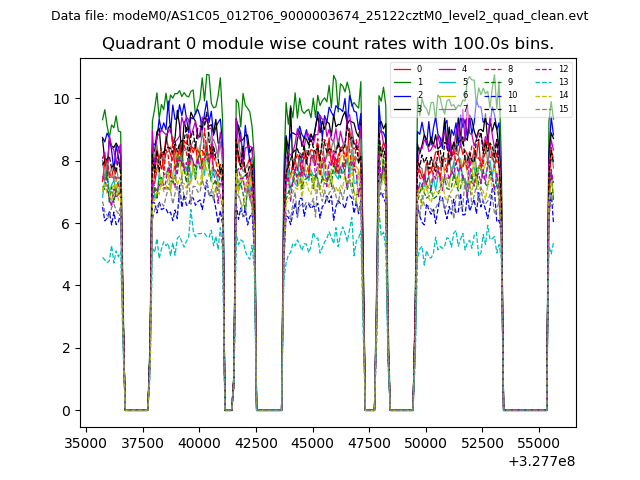 |
 |
| Module-wise count rates for Quadrant B Data is divided into 100 sec bins |
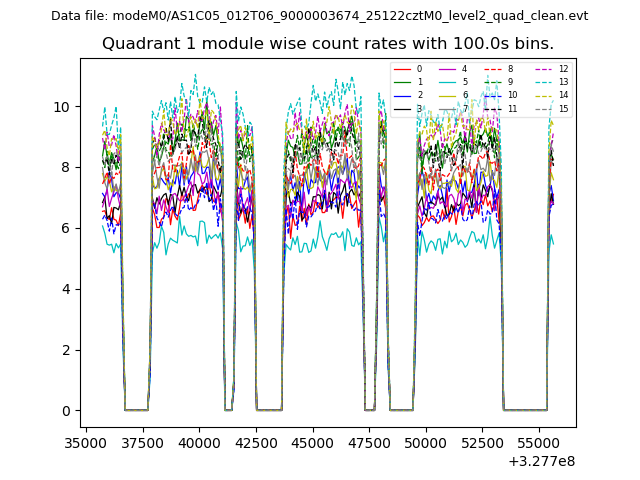 |
 |
| Module-wise count rates for Quadrant C Data is divided into 100 sec bins |
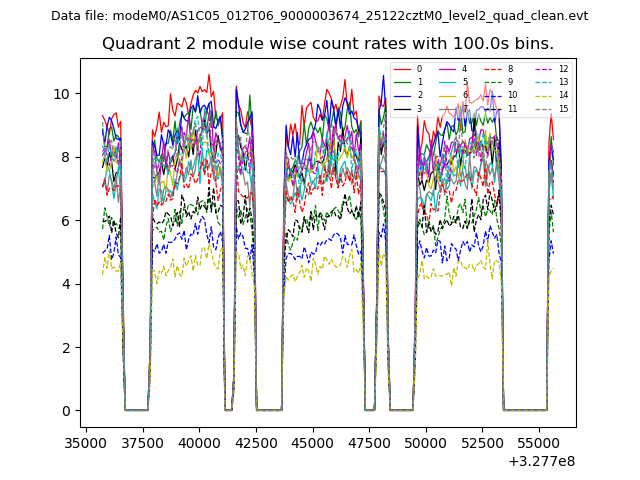 |
 |
| Module-wise count rates for Quadrant D Data is divided into 100 sec bins |
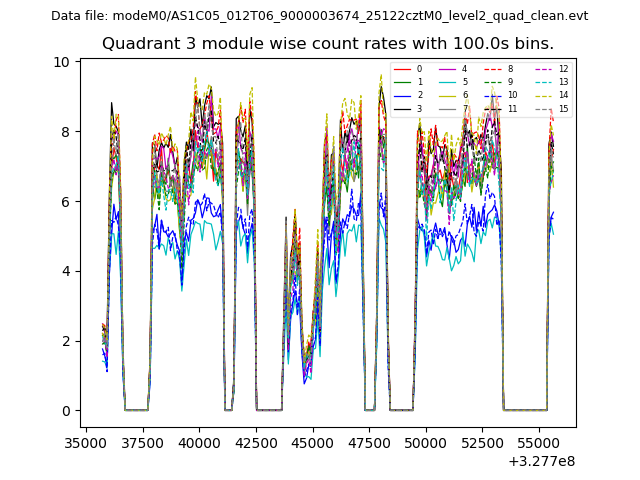 |
 |
| Parameter | Plot |
|---|---|
| CZT HV Monitor | 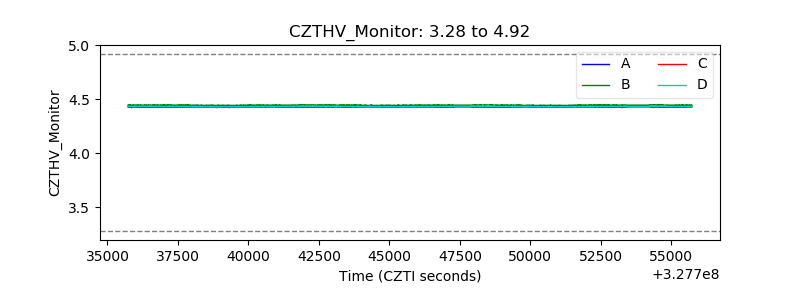 |
| D_VDD | 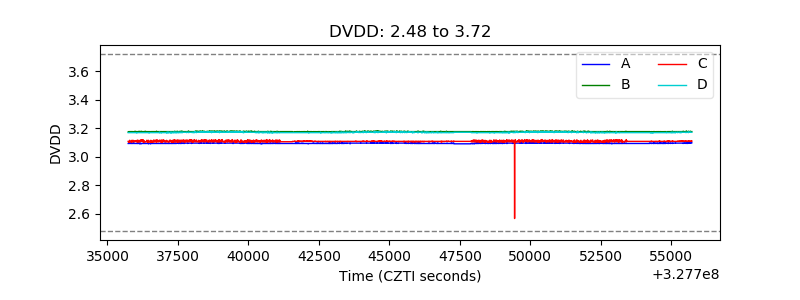 |
| Temperature 1 |  |
| Veto HV Monitor | 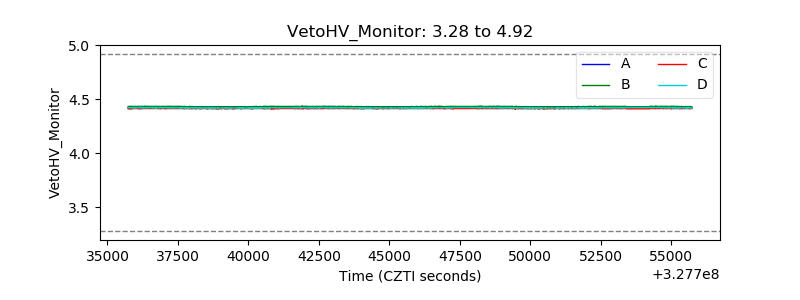 |
| Veto LLD | 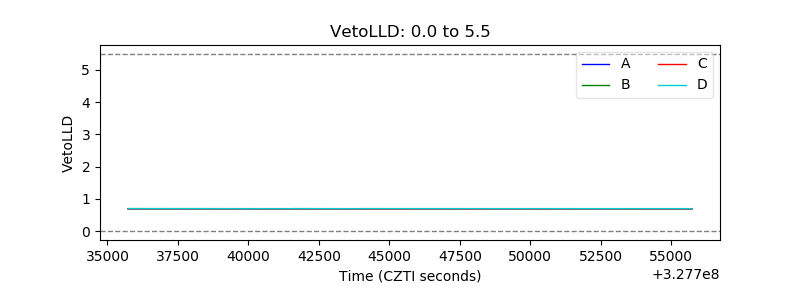 |
| Alpha Counter | 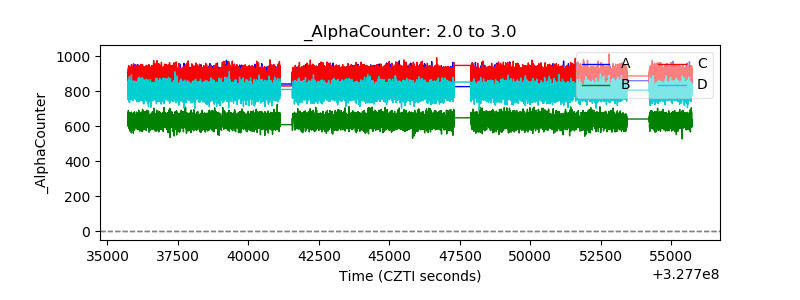 |
| _CPM_Rate | 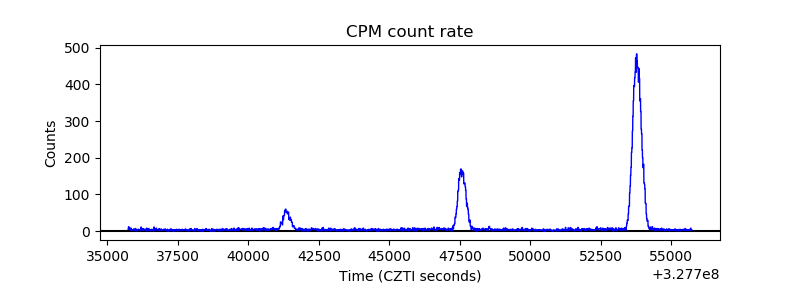 |
| CZT Counter | 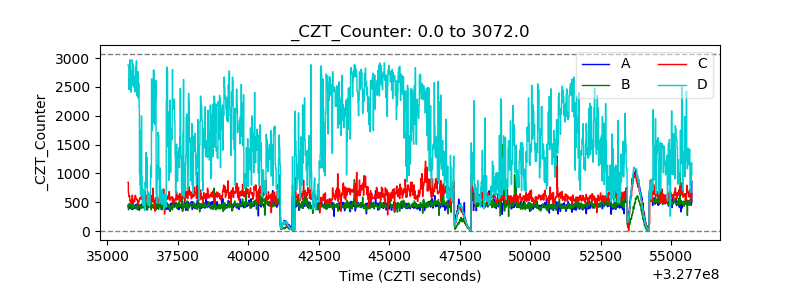 |
| +2.5 Volts monitor |  |
| +5 Volts monitor | 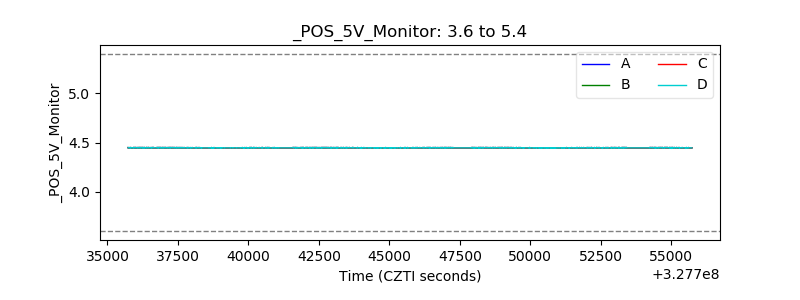 |
| _ROLL_ROT | 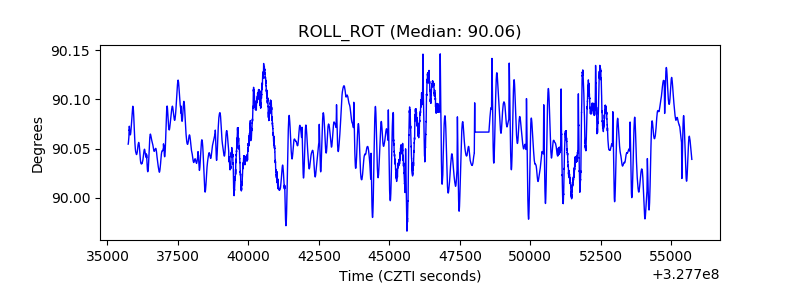 |
| _Roll_DEC | 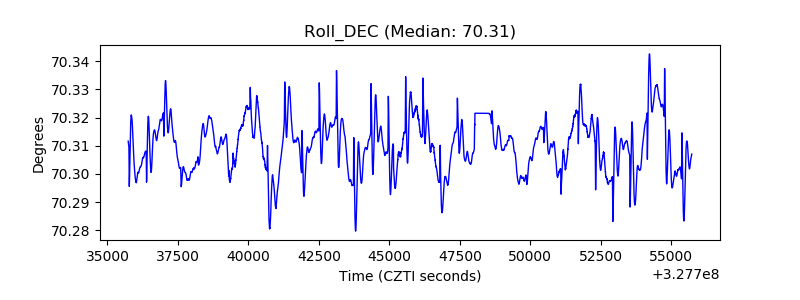 |
| _Roll_RA | 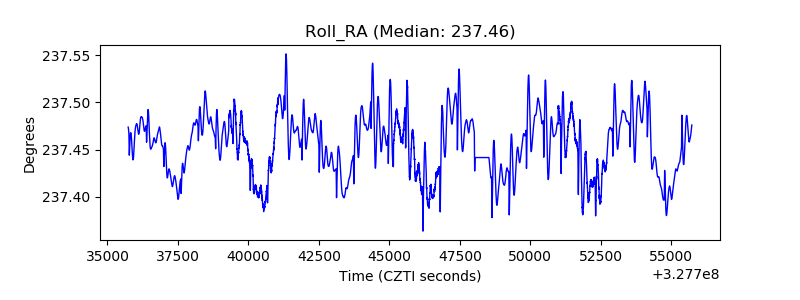 |
| Veto Counter | 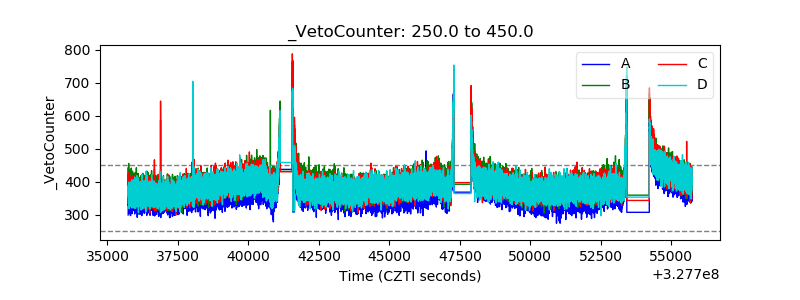 |