| Param | Original file | Final file |
|---|---|---|
| Filename | modeM0/AS1C05_012T06_9000003674_25123cztM0_level2.evt | modeM0/AS1C05_012T06_9000003674_25123cztM0_level2_quad_clean.evt |
| Size (bytes) | 165,032,640 | 20,502,720 |
| Size | 157.4 MB | 19.6 MB |
| Events in quadrant A | 750,027 | 133,457 |
| Events in quadrant B | 819,934 | 134,261 |
| Events in quadrant C | 1,032,146 | 122,069 |
| Events in quadrant D | 2,284,367 | 111,793 |
| Mode M0 | |||
|---|---|---|---|
| Quadrant | BADHDUFLAG | Total packets | Discarded packets |
| A | 0 | 3233 | 0 |
| B | 0 | 3419 | 0 |
| C | 0 | 4382 | 0 |
| D | 0 | 7904 | 0 |
| Quadrant | Total seconds | Saturated seconds | Saturation percentage |
|---|---|---|---|
| A | 1609 | 4 | 0.248602% |
| B | 1610 | 15 | 0.931677% |
| C | 1610 | 21 | 1.304348% |
| D | 1610 | 252 | 15.652174% |
Noise dominated data is calculated using 1-second bins in cleaned event files. If a bin has >2000 counts, and if more than 50% of those come from <1% of pixels, then it is considered to be noise-dominated and hence unusable.
| Quadrant | # 1 sec bins | Bins with >0 counts | Bins with >2000 counts | High rate bins dominated by noise | Noise dominated (total time) | Noise dominated (detector-on time) | Marked lightcurve |
|---|---|---|---|---|---|---|---|
| A | 1609 | 1609 | 0 | 0 | 0.00% | 0.00% | 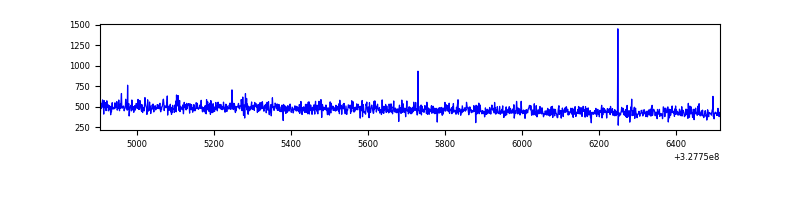 |
| B | 1610 | 1610 | 9 | 9 | 0.56% | 0.56% | 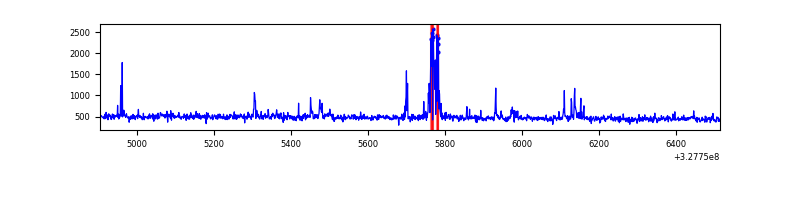 |
| C | 1610 | 1610 | 0 | 0 | 0.00% | 0.00% | 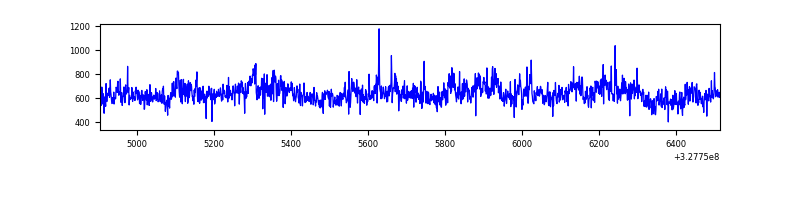 |
| D | 1610 | 1610 | 212 | 212 | 13.17% | 13.17% | 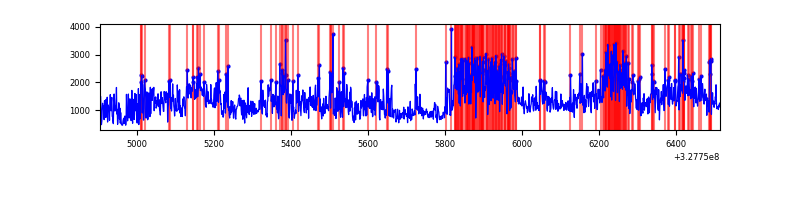 |
Top three noisy pixels from each quadrant. If the there are fewer than three noisy pixels in the level2.evt file, extra rows are filled as -1
| Pixel properties | Quadrant properties | ||||||
|---|---|---|---|---|---|---|---|
| Quadrant | DetID | PixID | Counts | Sigma | Mean | Median | Sigma |
| A | 13 | 254 | 2840 | 64.17 | 194 | 189 | 41.3 |
| A | 3 | 137 | 1767 | 38.2 | 194 | 189 | 41.3 |
| A | 0 | 226 | 1679 | 36.07 | 194 | 189 | 41.3 |
| B | 0 | 190 | 55119 | 1432.5 | 190 | 185 | 38.3 |
| B | 10 | 251 | 8219 | 209.5 | 190 | 185 | 38.3 |
| B | 15 | 33 | 4784 | 119.93 | 190 | 185 | 38.3 |
| C | 7 | 247 | 264024 | 6056.51 | 180 | 181 | 43.6 |
| C | 7 | 87 | 30602 | 698.31 | 180 | 181 | 43.6 |
| C | 14 | 238 | 29995 | 684.38 | 180 | 181 | 43.6 |
| D | 8 | 195 | 688061 | 15146.27 | 179 | 173 | 45.4 |
| D | 12 | 33 | 593436 | 13062.77 | 179 | 173 | 45.4 |
| D | 12 | 235 | 195522 | 4301.29 | 179 | 173 | 45.4 |
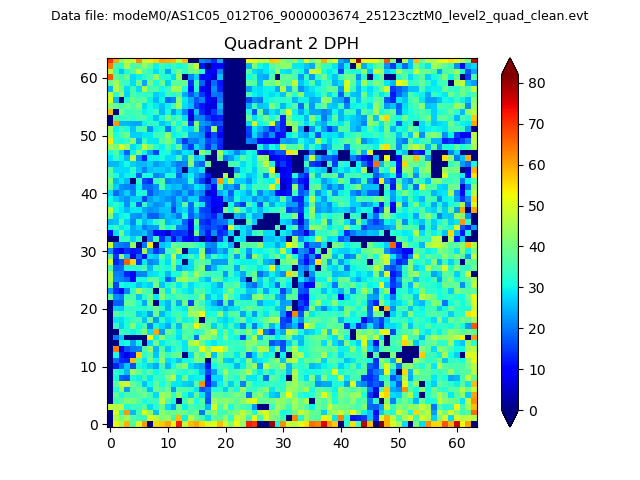
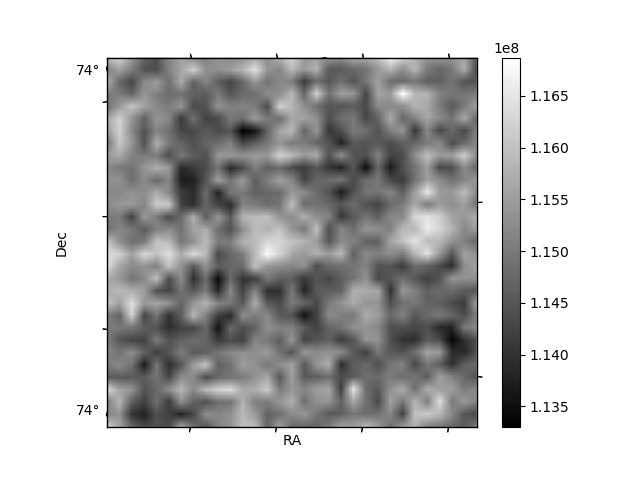
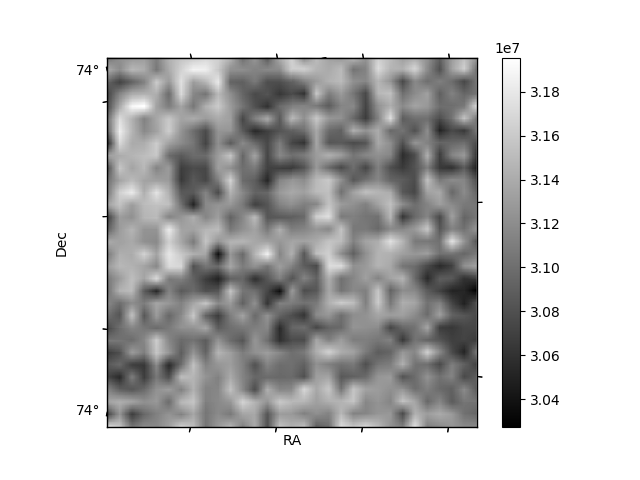
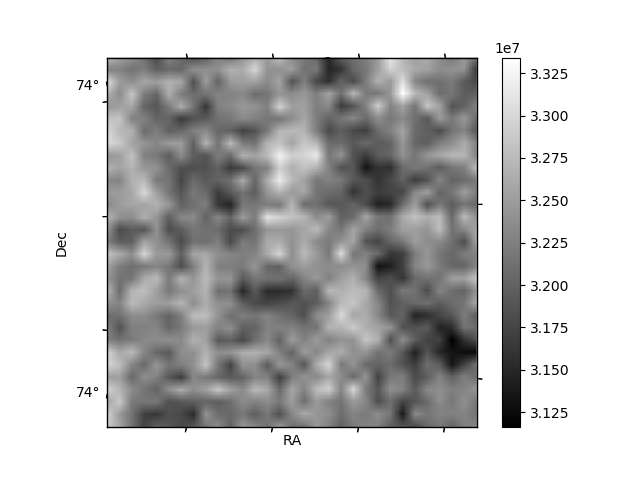
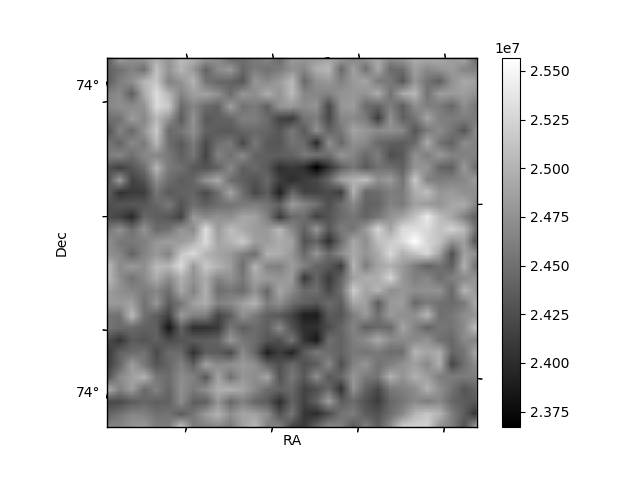
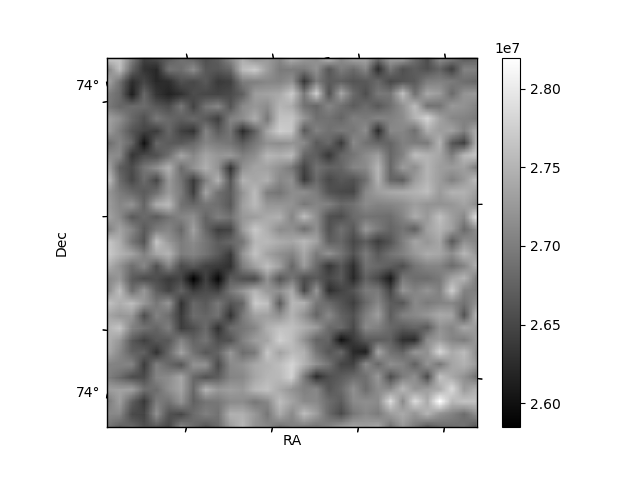
Histogram calculated using DETX and DETY for each event in the final _common_clean file
| Quadrant A | 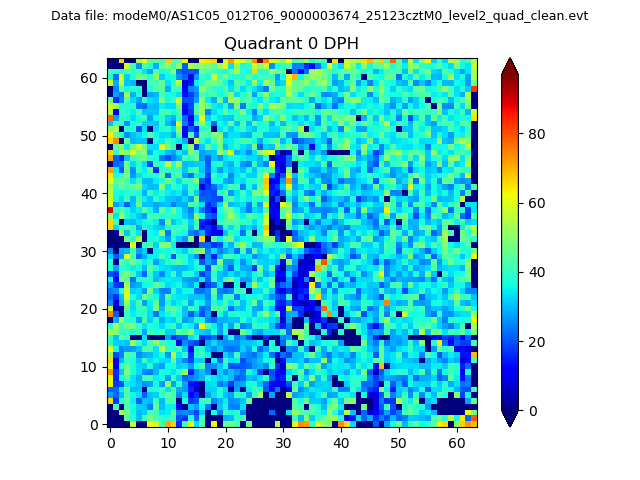 |
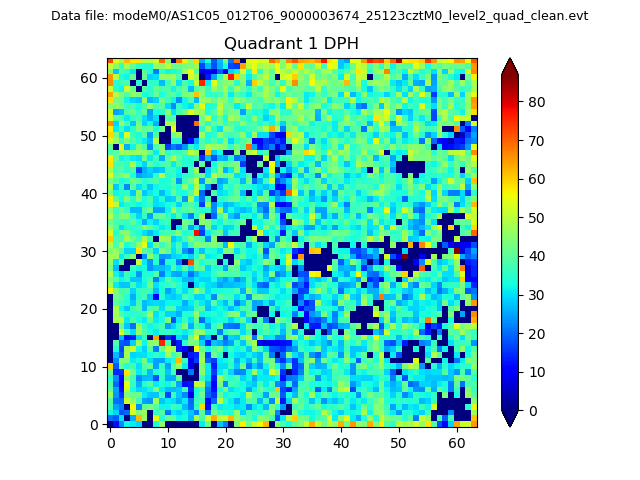 |
Quadrant B |
|---|---|---|---|
| Quadrant D | 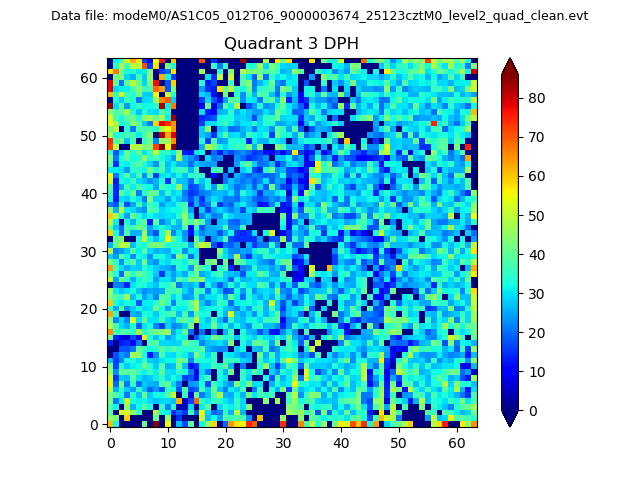 |
 |
Quadrant C |
| Plot type | Count rate plots | Images |
|---|---|---|
| Comparison with Poisson distribution Blue bars denote a histogram of data divided into 1 sec bins. Red curve is a Poisson curve with rate = median count rate of data. |
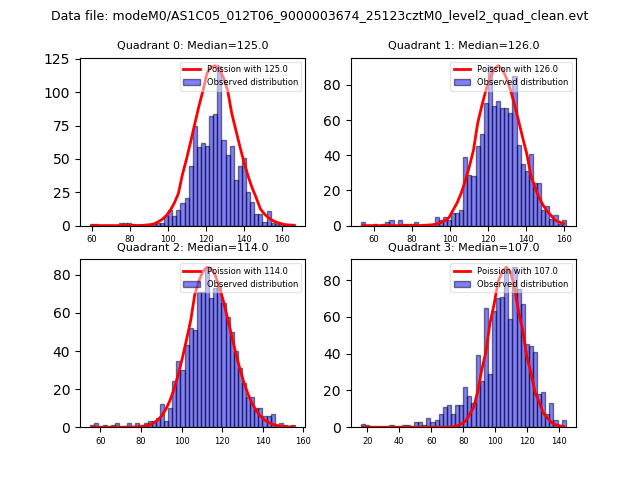 |
 |
| Quadrant-wise count rates Data is divided into 100 sec bins |
 |
|
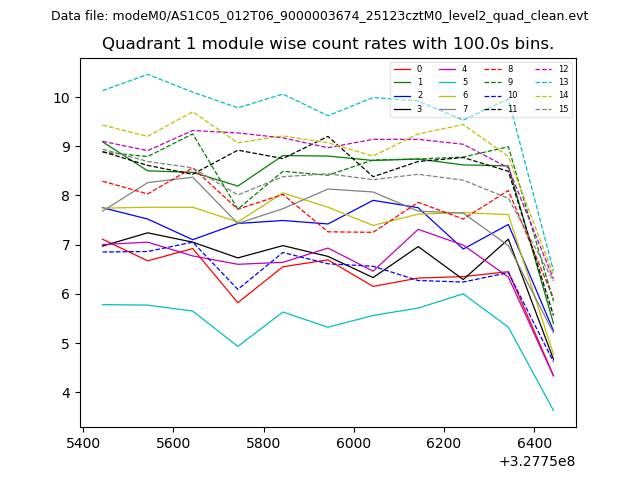
| Module-wise count rates for Quadrant A Data is divided into 100 sec bins |
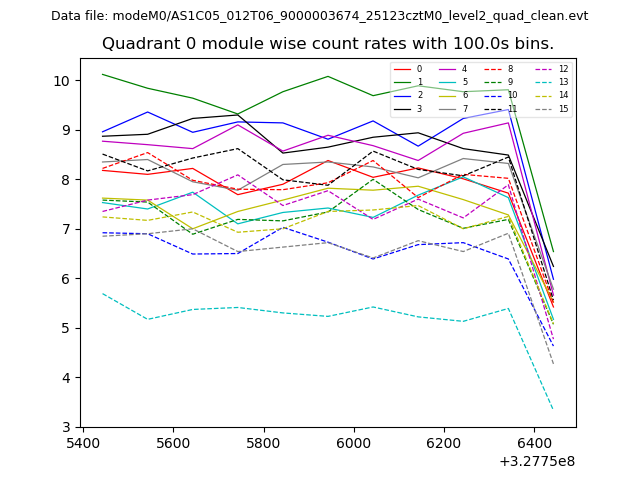 |
 |
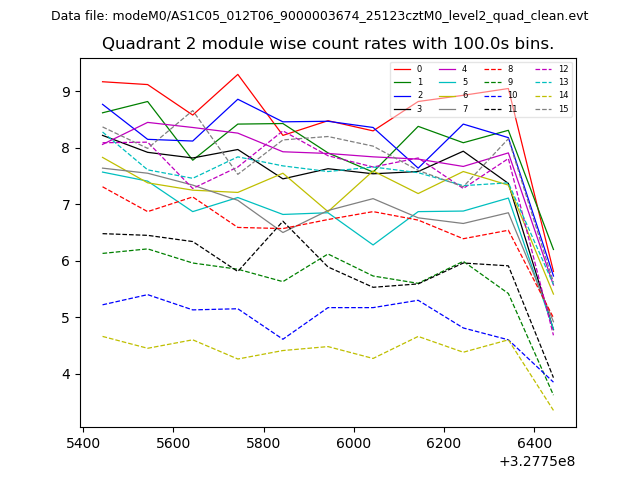
| Module-wise count rates for Quadrant B Data is divided into 100 sec bins |
 |
 |
| Module-wise count rates for Quadrant C Data is divided into 100 sec bins |
 |
 |
| Module-wise count rates for Quadrant D Data is divided into 100 sec bins |
 |
 |
| Parameter | Plot |
|---|---|
| CZT HV Monitor | 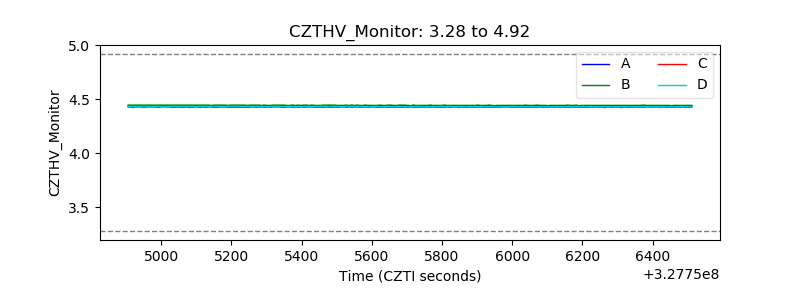 |
| D_VDD |  |
| Temperature 1 | 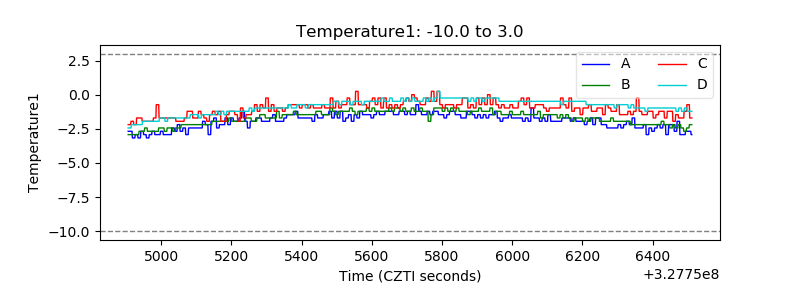 |
| Veto HV Monitor | 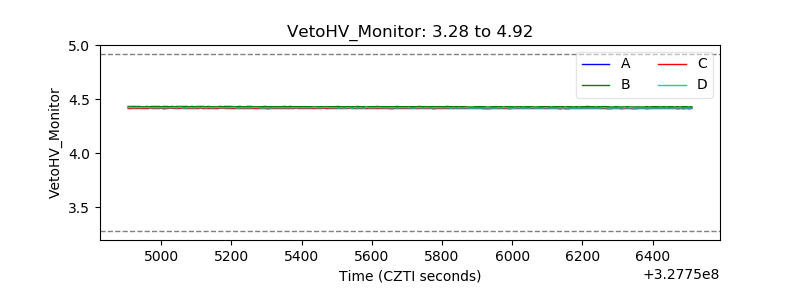 |
| Veto LLD |  |
| Alpha Counter | 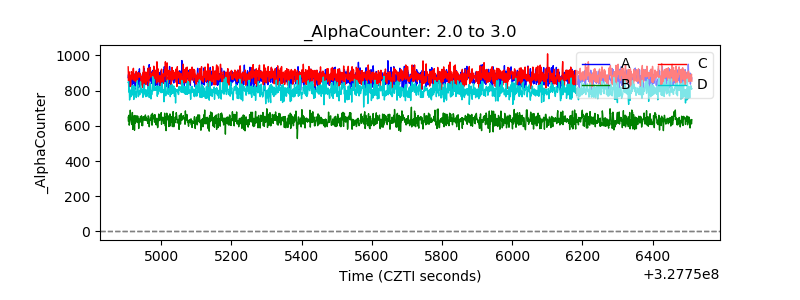 |
| _CPM_Rate | 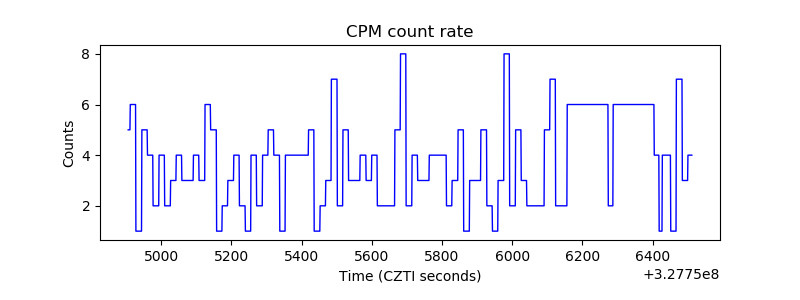 |
| CZT Counter | 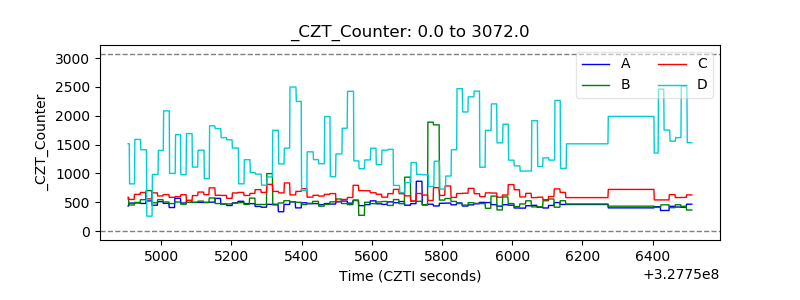 |
| +2.5 Volts monitor |  |
| +5 Volts monitor |  |
| _ROLL_ROT | 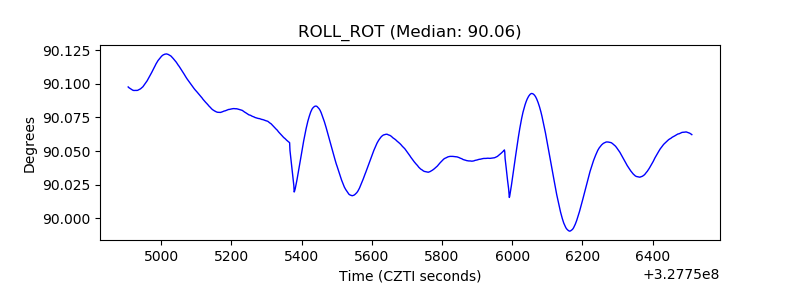 |
| _Roll_DEC | 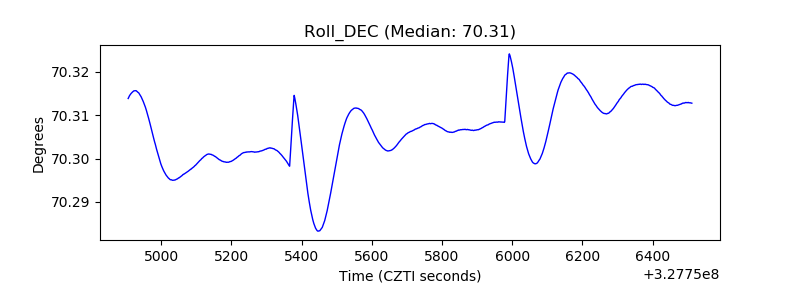 |
| _Roll_RA | 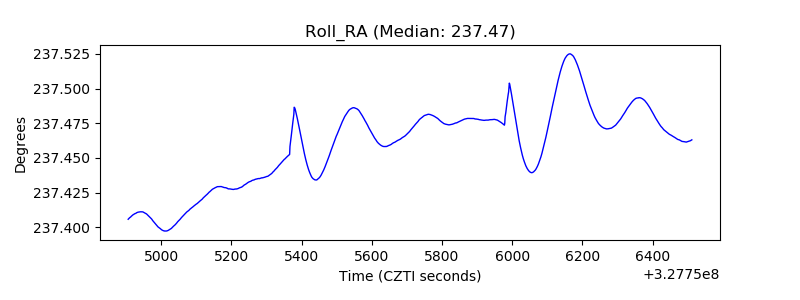 |
| Veto Counter |  |