| Param | Original file | Final file |
|---|---|---|
| Filename | modeM0/AS1A07_091T03_9000003678cztM0_level2.fits | modeM0/AS1A07_091T03_9000003678cztM0_level2_quad_clean.evt |
| Size (bytes) | 327,738,240 | 332,824,320 |
| Size | 312.6 MB | 317.4 MB |
| Events in quadrant A | 2,020,164 | 2,035,619 |
| Events in quadrant B | 1,934,650 | 2,040,034 |
| Events in quadrant C | 1,965,204 | 1,925,630 |
| Events in quadrant D | 1,667,434 | 1,740,767 |
| Mode M9 | |||
|---|---|---|---|
| Quadrant | BADHDUFLAG | Total packets | Discarded packets |
| A | 0 | 41 | 0 |
| B | 0 | 41 | 0 |
| C | 0 | 41 | 0 |
| D | 0 | 41 | 0 |
| Mode M0 | |||
|---|---|---|---|
| Quadrant | BADHDUFLAG | Total packets | Discarded packets |
| A | 0 | 70430 | 0 |
| B | 0 | 71608 | 0 |
| C | 0 | 76762 | 0 |
| D | 0 | 98625 | 0 |
| Mode SS | |||
|---|---|---|---|
| Quadrant | BADHDUFLAG | Total packets | Discarded packets |
| A | 0 | 696 | 0 |
| B | 0 | 696 | 0 |
| C | 0 | 696 | 0 |
| D | 0 | 696 | 0 |
| Quadrant | Total seconds | Saturated seconds | Saturation percentage |
|---|---|---|---|
| A | 34009 | 323 | 0.949749% |
| B | 34010 | 480 | 1.411350% |
| C | 34010 | 627 | 1.843575% |
| D | 34010 | 2524 | 7.421347% |
Noise dominated data is calculated using 1-second bins in cleaned event files. If a bin has >2000 counts, and if more than 50% of those come from <1% of pixels, then it is considered to be noise-dominated and hence unusable.
| Quadrant | # 1 sec bins | Bins with >0 counts | Bins with >2000 counts | High rate bins dominated by noise | Noise dominated (total time) | Noise dominated (detector-on time) | Marked lightcurve |
|---|---|---|---|---|---|---|---|
| A | 38315 | 34008 | 0 | 0 | 0.00% | 0.00% |  |
| B | 38316 | 34009 | 0 | 0 | 0.00% | 0.00% |  |
| C | 38316 | 34008 | 0 | 0 | 0.00% | 0.00% |  |
| D | 38316 | 33971 | 0 | 0 | 0.00% | 0.00% |  |
Top three noisy pixels from each quadrant. If the there are fewer than three noisy pixels in the level2.evt file, extra rows are filled as -1
| Pixel properties | Quadrant properties | ||||||
|---|---|---|---|---|---|---|---|
| Quadrant | DetID | PixID | Counts | Sigma | Mean | Median | Sigma |
| A | 0 | 29 | 1951 | 11.1 | 525 | 492 | 131.4 |
| A | 7 | 110 | 1608 | 8.49 | 525 | 492 | 131.4 |
| A | 0 | 30 | 1597 | 8.41 | 525 | 492 | 131.4 |
| B | 2 | 9 | 1624 | 11.0 | 511 | 486 | 103.5 |
| B | 2 | 8 | 1325 | 8.11 | 511 | 486 | 103.5 |
| B | 5 | 255 | 1313 | 7.99 | 511 | 486 | 103.5 |
| C | 1 | 80 | 1604 | 8.45 | 518 | 483 | 132.7 |
| C | 1 | 81 | 1577 | 8.24 | 518 | 483 | 132.7 |
| C | 12 | 241 | 1361 | 6.62 | 518 | 483 | 132.7 |
| D | 3 | 14 | 1282 | 6.66 | 475 | 433 | 127.4 |
| D | 4 | 246 | 1229 | 6.25 | 475 | 433 | 127.4 |
| D | 6 | 231 | 1207 | 6.08 | 475 | 433 | 127.4 |
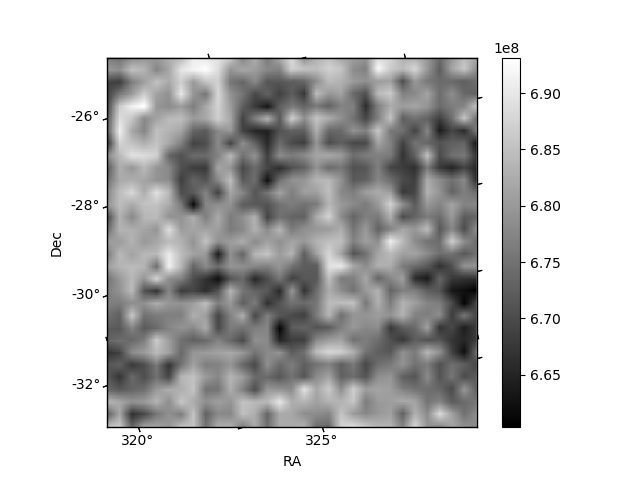
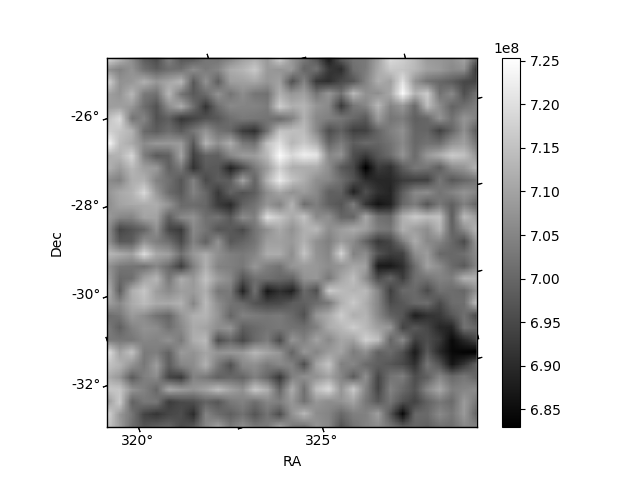
Histogram calculated using DETX and DETY for each event in the final _common_clean file
| Quadrant A |  |
 |
Quadrant B |
|---|---|---|---|
| Quadrant D |  |
 |
Quadrant C |
| Plot type | Count rate plots | Images |
|---|---|---|
| Comparison with Poisson distribution Blue bars denote a histogram of data divided into 1 sec bins. Red curve is a Poisson curve with rate = median count rate of data. |
 |
 |
| Quadrant-wise count rates Data is divided into 100 sec bins |
 |
|
| Module-wise count rates for Quadrant A Data is divided into 100 sec bins |
 |
 |
| Module-wise count rates for Quadrant B Data is divided into 100 sec bins |
 |
 |
| Module-wise count rates for Quadrant C Data is divided into 100 sec bins |
 |
 |
| Module-wise count rates for Quadrant D Data is divided into 100 sec bins |
 |
 |
| Parameter | Plot |
|---|---|
| CZT HV Monitor |  |
| D_VDD | 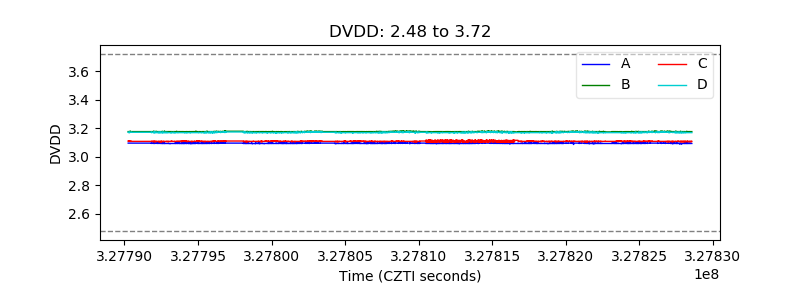 |
| Temperature 1 |  |
| Veto HV Monitor |  |
| Veto LLD |  |
| Alpha Counter |  |
| _CPM_Rate |  |
| CZT Counter | 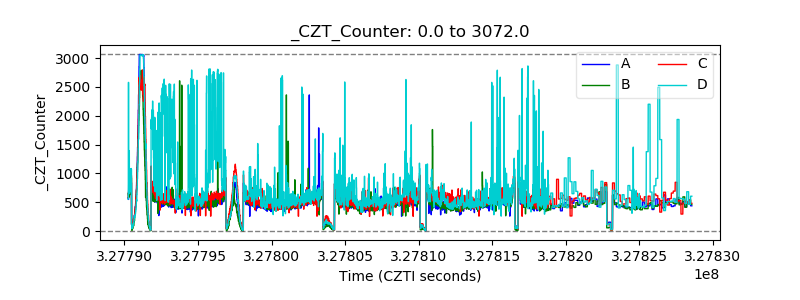 |
| +2.5 Volts monitor |  |
| +5 Volts monitor |  |
| _ROLL_ROT |  |
| _Roll_DEC |  |
| _Roll_RA |  |
| Veto Counter | 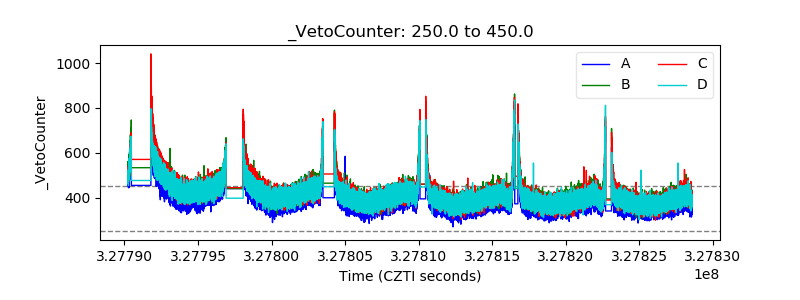 |