| Param | Original file | Final file |
|---|---|---|
| Filename | modeM0/AS1A07_091T03_9000003678_25131cztM0_level2.evt | modeM0/AS1A07_091T03_9000003678_25131cztM0_level2_quad_clean.evt |
| Size (bytes) | 506,989,440 | 103,870,080 |
| Size | 483.5 MB | 99.1 MB |
| Events in quadrant A | 3,400,751 | 678,867 |
| Events in quadrant B | 3,507,409 | 686,508 |
| Events in quadrant C | 3,490,708 | 660,664 |
| Events in quadrant D | 4,488,212 | 640,140 |
| Mode M9 | |||
|---|---|---|---|
| Quadrant | BADHDUFLAG | Total packets | Discarded packets |
| A | 0 | 13 | 0 |
| B | 0 | 14 | 0 |
| C | 0 | 14 | 0 |
| D | 0 | 14 | 0 |
| Mode M0 | |||
|---|---|---|---|
| Quadrant | BADHDUFLAG | Total packets | Discarded packets |
| A | 0 | 14565 | 0 |
| B | 0 | 14706 | 0 |
| C | 0 | 14449 | 0 |
| D | 0 | 17914 | 0 |
| Quadrant | Total seconds | Saturated seconds | Saturation percentage |
|---|---|---|---|
| A | 6875 | 79 | 1.149091% |
| B | 6875 | 97 | 1.410909% |
| C | 6875 | 103 | 1.498182% |
| D | 6875 | 181 | 2.632727% |
Noise dominated data is calculated using 1-second bins in cleaned event files. If a bin has >2000 counts, and if more than 50% of those come from <1% of pixels, then it is considered to be noise-dominated and hence unusable.
| Quadrant | # 1 sec bins | Bins with >0 counts | Bins with >2000 counts | High rate bins dominated by noise | Noise dominated (total time) | Noise dominated (detector-on time) | Marked lightcurve |
|---|---|---|---|---|---|---|---|
| A | 7661 | 6876 | 29 | 29 | 0.38% | 0.42% | 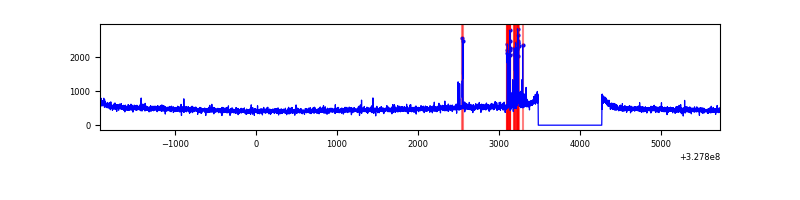 |
| B | 7661 | 6876 | 25 | 25 | 0.33% | 0.36% | 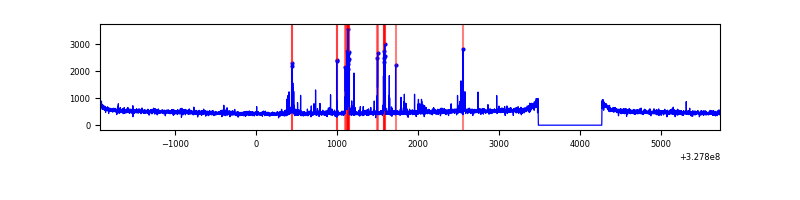 |
| C | 7661 | 6875 | 0 | 0 | 0.00% | 0.00% | 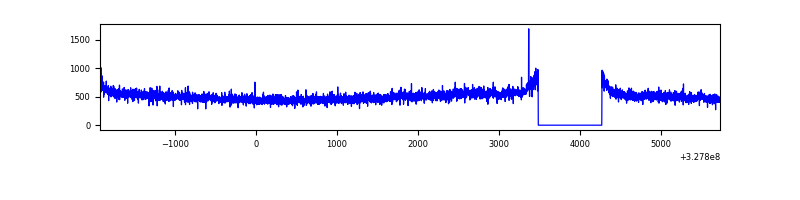 |
| D | 7661 | 6875 | 103 | 103 | 1.34% | 1.50% | 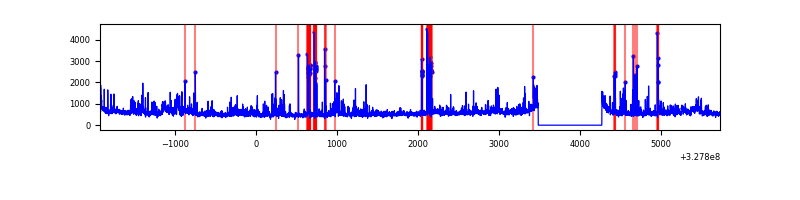 |
Top three noisy pixels from each quadrant. If the there are fewer than three noisy pixels in the level2.evt file, extra rows are filled as -1
| Pixel properties | Quadrant properties | ||||||
|---|---|---|---|---|---|---|---|
| Quadrant | DetID | PixID | Counts | Sigma | Mean | Median | Sigma |
| A | 15 | 174 | 135503 | 788.44 | 846 | 827 | 170.8 |
| A | 13 | 254 | 10984 | 59.46 | 846 | 827 | 170.8 |
| A | 3 | 137 | 7719 | 40.35 | 846 | 827 | 170.8 |
| B | 10 | 246 | 149364 | 912.55 | 848 | 827 | 162.8 |
| B | 12 | 111 | 19992 | 117.74 | 848 | 827 | 162.8 |
| B | 4 | 80 | 19922 | 117.31 | 848 | 827 | 162.8 |
| C | 7 | 247 | 133679 | 684.44 | 824 | 828 | 194.1 |
| C | 14 | 238 | 131476 | 673.09 | 824 | 828 | 194.1 |
| C | 3 | 233 | 9300 | 43.65 | 824 | 828 | 194.1 |
| D | 1 | 52 | 734906 | 3672.85 | 825 | 803 | 199.9 |
| D | 8 | 195 | 305259 | 1523.25 | 825 | 803 | 199.9 |
| D | 2 | 244 | 133740 | 665.11 | 825 | 803 | 199.9 |
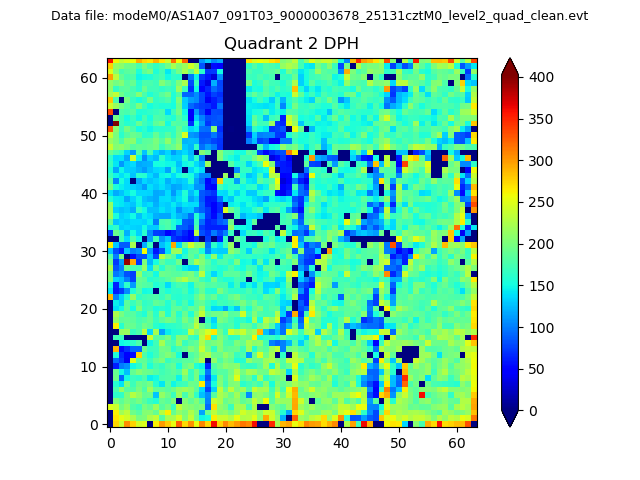
Histogram calculated using DETX and DETY for each event in the final _common_clean file
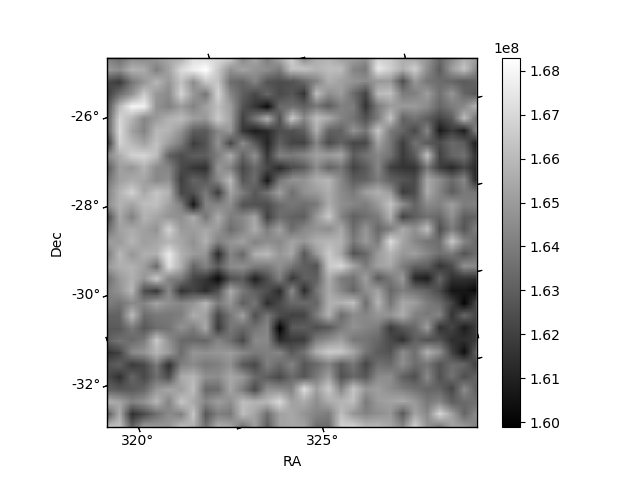
| Quadrant A | 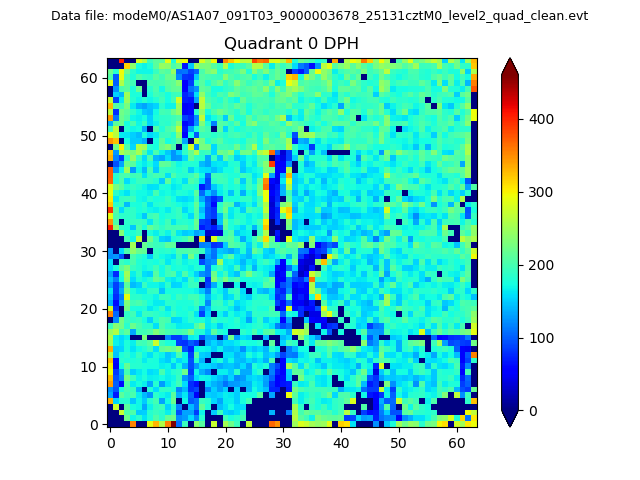 |
 |
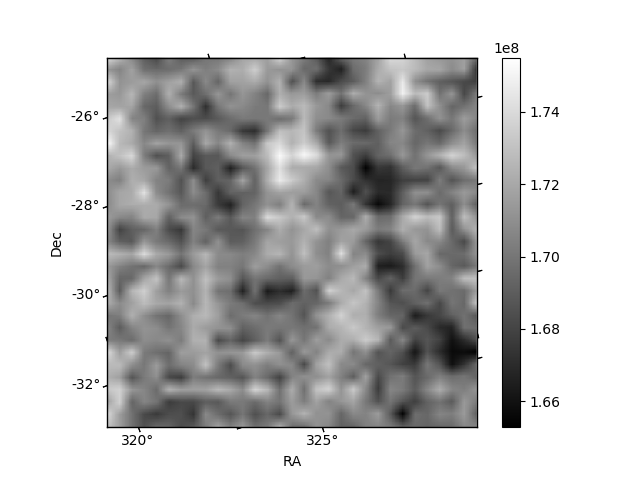
Quadrant B |
|---|---|---|---|
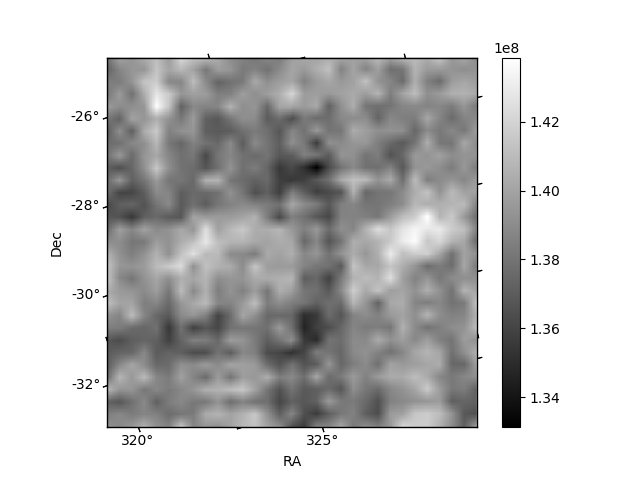
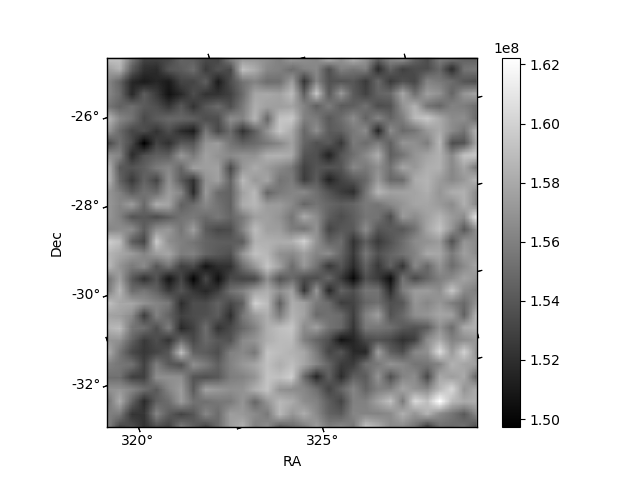
| Quadrant D |  |
 |
Quadrant C |
| Plot type | Count rate plots | Images |
|---|---|---|
| Comparison with Poisson distribution Blue bars denote a histogram of data divided into 1 sec bins. Red curve is a Poisson curve with rate = median count rate of data. |
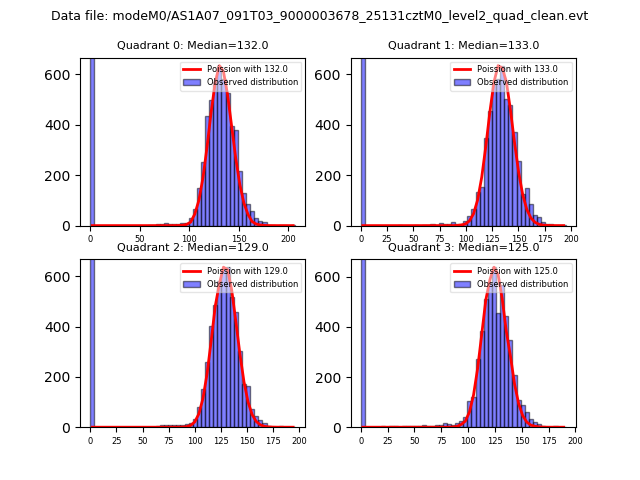 |
 |
| Quadrant-wise count rates Data is divided into 100 sec bins |
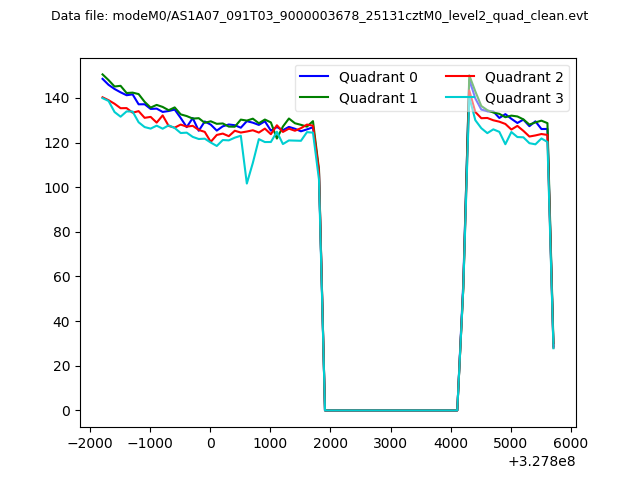 |
|
| Module-wise count rates for Quadrant A Data is divided into 100 sec bins |
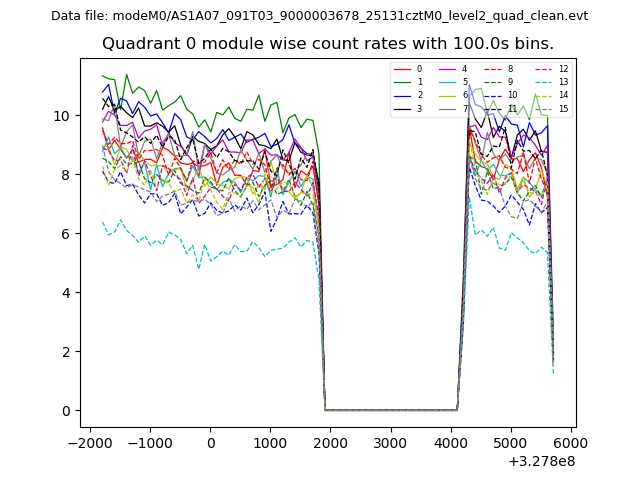 |
 |
| Module-wise count rates for Quadrant B Data is divided into 100 sec bins |
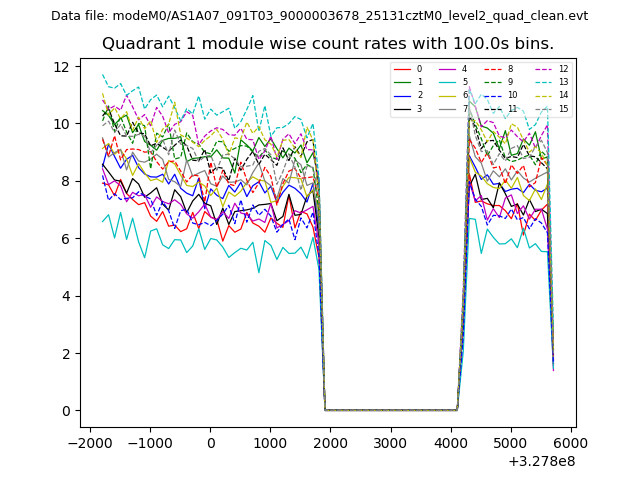 |
 |
| Module-wise count rates for Quadrant C Data is divided into 100 sec bins |
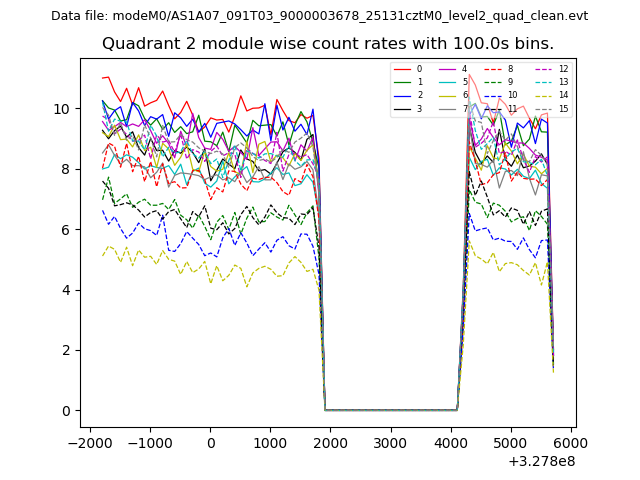 |
 |
| Module-wise count rates for Quadrant D Data is divided into 100 sec bins |
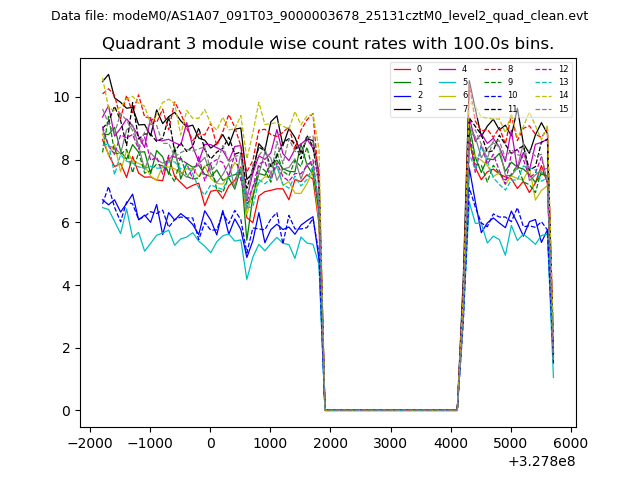 |
 |
| Parameter | Plot |
|---|---|
| CZT HV Monitor | 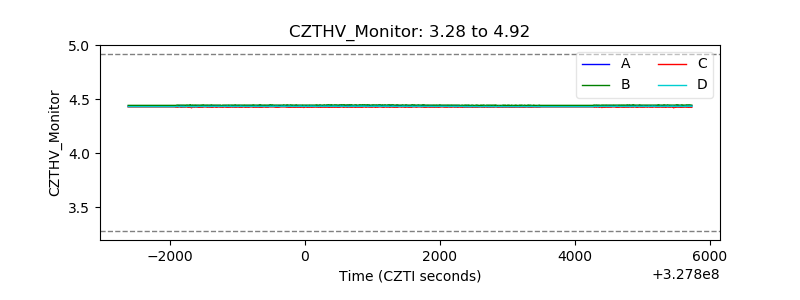 |
| D_VDD | 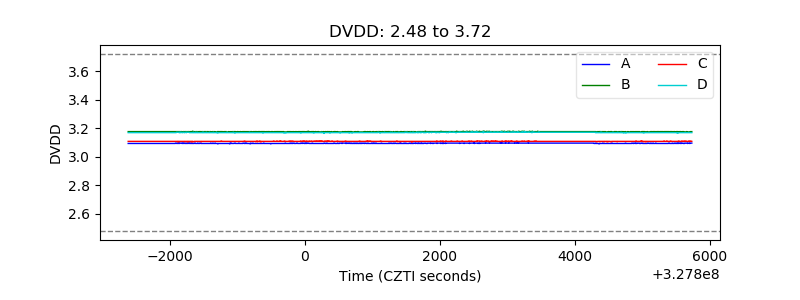 |
| Temperature 1 | 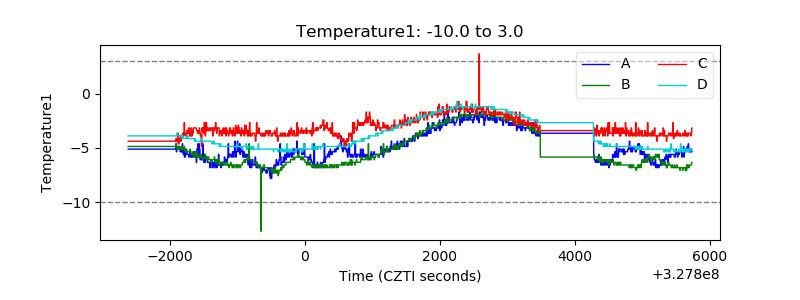 |
| Veto HV Monitor | 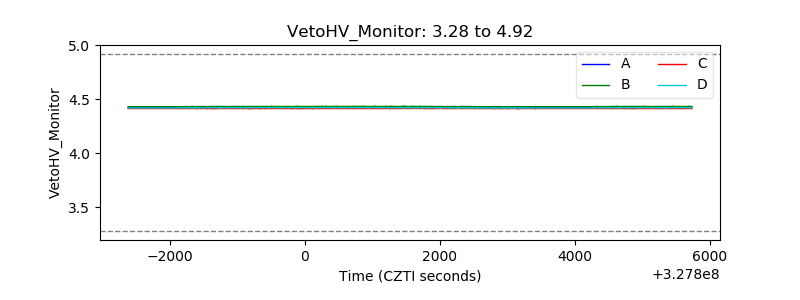 |
| Veto LLD | 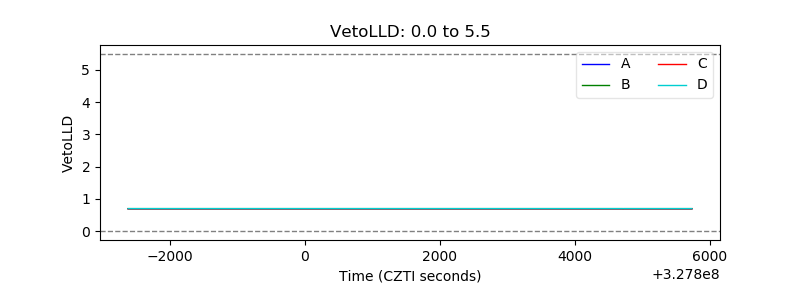 |
| Alpha Counter | 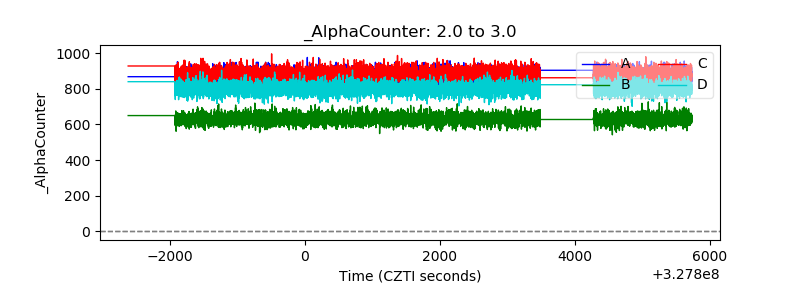 |
| _CPM_Rate | 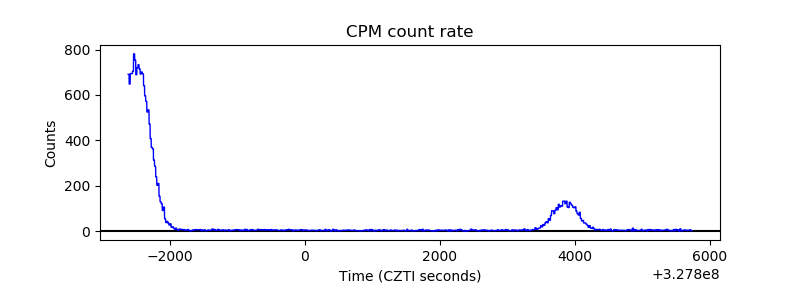 |
| CZT Counter | 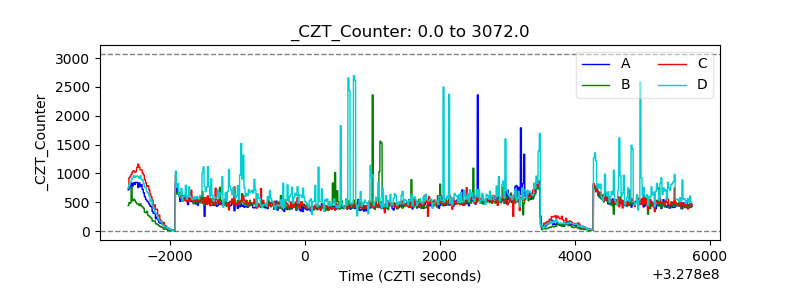 |
| +2.5 Volts monitor |  |
| +5 Volts monitor |  |
| _ROLL_ROT | 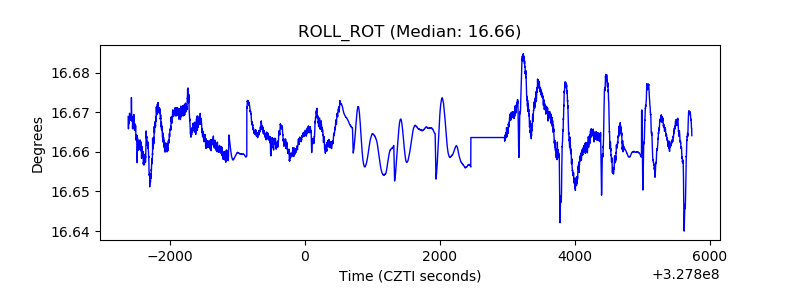 |
| _Roll_DEC |  |
| _Roll_RA | 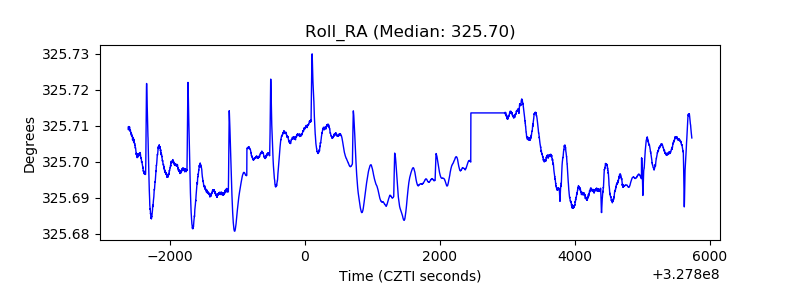 |
| Veto Counter | 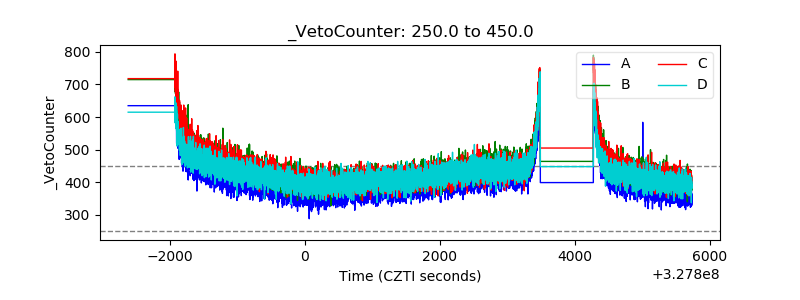 |