| Param | Original file | Final file |
|---|---|---|
| Filename | modeM0/AS1A07_091T03_9000003678_25132cztM0_level2.evt | modeM0/AS1A07_091T03_9000003678_25132cztM0_level2_quad_clean.evt |
| Size (bytes) | 580,680,000 | 105,261,120 |
| Size | 553.8 MB | 100.4 MB |
| Events in quadrant A | 3,907,724 | 670,851 |
| Events in quadrant B | 3,936,694 | 678,601 |
| Events in quadrant C | 4,166,044 | 648,557 |
| Events in quadrant D | 5,038,764 | 639,689 |
| Mode M9 | |||
|---|---|---|---|
| Quadrant | BADHDUFLAG | Total packets | Discarded packets |
| A | 0 | 10 | 0 |
| B | 0 | 10 | 0 |
| C | 0 | 10 | 0 |
| D | 0 | 10 | 0 |
| Mode M0 | |||
|---|---|---|---|
| Quadrant | BADHDUFLAG | Total packets | Discarded packets |
| A | 0 | 16790 | 0 |
| B | 0 | 16732 | 0 |
| C | 0 | 17169 | 0 |
| D | 0 | 20197 | 0 |
| Quadrant | Total seconds | Saturated seconds | Saturation percentage |
|---|---|---|---|
| A | 7900 | 104 | 1.316456% |
| B | 7901 | 133 | 1.683331% |
| C | 7901 | 185 | 2.341476% |
| D | 7901 | 157 | 1.987090% |
Noise dominated data is calculated using 1-second bins in cleaned event files. If a bin has >2000 counts, and if more than 50% of those come from <1% of pixels, then it is considered to be noise-dominated and hence unusable.
| Quadrant | # 1 sec bins | Bins with >0 counts | Bins with >2000 counts | High rate bins dominated by noise | Noise dominated (total time) | Noise dominated (detector-on time) | Marked lightcurve |
|---|---|---|---|---|---|---|---|
| A | 9076 | 7902 | 27 | 27 | 0.30% | 0.34% | 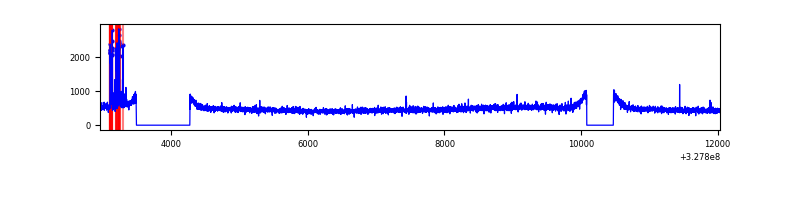 |
| B | 9077 | 7903 | 5 | 5 | 0.06% | 0.06% | 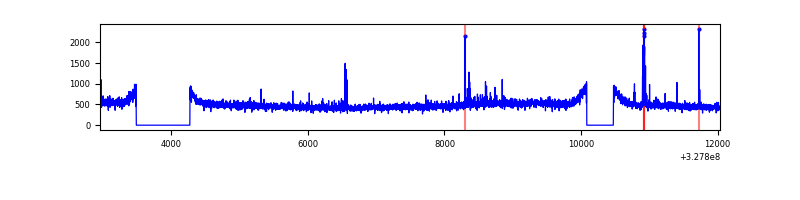 |
| C | 9077 | 7901 | 0 | 0 | 0.00% | 0.00% | 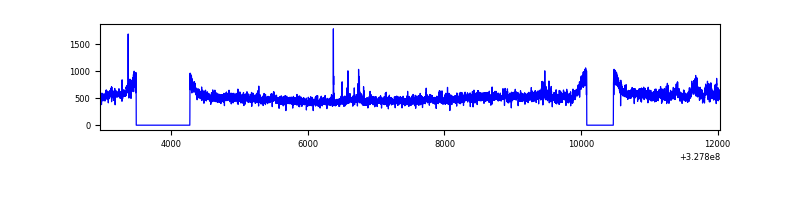 |
| D | 9077 | 7902 | 43 | 43 | 0.47% | 0.54% | 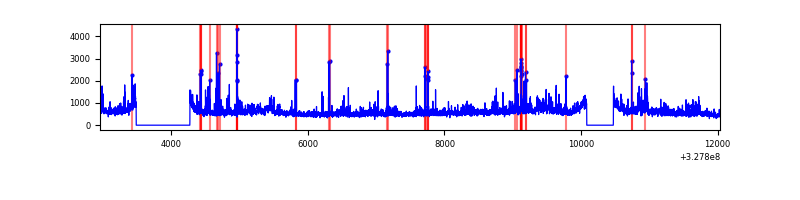 |
Top three noisy pixels from each quadrant. If the there are fewer than three noisy pixels in the level2.evt file, extra rows are filled as -1
| Pixel properties | Quadrant properties | ||||||
|---|---|---|---|---|---|---|---|
| Quadrant | DetID | PixID | Counts | Sigma | Mean | Median | Sigma |
| A | 15 | 174 | 114923 | 570.27 | 984 | 963 | 199.8 |
| A | 13 | 254 | 12015 | 55.31 | 984 | 963 | 199.8 |
| A | 3 | 137 | 9419 | 42.31 | 984 | 963 | 199.8 |
| B | 10 | 246 | 44112 | 227.63 | 981 | 956 | 189.6 |
| B | 12 | 111 | 23721 | 120.08 | 981 | 956 | 189.6 |
| B | 11 | 111 | 21181 | 106.68 | 981 | 956 | 189.6 |
| C | 7 | 247 | 271186 | 1191.72 | 950 | 955 | 226.8 |
| C | 14 | 238 | 147984 | 648.4 | 950 | 955 | 226.8 |
| C | 9 | 54 | 34008 | 145.76 | 950 | 955 | 226.8 |
| D | 1 | 52 | 622510 | 2640.16 | 962 | 934 | 235.4 |
| D | 8 | 195 | 416577 | 1765.45 | 962 | 934 | 235.4 |
| D | 2 | 244 | 221489 | 936.81 | 962 | 934 | 235.4 |
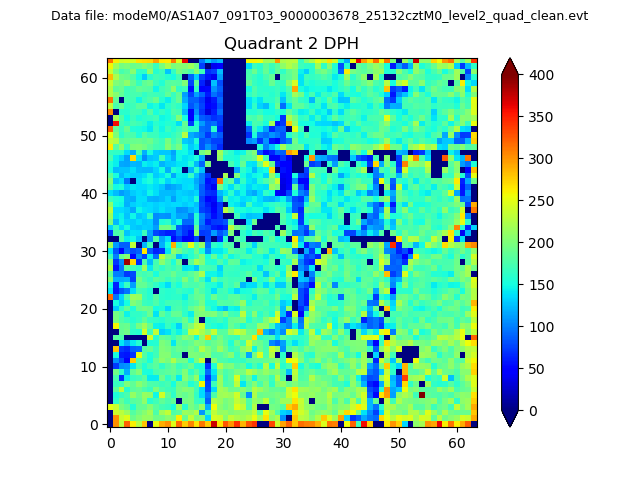
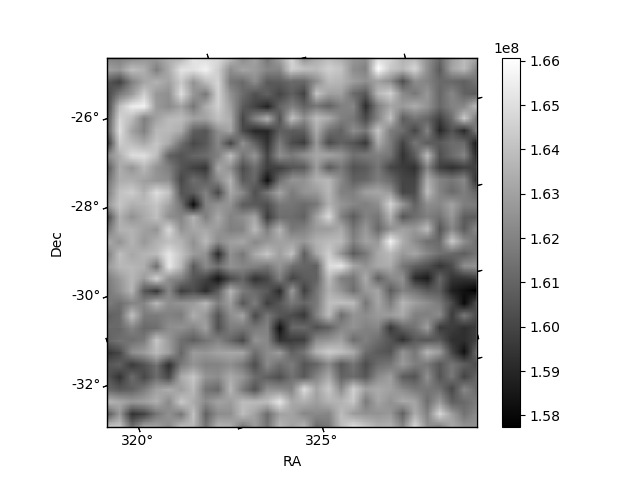
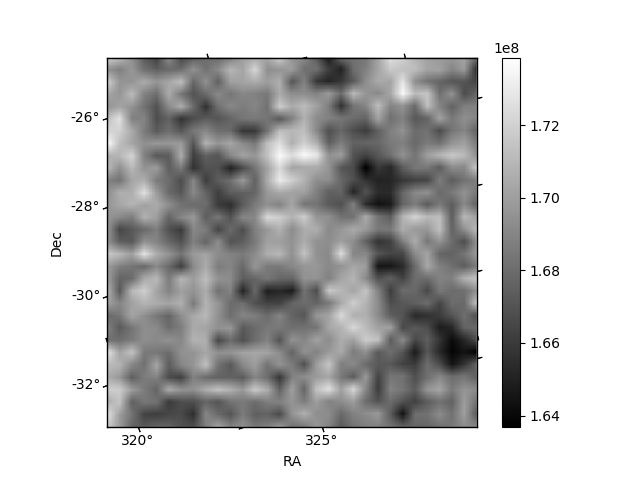
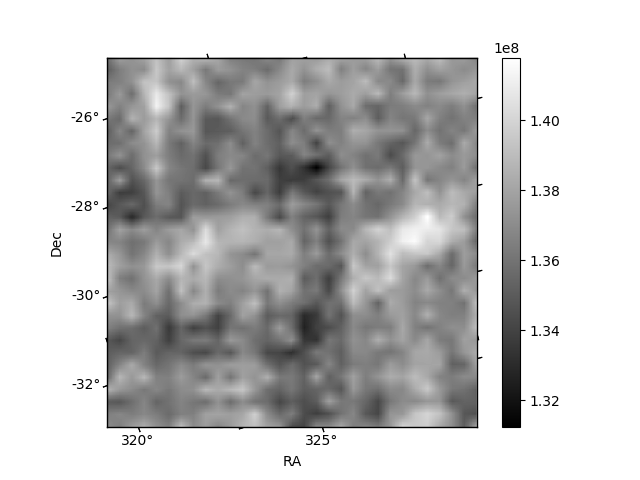
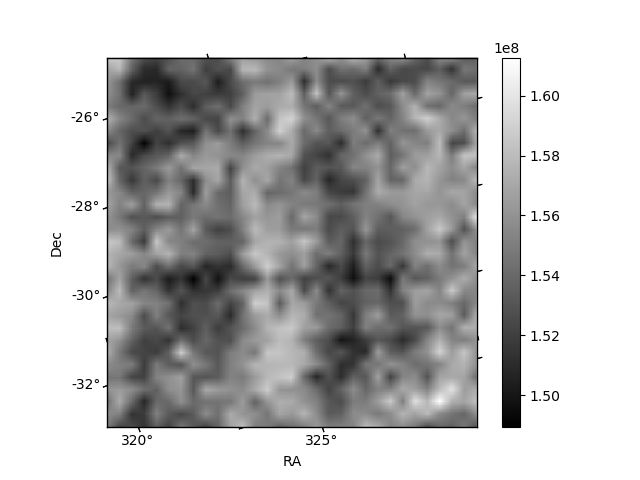
Histogram calculated using DETX and DETY for each event in the final _common_clean file
| Quadrant A | 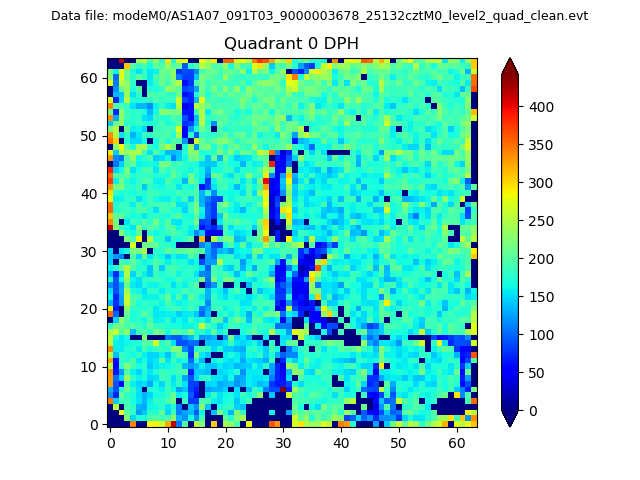 |
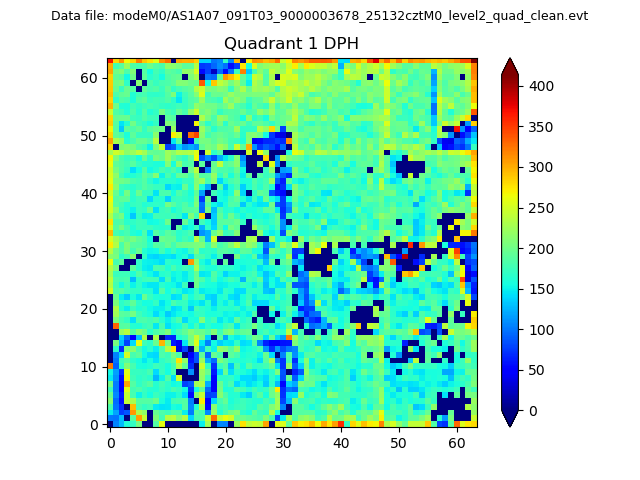 |
Quadrant B |
|---|---|---|---|
| Quadrant D | 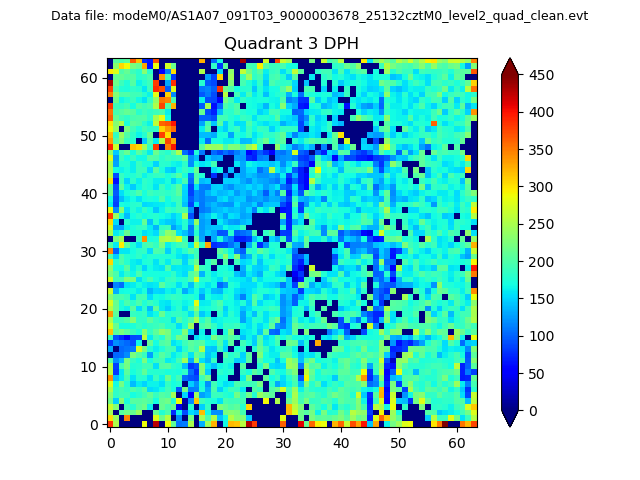 |
 |
Quadrant C |
| Plot type | Count rate plots | Images |
|---|---|---|
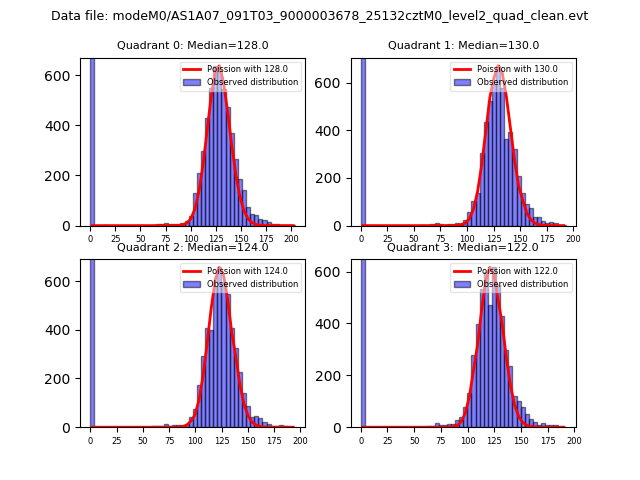
| Comparison with Poisson distribution Blue bars denote a histogram of data divided into 1 sec bins. Red curve is a Poisson curve with rate = median count rate of data. |
 |
 |
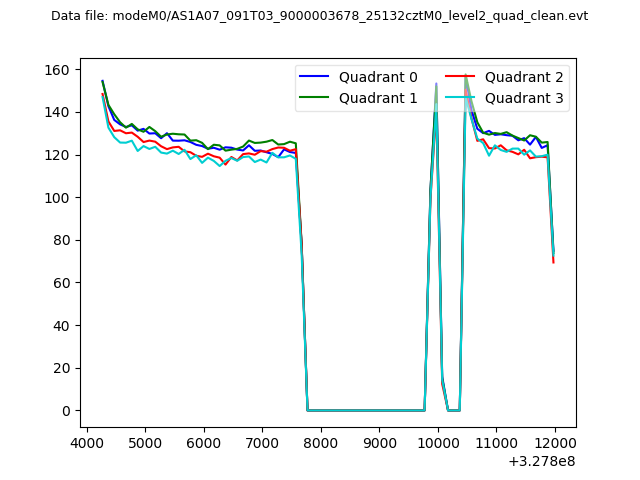
| Quadrant-wise count rates Data is divided into 100 sec bins |
 |
|
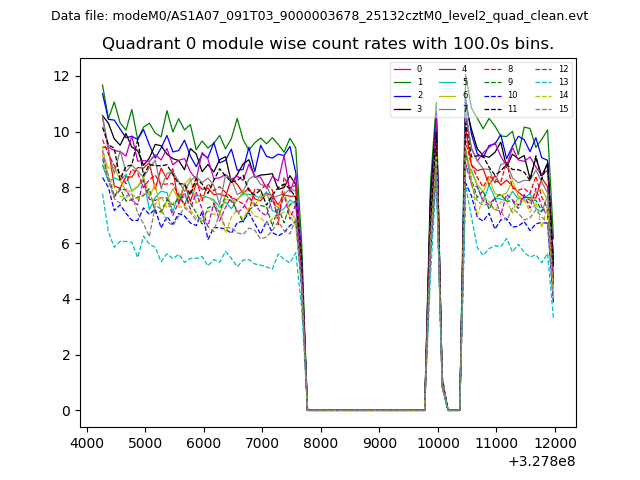
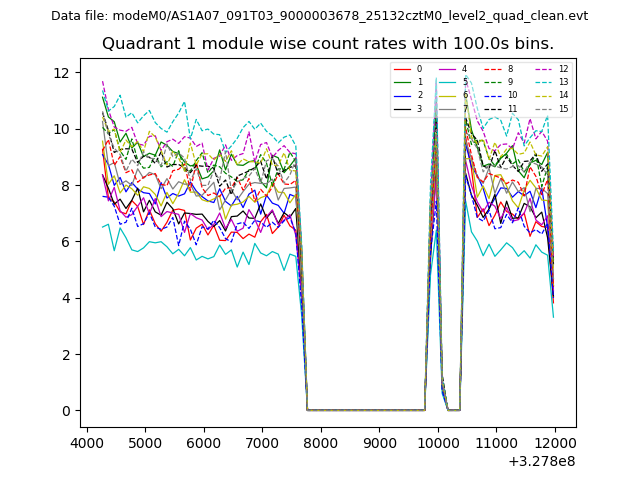
| Module-wise count rates for Quadrant A Data is divided into 100 sec bins |
 |
 |
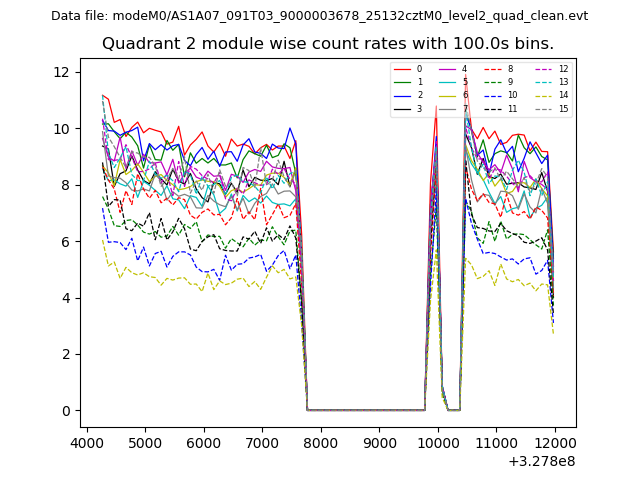
| Module-wise count rates for Quadrant B Data is divided into 100 sec bins |
 |
 |
| Module-wise count rates for Quadrant C Data is divided into 100 sec bins |
 |
 |
| Module-wise count rates for Quadrant D Data is divided into 100 sec bins |
 |
 |
| Parameter | Plot |
|---|---|
| CZT HV Monitor |  |
| D_VDD | 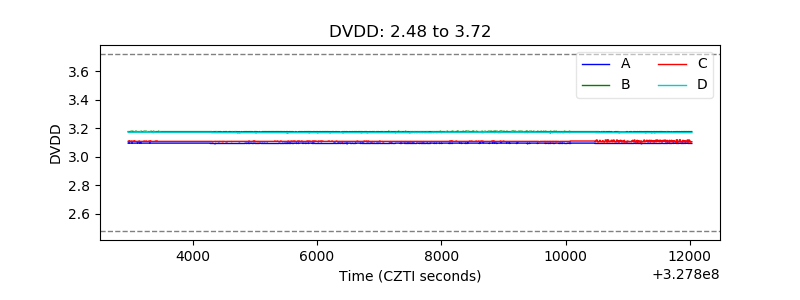 |
| Temperature 1 | 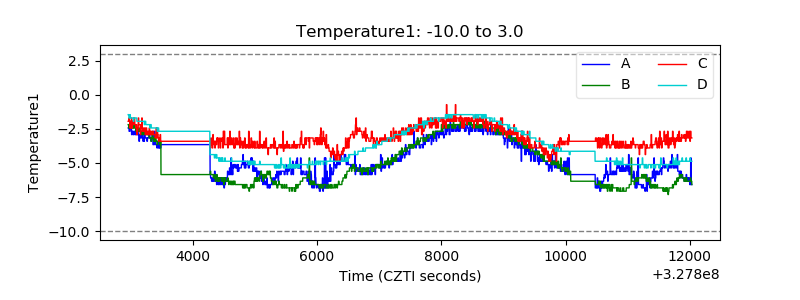 |
| Veto HV Monitor | 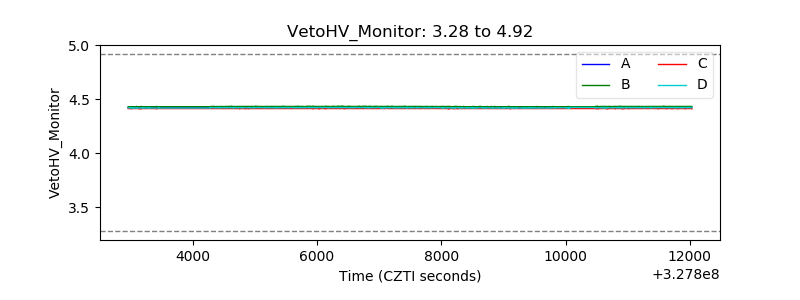 |
| Veto LLD | 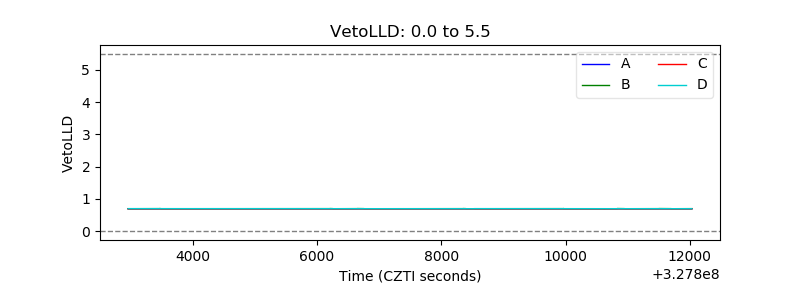 |
| Alpha Counter | 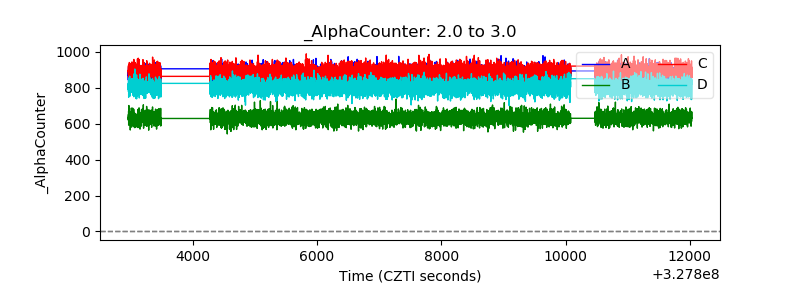 |
| _CPM_Rate | 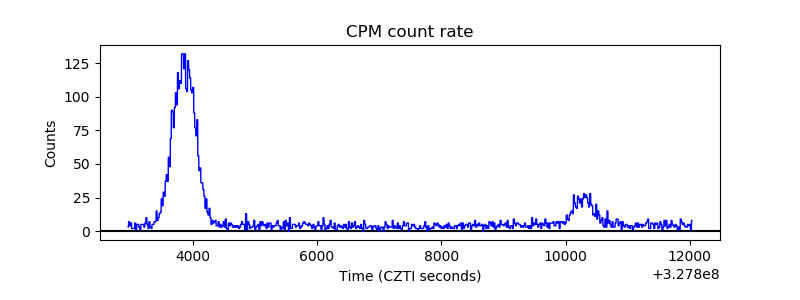 |
| CZT Counter | 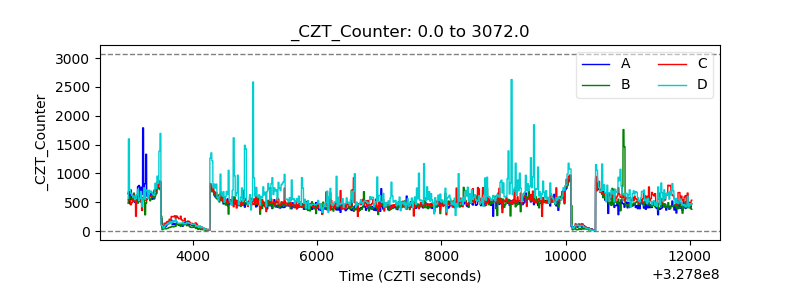 |
| +2.5 Volts monitor | 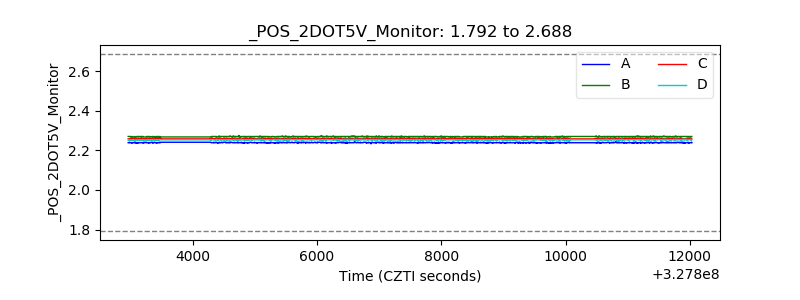 |
| +5 Volts monitor | 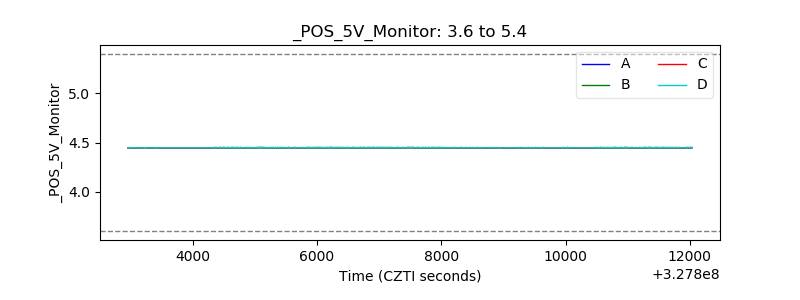 |
| _ROLL_ROT | 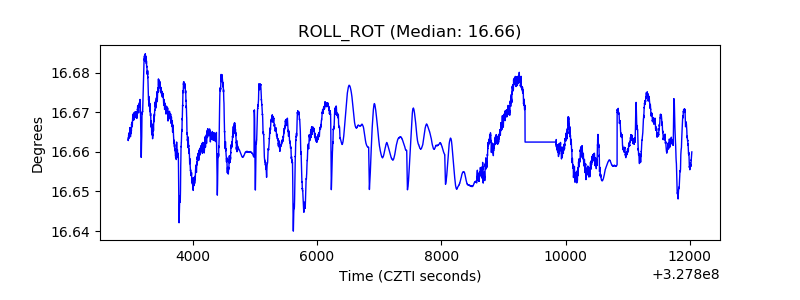 |
| _Roll_DEC | 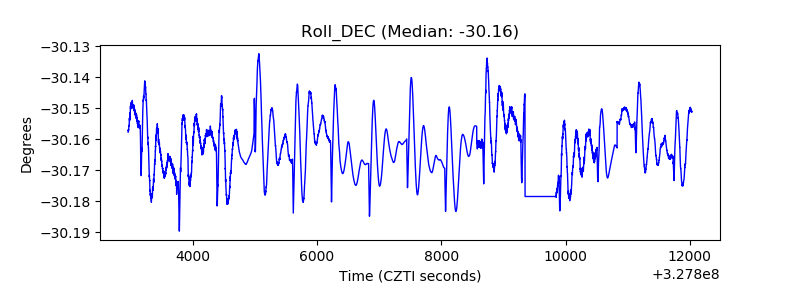 |
| _Roll_RA | 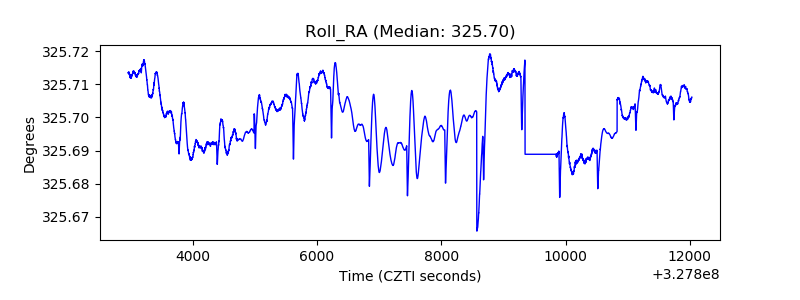 |
| Veto Counter | 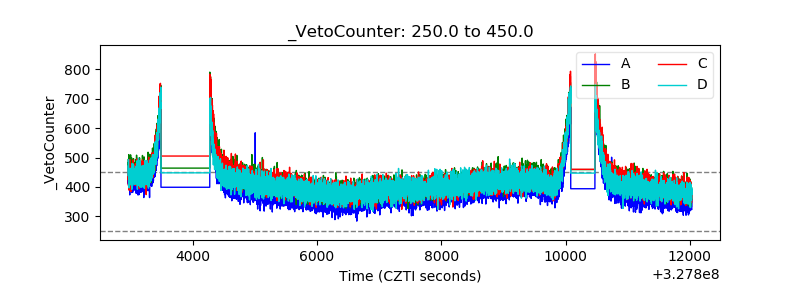 |