| Param | Original file | Final file |
|---|---|---|
| Filename | modeM0/AS1A07_091T03_9000003678_25133cztM0_level2.evt | modeM0/AS1A07_091T03_9000003678_25133cztM0_level2_quad_clean.evt |
| Size (bytes) | 587,278,080 | 112,072,320 |
| Size | 560.1 MB | 106.9 MB |
| Events in quadrant A | 3,783,483 | 725,878 |
| Events in quadrant B | 3,914,419 | 734,218 |
| Events in quadrant C | 4,512,644 | 698,023 |
| Events in quadrant D | 5,040,097 | 687,447 |
| Mode M9 | |||
|---|---|---|---|
| Quadrant | BADHDUFLAG | Total packets | Discarded packets |
| A | 0 | 5 | 0 |
| B | 0 | 5 | 0 |
| C | 0 | 5 | 0 |
| D | 0 | 5 | 0 |
| Mode M0 | |||
|---|---|---|---|
| Quadrant | BADHDUFLAG | Total packets | Discarded packets |
| A | 0 | 16435 | 0 |
| B | 0 | 16742 | 0 |
| C | 0 | 18315 | 0 |
| D | 0 | 20186 | 0 |
| Quadrant | Total seconds | Saturated seconds | Saturation percentage |
|---|---|---|---|
| A | 7881 | 121 | 1.535338% |
| B | 7882 | 187 | 2.372494% |
| C | 7882 | 255 | 3.235219% |
| D | 7882 | 308 | 3.907638% |
Noise dominated data is calculated using 1-second bins in cleaned event files. If a bin has >2000 counts, and if more than 50% of those come from <1% of pixels, then it is considered to be noise-dominated and hence unusable.
| Quadrant | # 1 sec bins | Bins with >0 counts | Bins with >2000 counts | High rate bins dominated by noise | Noise dominated (total time) | Noise dominated (detector-on time) | Marked lightcurve |
|---|---|---|---|---|---|---|---|
| A | 8491 | 7883 | 0 | 0 | 0.00% | 0.00% | 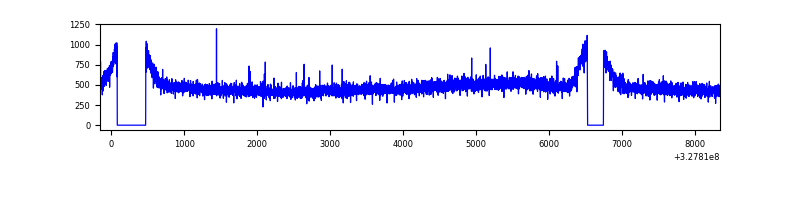 |
| B | 8492 | 7884 | 4 | 4 | 0.05% | 0.05% |  |
| C | 8492 | 7883 | 1 | 1 | 0.01% | 0.01% | 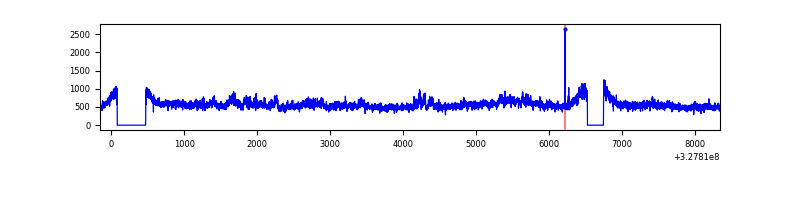 |
| D | 8492 | 7883 | 159 | 159 | 1.87% | 2.02% |  |
Top three noisy pixels from each quadrant. If the there are fewer than three noisy pixels in the level2.evt file, extra rows are filled as -1
| Pixel properties | Quadrant properties | ||||||
|---|---|---|---|---|---|---|---|
| Quadrant | DetID | PixID | Counts | Sigma | Mean | Median | Sigma |
| A | 13 | 254 | 11941 | 55.67 | 980 | 955 | 197.3 |
| A | 3 | 137 | 9317 | 42.38 | 980 | 955 | 197.3 |
| A | 0 | 226 | 8208 | 36.76 | 980 | 955 | 197.3 |
| B | 10 | 246 | 42265 | 218.56 | 973 | 946 | 189.0 |
| B | 0 | 190 | 27962 | 142.91 | 973 | 946 | 189.0 |
| B | 12 | 111 | 23607 | 119.87 | 973 | 946 | 189.0 |
| C | 7 | 247 | 643281 | 2863.64 | 946 | 950 | 224.3 |
| C | 14 | 238 | 146972 | 651.0 | 946 | 950 | 224.3 |
| C | 8 | 128 | 14901 | 62.2 | 946 | 950 | 224.3 |
| D | 1 | 52 | 1018867 | 4383.39 | 952 | 926 | 232.2 |
| D | 8 | 195 | 286264 | 1228.7 | 952 | 926 | 232.2 |
| D | 2 | 244 | 80673 | 343.4 | 952 | 926 | 232.2 |
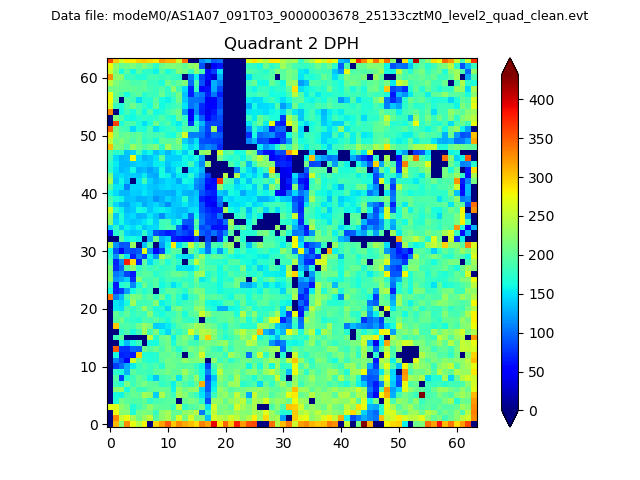
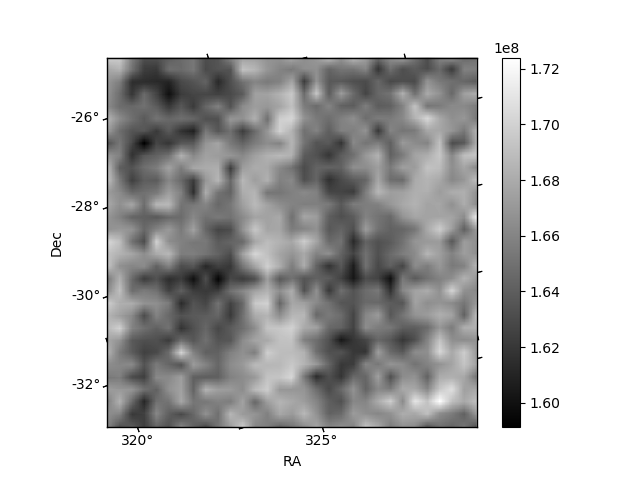
Histogram calculated using DETX and DETY for each event in the final _common_clean file
| Quadrant A | 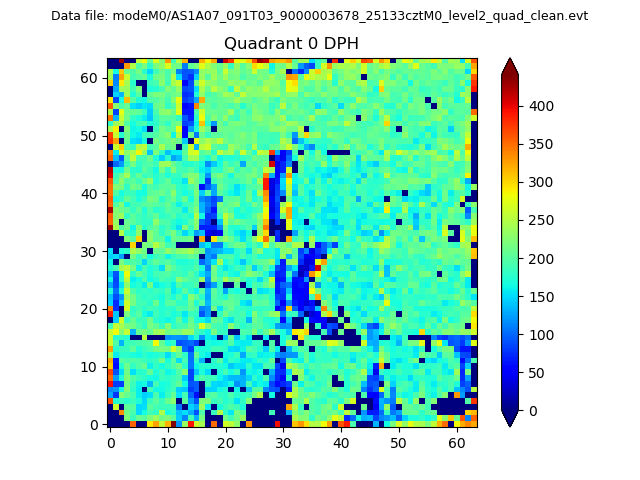 |
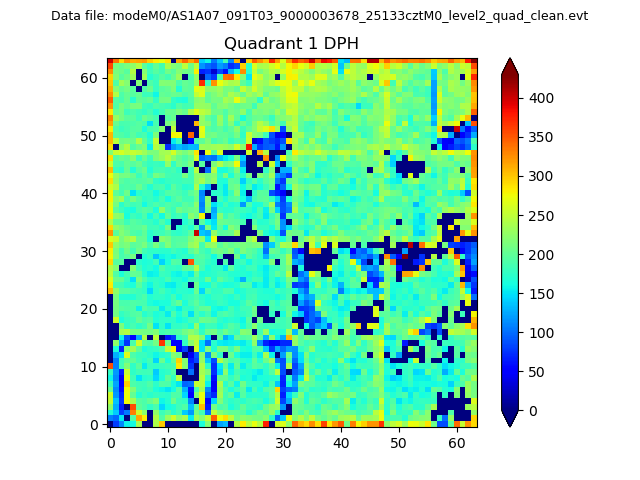 |
Quadrant B |
|---|---|---|---|
| Quadrant D | 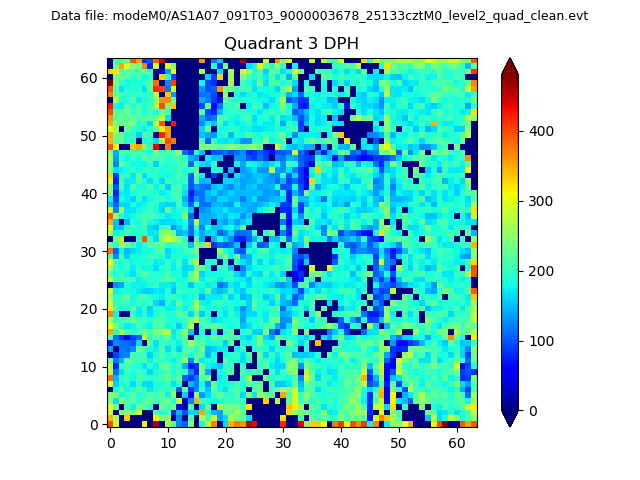 |
 |
Quadrant C |
| Plot type | Count rate plots | Images |
|---|---|---|
| Comparison with Poisson distribution Blue bars denote a histogram of data divided into 1 sec bins. Red curve is a Poisson curve with rate = median count rate of data. |
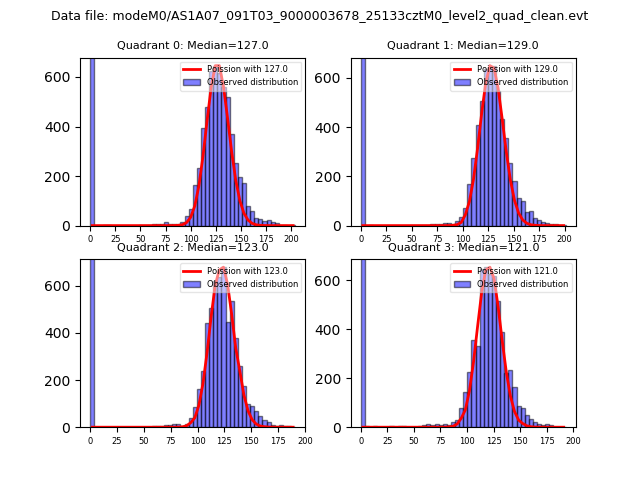 |
 |
| Quadrant-wise count rates Data is divided into 100 sec bins |
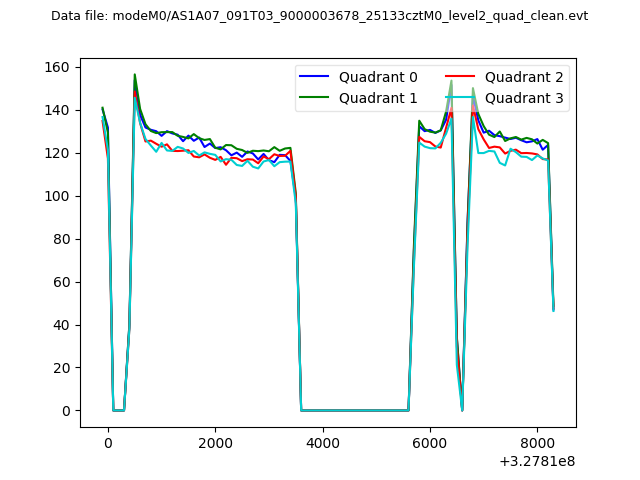 |
|
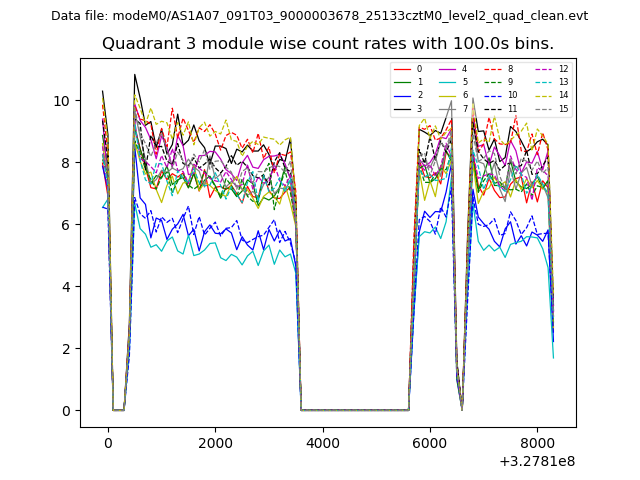
| Module-wise count rates for Quadrant A Data is divided into 100 sec bins |
 |
 |
| Module-wise count rates for Quadrant B Data is divided into 100 sec bins |
 |
 |
| Module-wise count rates for Quadrant C Data is divided into 100 sec bins |
 |
 |
| Module-wise count rates for Quadrant D Data is divided into 100 sec bins |
 |
 |
| Parameter | Plot |
|---|---|
| CZT HV Monitor |  |
| D_VDD | 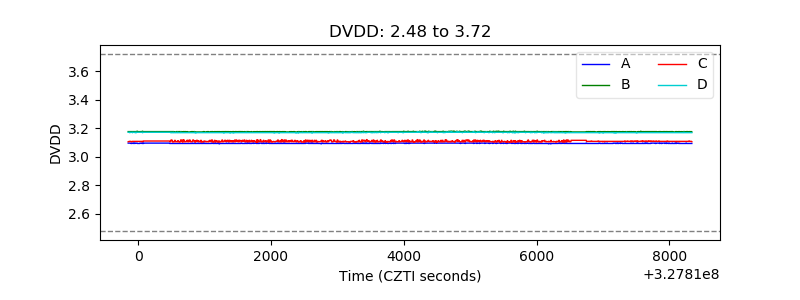 |
| Temperature 1 | 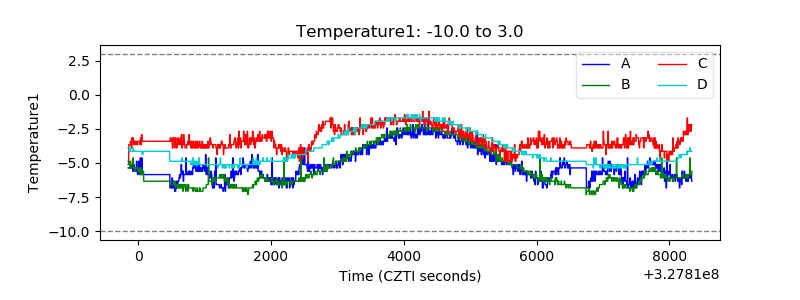 |
| Veto HV Monitor | 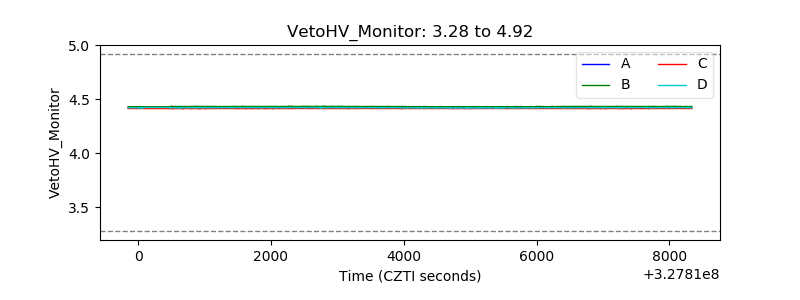 |
| Veto LLD | 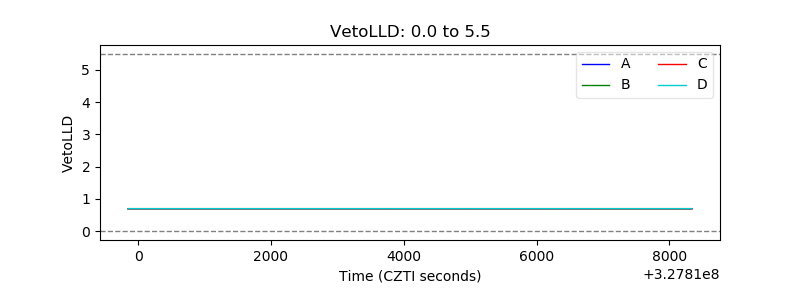 |
| Alpha Counter | 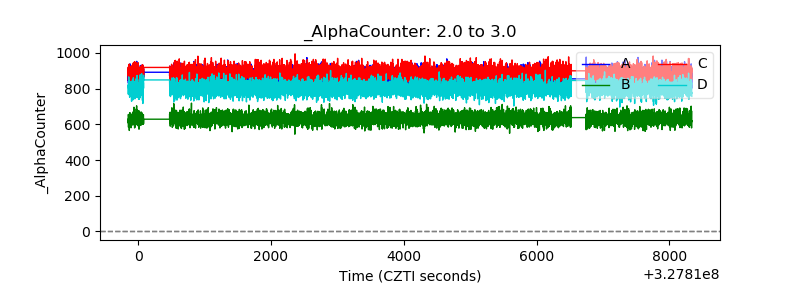 |
| _CPM_Rate | 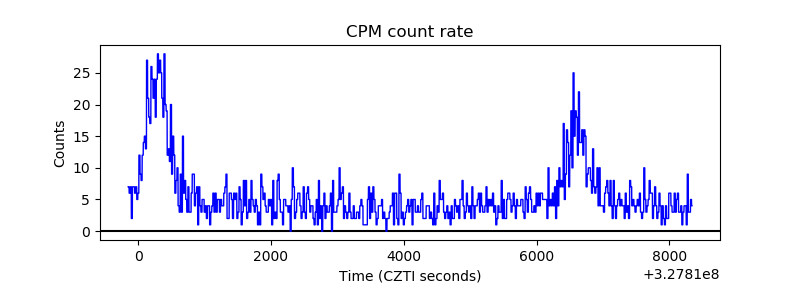 |
| CZT Counter | 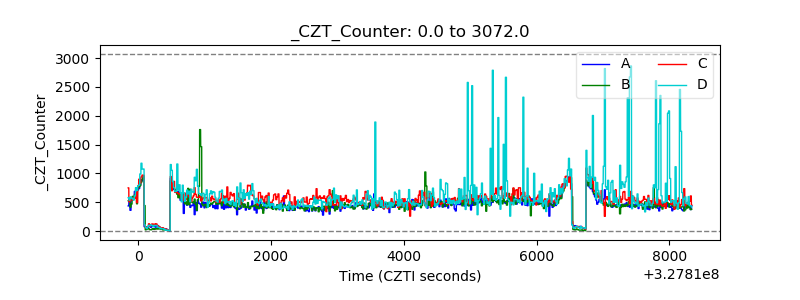 |
| +2.5 Volts monitor |  |
| +5 Volts monitor |  |
| _ROLL_ROT | 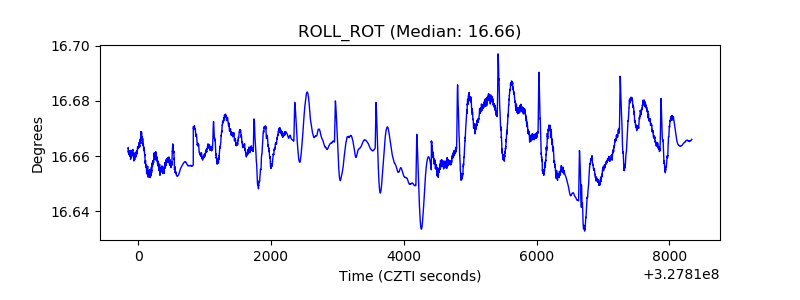 |
| _Roll_DEC | 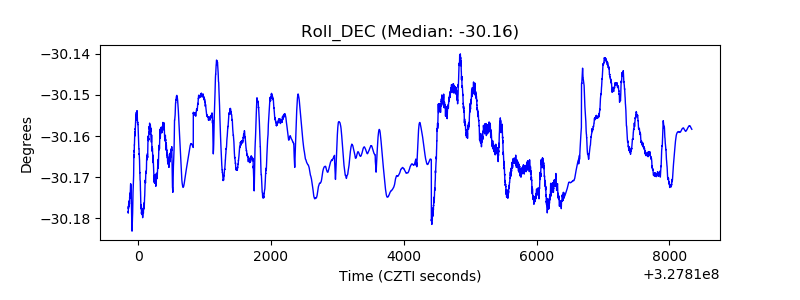 |
| _Roll_RA | 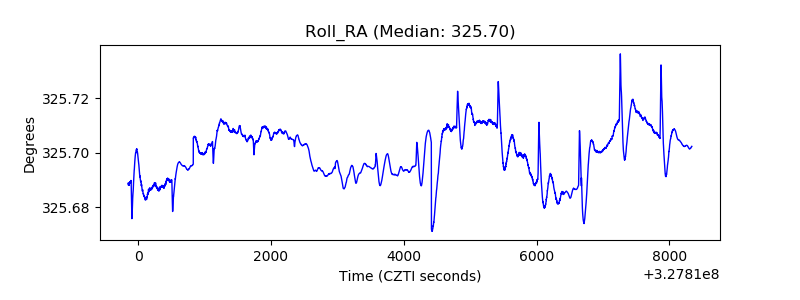 |
| Veto Counter | 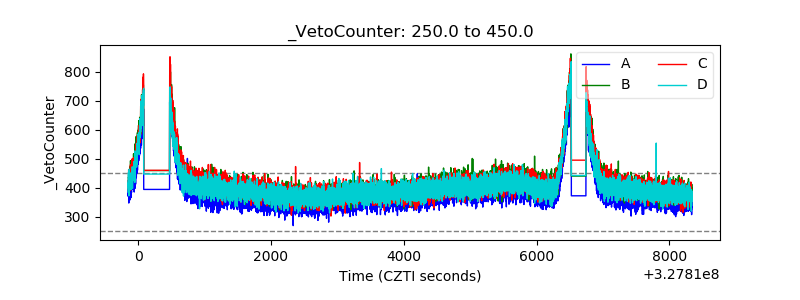 |