| Param | Original file | Final file |
|---|---|---|
| Filename | modeM0/AS1A07_091T03_9000003678_25136cztM0_level2.evt | modeM0/AS1A07_091T03_9000003678_25136cztM0_level2_quad_clean.evt |
| Size (bytes) | 838,391,040 | 136,506,240 |
| Size | 799.6 MB | 130.2 MB |
| Events in quadrant A | 5,139,452 | 861,867 |
| Events in quadrant B | 5,229,069 | 872,504 |
| Events in quadrant C | 6,367,608 | 829,338 |
| Events in quadrant D | 7,900,157 | 798,561 |
| Mode M9 | |||
|---|---|---|---|
| Quadrant | BADHDUFLAG | Total packets | Discarded packets |
| A | 0 | 4 | 0 |
| B | 0 | 4 | 0 |
| C | 0 | 4 | 0 |
| D | 0 | 4 | 0 |
| Mode M0 | |||
|---|---|---|---|
| Quadrant | BADHDUFLAG | Total packets | Discarded packets |
| A | 0 | 22541 | 0 |
| B | 0 | 22740 | 0 |
| C | 0 | 25853 | 0 |
| D | 0 | 30750 | 0 |
| Quadrant | Total seconds | Saturated seconds | Saturation percentage |
|---|---|---|---|
| A | 11152 | 59 | 0.529053% |
| B | 11153 | 65 | 0.582803% |
| C | 11153 | 157 | 1.407693% |
| D | 11153 | 748 | 6.706716% |
Noise dominated data is calculated using 1-second bins in cleaned event files. If a bin has >2000 counts, and if more than 50% of those come from <1% of pixels, then it is considered to be noise-dominated and hence unusable.
| Quadrant | # 1 sec bins | Bins with >0 counts | Bins with >2000 counts | High rate bins dominated by noise | Noise dominated (total time) | Noise dominated (detector-on time) | Marked lightcurve |
|---|---|---|---|---|---|---|---|
| A | 11562 | 11153 | 1 | 1 | 0.01% | 0.01% | 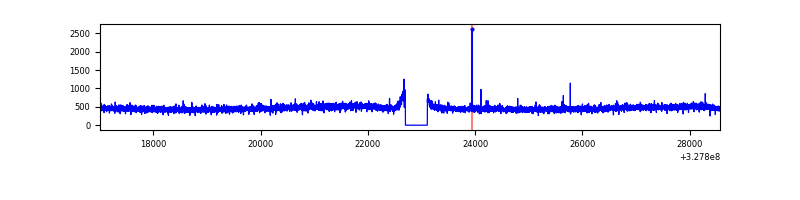 |
| B | 11563 | 11154 | 2 | 2 | 0.02% | 0.02% | 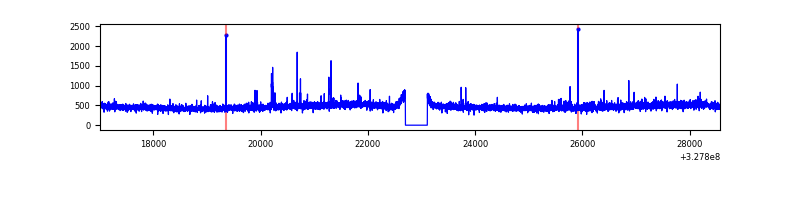 |
| C | 11563 | 11154 | 12 | 12 | 0.10% | 0.11% | 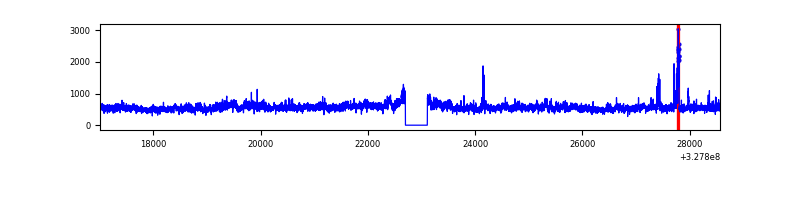 |
| D | 11563 | 11154 | 539 | 539 | 4.66% | 4.83% | 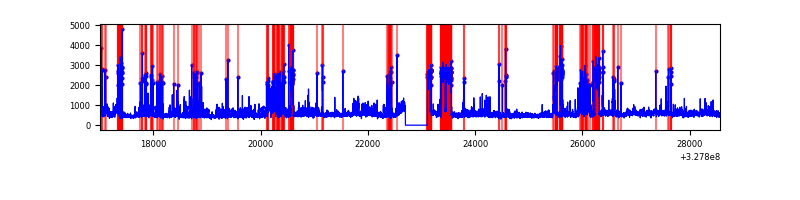 |
Top three noisy pixels from each quadrant. If the there are fewer than three noisy pixels in the level2.evt file, extra rows are filled as -1
| Pixel properties | Quadrant properties | ||||||
|---|---|---|---|---|---|---|---|
| Quadrant | DetID | PixID | Counts | Sigma | Mean | Median | Sigma |
| A | 13 | 254 | 16692 | 57.16 | 1328 | 1298 | 269.3 |
| A | 3 | 137 | 12418 | 41.29 | 1328 | 1298 | 269.3 |
| A | 0 | 226 | 11264 | 37.0 | 1328 | 1298 | 269.3 |
| B | 0 | 190 | 33516 | 127.08 | 1317 | 1284 | 253.6 |
| B | 12 | 111 | 31576 | 119.43 | 1317 | 1284 | 253.6 |
| B | 11 | 111 | 28534 | 107.44 | 1317 | 1284 | 253.6 |
| C | 7 | 247 | 1115466 | 3742.24 | 1273 | 1283 | 297.7 |
| C | 14 | 238 | 201850 | 673.65 | 1273 | 1283 | 297.7 |
| C | 9 | 54 | 43677 | 142.39 | 1273 | 1283 | 297.7 |
| D | 1 | 52 | 2354180 | 7525.87 | 1260 | 1220 | 312.6 |
| D | 8 | 195 | 494847 | 1578.85 | 1260 | 1220 | 312.6 |
| D | 2 | 244 | 132818 | 420.91 | 1260 | 1220 | 312.6 |
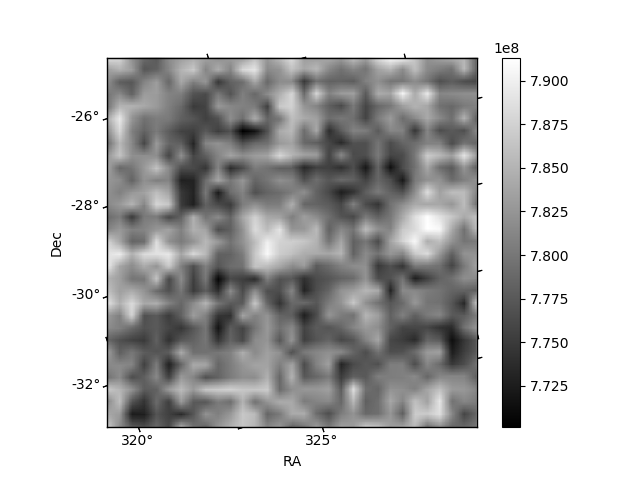
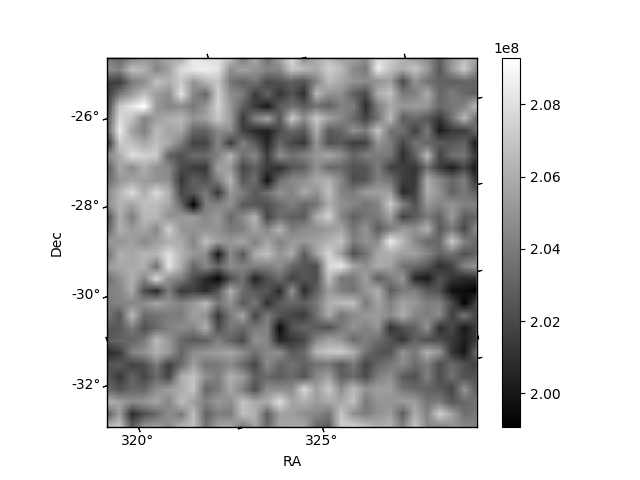
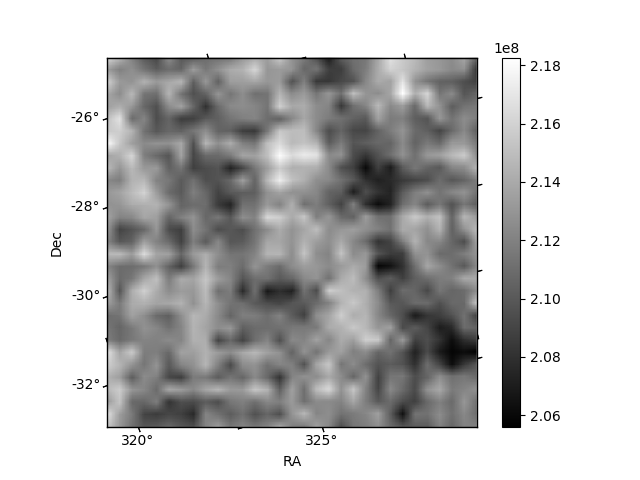
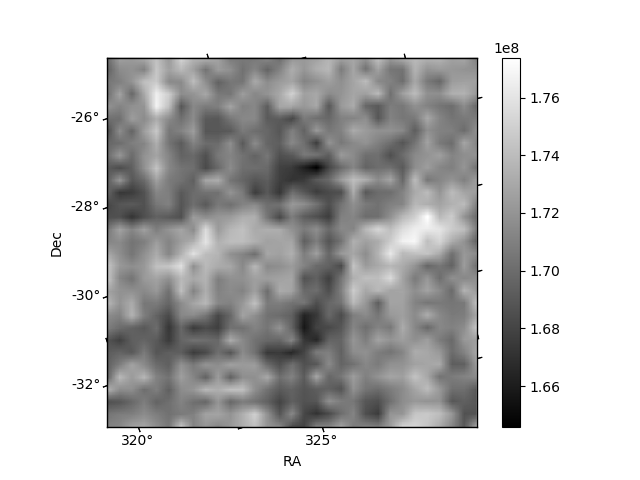
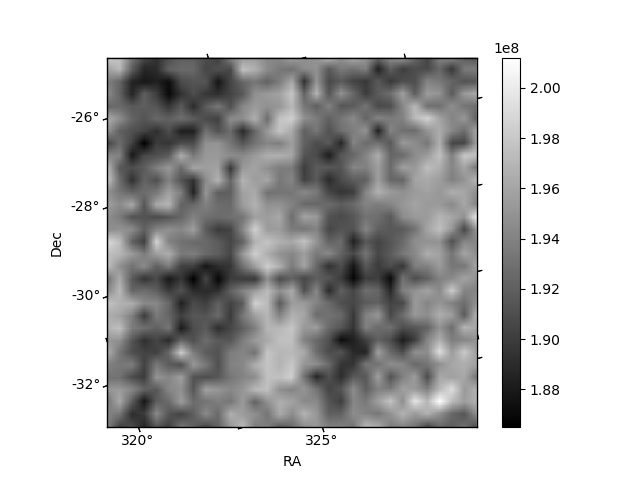
Histogram calculated using DETX and DETY for each event in the final _common_clean file
| Quadrant A | 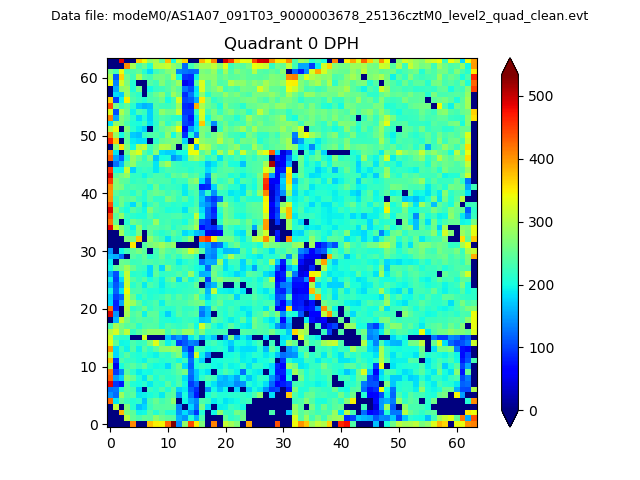 |
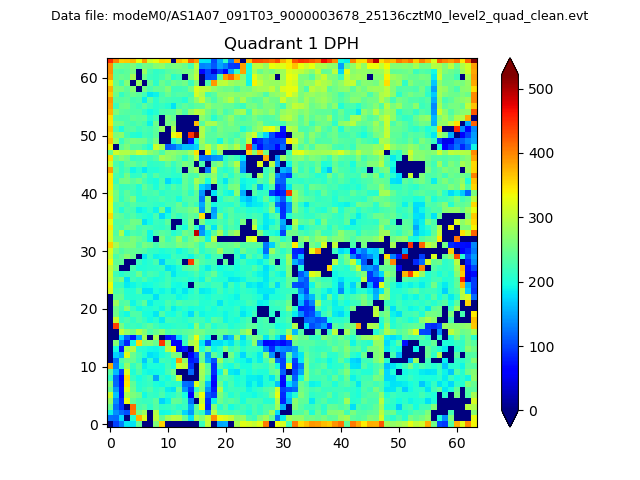 |
Quadrant B |
|---|---|---|---|
| Quadrant D |  |
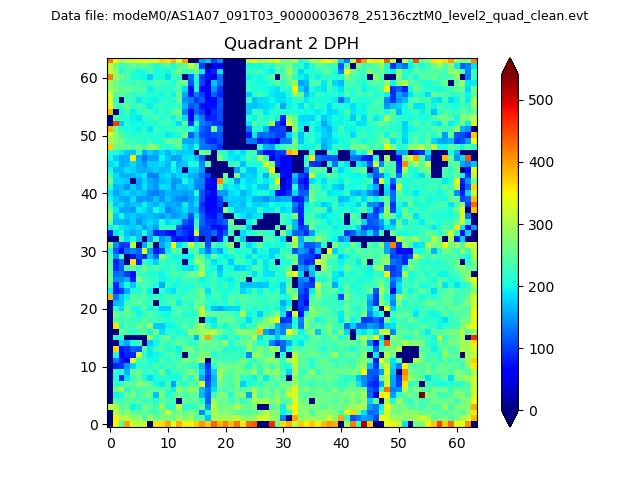 |
Quadrant C |
| Plot type | Count rate plots | Images |
|---|---|---|
| Comparison with Poisson distribution Blue bars denote a histogram of data divided into 1 sec bins. Red curve is a Poisson curve with rate = median count rate of data. |
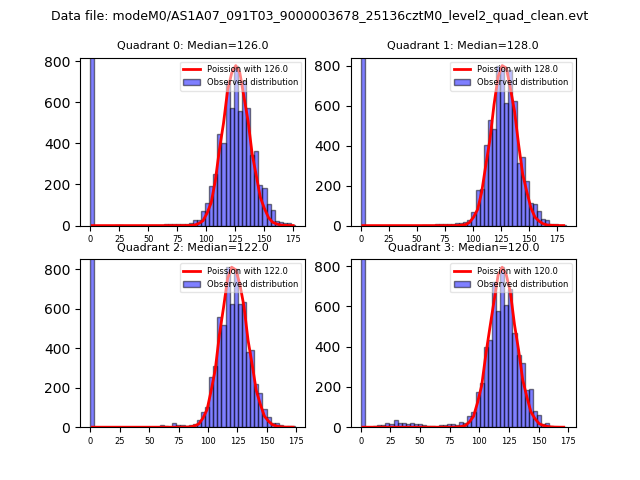 |
 |
| Quadrant-wise count rates Data is divided into 100 sec bins |
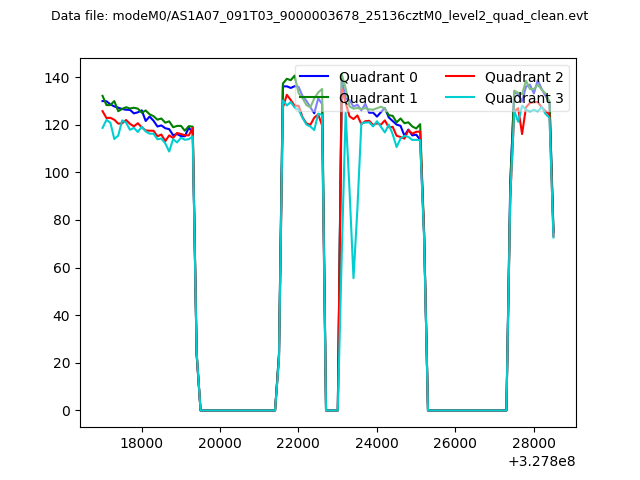 |
|
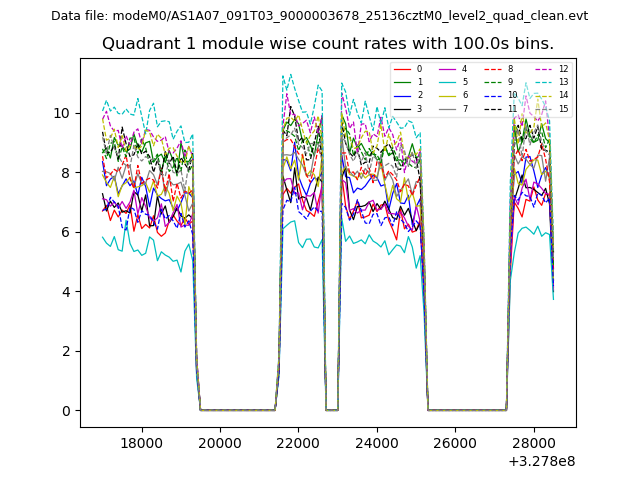
| Module-wise count rates for Quadrant A Data is divided into 100 sec bins |
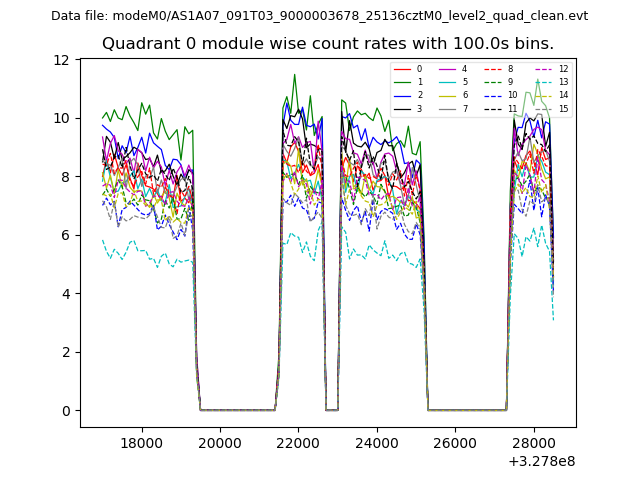 |
 |
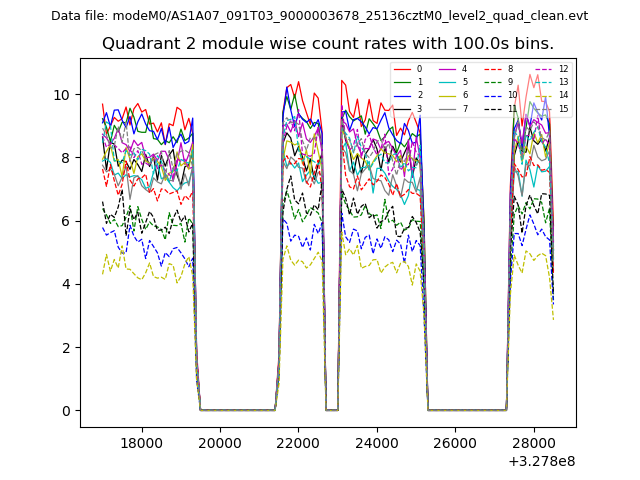
| Module-wise count rates for Quadrant B Data is divided into 100 sec bins |
 |
 |
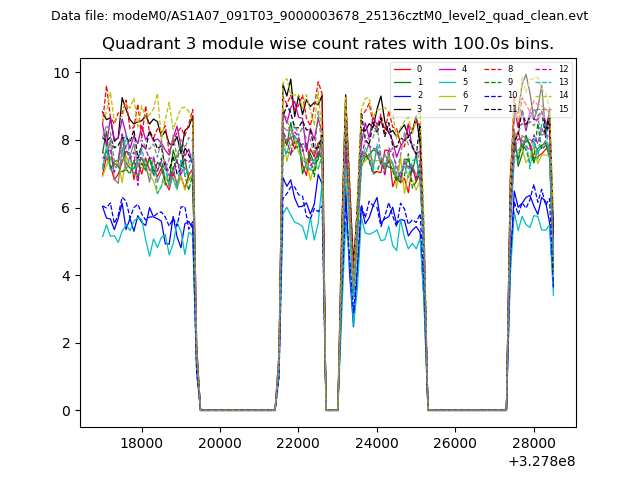
| Module-wise count rates for Quadrant C Data is divided into 100 sec bins |
 |
 |
| Module-wise count rates for Quadrant D Data is divided into 100 sec bins |
 |
 |
| Parameter | Plot |
|---|---|
| CZT HV Monitor | 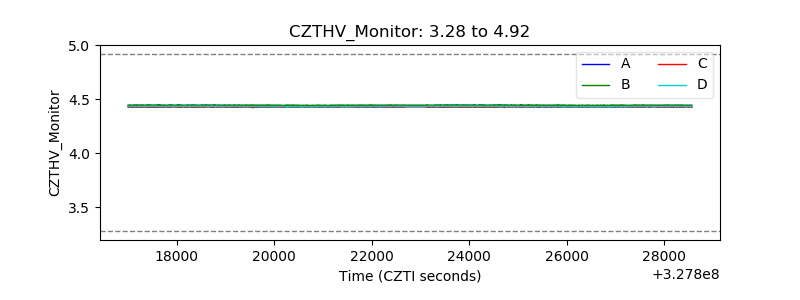 |
| D_VDD | 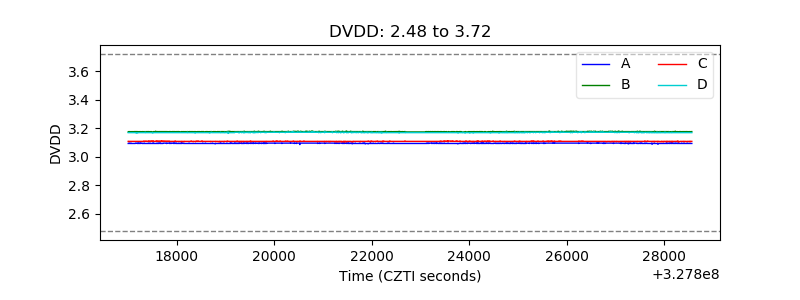 |
| Temperature 1 | 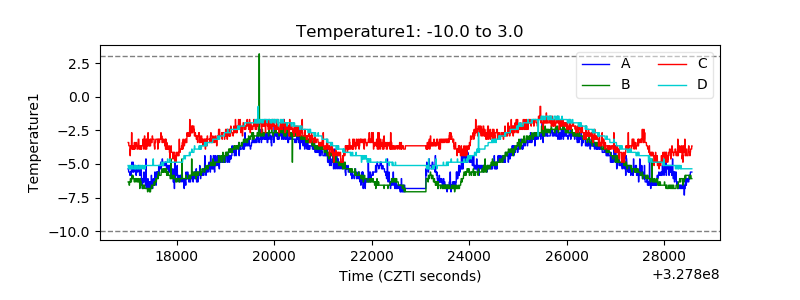 |
| Veto HV Monitor | 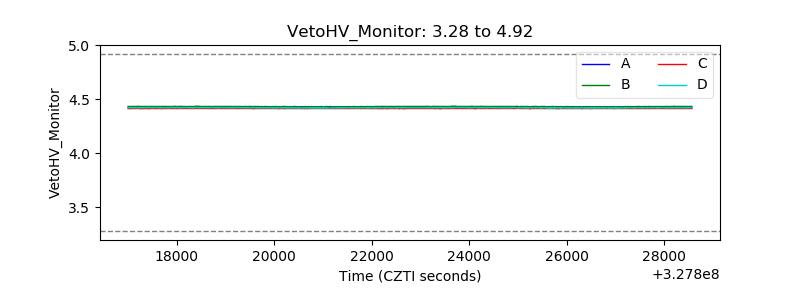 |
| Veto LLD | 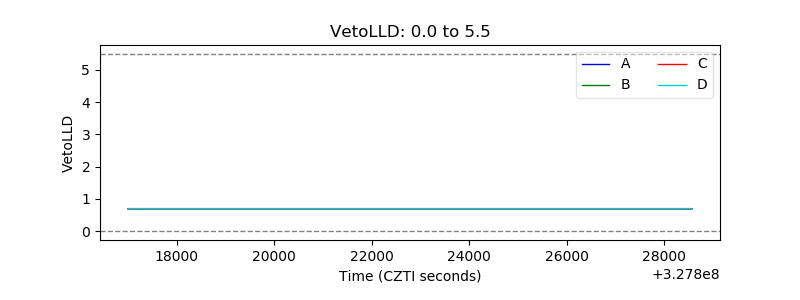 |
| Alpha Counter | 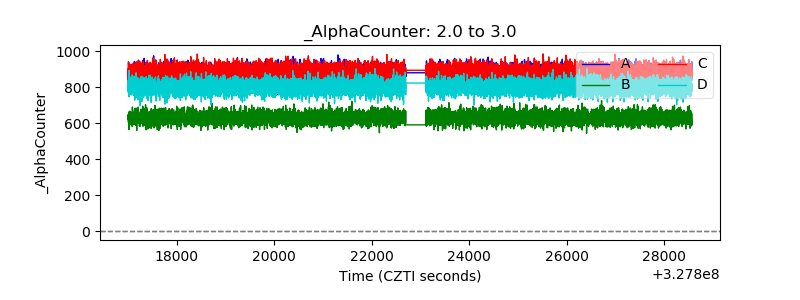 |
| _CPM_Rate | 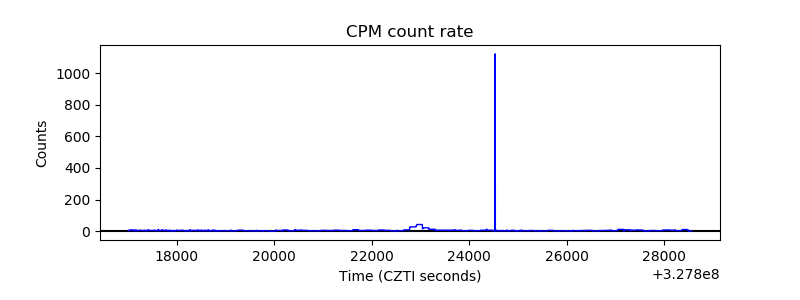 |
| CZT Counter | 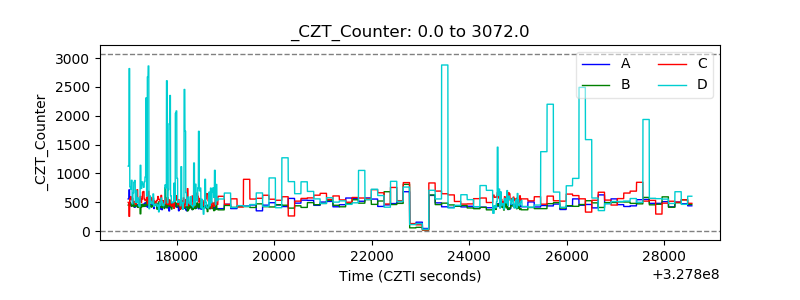 |
| +2.5 Volts monitor |  |
| +5 Volts monitor |  |
| _ROLL_ROT | 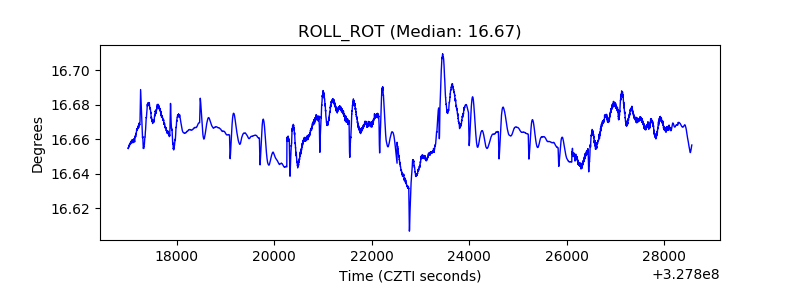 |
| _Roll_DEC | 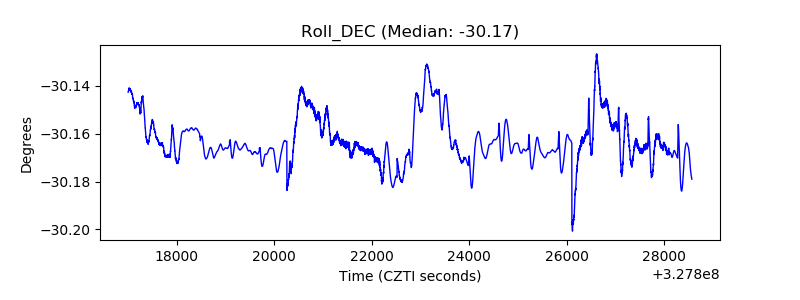 |
| _Roll_RA | 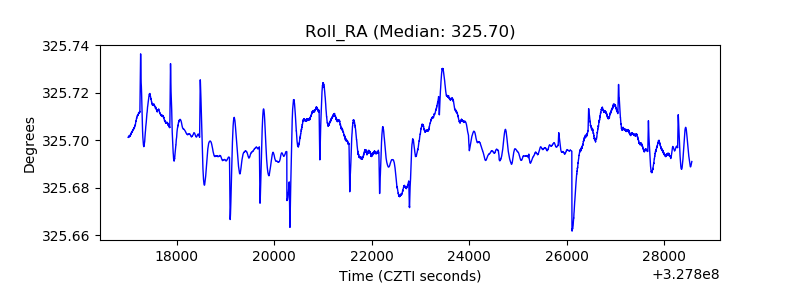 |
| Veto Counter | 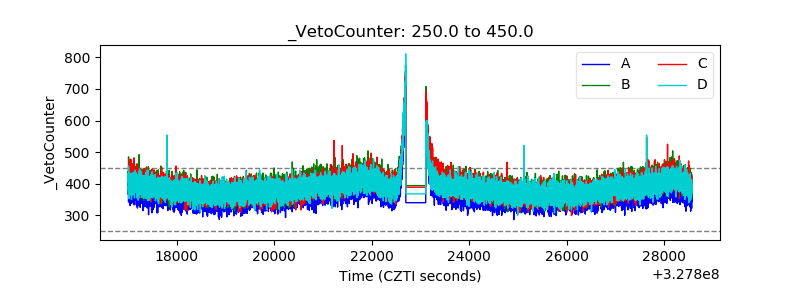 |