| Param | Original file | Final file |
|---|---|---|
| Filename | modeM0/AS1A08_003T16_9000003676cztM0_level2.fits | modeM0/AS1A08_003T16_9000003676cztM0_level2_quad_clean.evt |
| Size (bytes) | 248,941,440 | 138,513,600 |
| Size | 237.4 MB | 132.1 MB |
| Events in quadrant A | 1,589,008 | 689,748 |
| Events in quadrant B | 1,515,064 | 685,186 |
| Events in quadrant C | 1,523,412 | 644,314 |
| Events in quadrant D | 1,274,832 | 537,392 |
| Mode M9 | |||
|---|---|---|---|
| Quadrant | BADHDUFLAG | Total packets | Discarded packets |
| A | 0 | 59 | 0 |
| B | 0 | 59 | 0 |
| C | 0 | 59 | 0 |
| D | 0 | 59 | 0 |
| Mode SS | |||
|---|---|---|---|
| Quadrant | BADHDUFLAG | Total packets | Discarded packets |
| A | 0 | 484 | 0 |
| B | 0 | 484 | 0 |
| C | 0 | 484 | 0 |
| D | 0 | 484 | 0 |
| Mode M0 | |||
|---|---|---|---|
| Quadrant | BADHDUFLAG | Total packets | Discarded packets |
| A | 0 | 50680 | 0 |
| B | 0 | 51386 | 0 |
| C | 0 | 60354 | 0 |
| D | 0 | 84201 | 0 |
| Quadrant | Total seconds | Saturated seconds | Saturation percentage |
|---|---|---|---|
| A | 23785 | 282 | 1.185621% |
| B | 23785 | 323 | 1.357999% |
| C | 23785 | 522 | 2.194661% |
| D | 23784 | 2547 | 10.708880% |
Noise dominated data is calculated using 1-second bins in cleaned event files. If a bin has >2000 counts, and if more than 50% of those come from <1% of pixels, then it is considered to be noise-dominated and hence unusable.
| Quadrant | # 1 sec bins | Bins with >0 counts | Bins with >2000 counts | High rate bins dominated by noise | Noise dominated (total time) | Noise dominated (detector-on time) | Marked lightcurve |
|---|---|---|---|---|---|---|---|
| A | 29610 | 23781 | 0 | 0 | 0.00% | 0.00% |  |
| B | 29610 | 23780 | 0 | 0 | 0.00% | 0.00% |  |
| C | 29610 | 23781 | 0 | 0 | 0.00% | 0.00% |  |
| D | 29609 | 23777 | 0 | 0 | 0.00% | 0.00% |  |
Top three noisy pixels from each quadrant. If the there are fewer than three noisy pixels in the level2.evt file, extra rows are filled as -1
| Pixel properties | Quadrant properties | ||||||
|---|---|---|---|---|---|---|---|
| Quadrant | DetID | PixID | Counts | Sigma | Mean | Median | Sigma |
| A | 0 | 29 | 1499 | 10.73 | 414 | 389 | 103.5 |
| A | 7 | 110 | 1250 | 8.32 | 414 | 389 | 103.5 |
| A | 0 | 30 | 1203 | 7.87 | 414 | 389 | 103.5 |
| B | 2 | 9 | 1173 | 9.69 | 400 | 383 | 81.5 |
| B | 5 | 128 | 1007 | 7.66 | 400 | 383 | 81.5 |
| B | 14 | 254 | 987 | 7.41 | 400 | 383 | 81.5 |
| C | 1 | 81 | 1144 | 7.35 | 401 | 378 | 104.3 |
| C | 1 | 80 | 1120 | 7.12 | 401 | 378 | 104.3 |
| C | 3 | 202 | 1092 | 6.85 | 401 | 378 | 104.3 |
| D | 3 | 14 | 926 | 6.14 | 363 | 332 | 96.8 |
| D | 7 | 3 | 912 | 5.99 | 363 | 332 | 96.8 |
| D | 10 | 189 | 903 | 5.9 | 363 | 332 | 96.8 |
Histogram calculated using DETX and DETY for each event in the final _common_clean file
| Quadrant A | 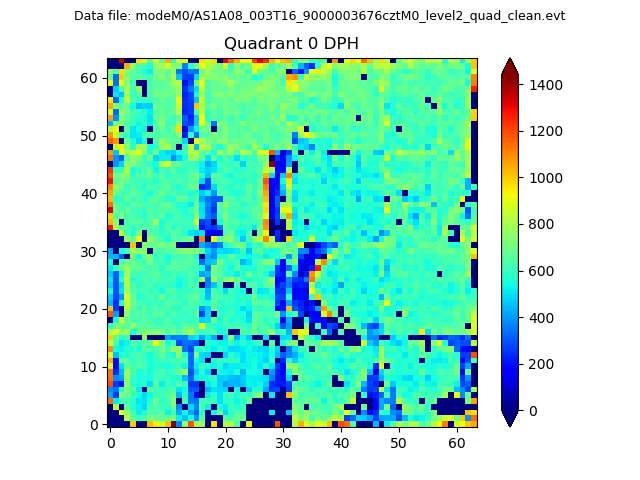 |
 |
Quadrant B |
|---|---|---|---|
| Quadrant D | 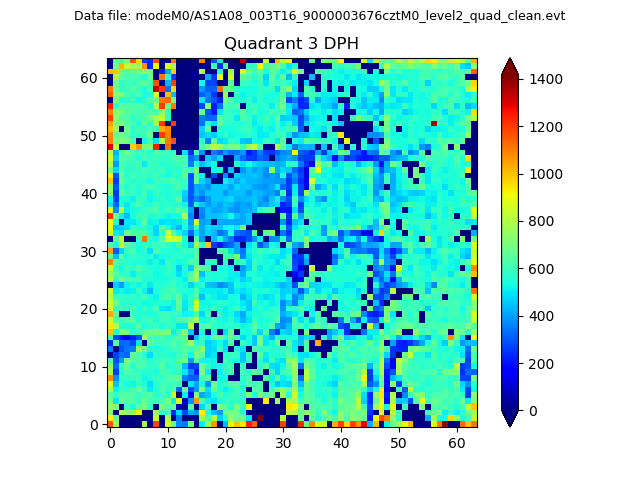 |
 |
Quadrant C |
| Plot type | Count rate plots | Images |
|---|---|---|
| Comparison with Poisson distribution Blue bars denote a histogram of data divided into 1 sec bins. Red curve is a Poisson curve with rate = median count rate of data. |
 |
 |
| Quadrant-wise count rates Data is divided into 100 sec bins |
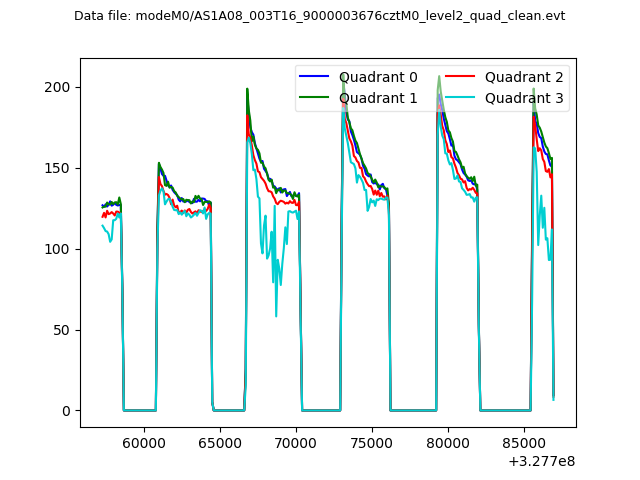 |
|
| Module-wise count rates for Quadrant A Data is divided into 100 sec bins |
 |
 |
| Module-wise count rates for Quadrant B Data is divided into 100 sec bins |
 |
 |
| Module-wise count rates for Quadrant C Data is divided into 100 sec bins |
 |
 |
| Module-wise count rates for Quadrant D Data is divided into 100 sec bins |
 |
 |
| Parameter | Plot |
|---|---|
| CZT HV Monitor |  |
| D_VDD |  |
| Temperature 1 |  |
| Veto HV Monitor |  |
| Veto LLD | 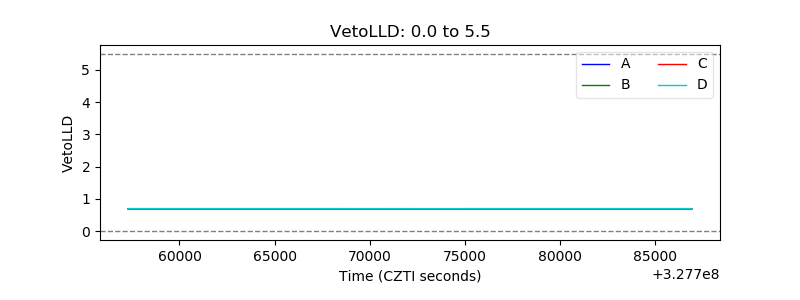 |
| Alpha Counter |  |
| _CPM_Rate |  |
| CZT Counter |  |
| +2.5 Volts monitor |  |
| +5 Volts monitor |  |
| _ROLL_ROT |  |
| _Roll_DEC |  |
| _Roll_RA |  |
| Veto Counter |  |