| Param | Original file | Final file |
|---|---|---|
| Filename | modeM0/AS1A08_003T16_9000003676_25123cztM0_level2.evt | modeM0/AS1A08_003T16_9000003676_25123cztM0_level2_quad_clean.evt |
| Size (bytes) | 310,236,480 | 48,268,800 |
| Size | 295.9 MB | 46.0 MB |
| Events in quadrant A | 1,817,648 | 311,620 |
| Events in quadrant B | 1,878,941 | 312,726 |
| Events in quadrant C | 2,376,753 | 295,710 |
| Events in quadrant D | 3,073,528 | 283,128 |
| Mode M9 | |||
|---|---|---|---|
| Quadrant | BADHDUFLAG | Total packets | Discarded packets |
| A | 0 | 10 | 0 |
| B | 0 | 10 | 0 |
| C | 0 | 10 | 0 |
| D | 0 | 10 | 0 |
| Mode M0 | |||
|---|---|---|---|
| Quadrant | BADHDUFLAG | Total packets | Discarded packets |
| A | 0 | 7748 | 0 |
| B | 0 | 7895 | 0 |
| C | 0 | 10034 | 0 |
| D | 0 | 11702 | 0 |
| Quadrant | Total seconds | Saturated seconds | Saturation percentage |
|---|---|---|---|
| A | 3650 | 52 | 1.424658% |
| B | 3650 | 68 | 1.863014% |
| C | 3650 | 102 | 2.794521% |
| D | 3649 | 203 | 5.563168% |
Noise dominated data is calculated using 1-second bins in cleaned event files. If a bin has >2000 counts, and if more than 50% of those come from <1% of pixels, then it is considered to be noise-dominated and hence unusable.
| Quadrant | # 1 sec bins | Bins with >0 counts | Bins with >2000 counts | High rate bins dominated by noise | Noise dominated (total time) | Noise dominated (detector-on time) | Marked lightcurve |
|---|---|---|---|---|---|---|---|
| A | 4590 | 3650 | 0 | 0 | 0.00% | 0.00% | 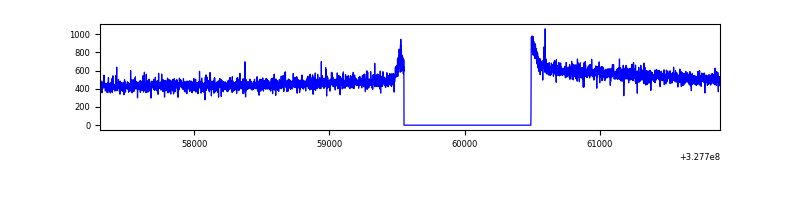 |
| B | 4590 | 3650 | 8 | 8 | 0.17% | 0.22% | 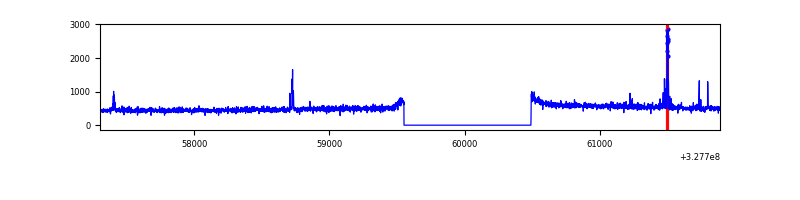 |
| C | 4590 | 3650 | 0 | 0 | 0.00% | 0.00% | 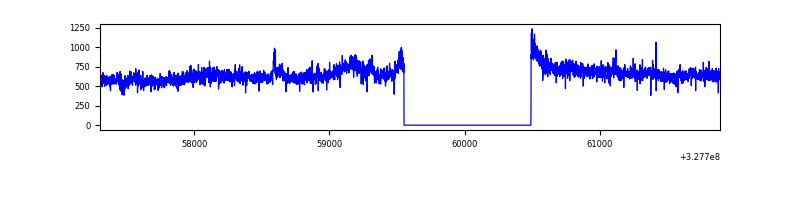 |
| D | 4589 | 3649 | 174 | 174 | 3.79% | 4.77% | 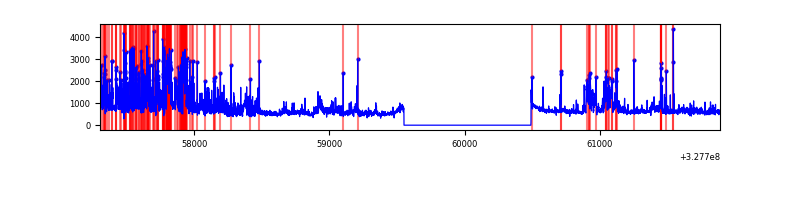 |
Top three noisy pixels from each quadrant. If the there are fewer than three noisy pixels in the level2.evt file, extra rows are filled as -1
| Pixel properties | Quadrant properties | ||||||
|---|---|---|---|---|---|---|---|
| Quadrant | DetID | PixID | Counts | Sigma | Mean | Median | Sigma |
| A | 13 | 254 | 6365 | 61.68 | 471 | 461 | 95.7 |
| A | 3 | 137 | 4432 | 41.49 | 471 | 461 | 95.7 |
| A | 0 | 226 | 3981 | 36.78 | 471 | 461 | 95.7 |
| B | 3 | 64 | 43801 | 473.96 | 465 | 455 | 91.5 |
| B | 12 | 111 | 11079 | 116.17 | 465 | 455 | 91.5 |
| B | 11 | 111 | 9894 | 103.21 | 465 | 455 | 91.5 |
| C | 7 | 247 | 553234 | 5154.77 | 448 | 452 | 107.2 |
| C | 14 | 238 | 70198 | 650.39 | 448 | 452 | 107.2 |
| C | 3 | 233 | 6589 | 57.23 | 448 | 452 | 107.2 |
| D | 12 | 235 | 606547 | 5433.52 | 449 | 435 | 111.6 |
| D | 12 | 33 | 263570 | 2358.89 | 449 | 435 | 111.6 |
| D | 8 | 195 | 162025 | 1448.58 | 449 | 435 | 111.6 |
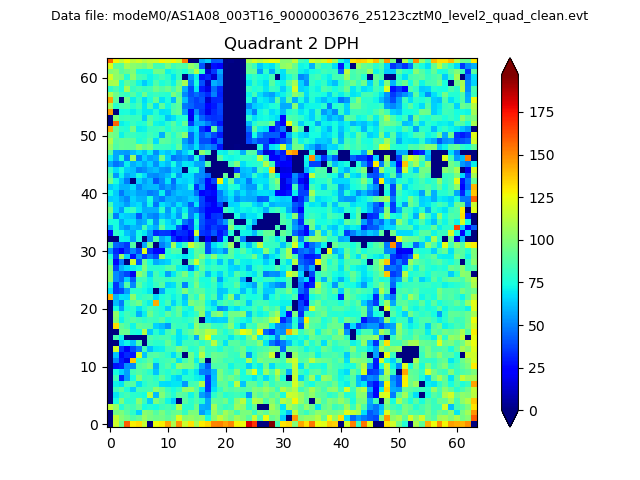
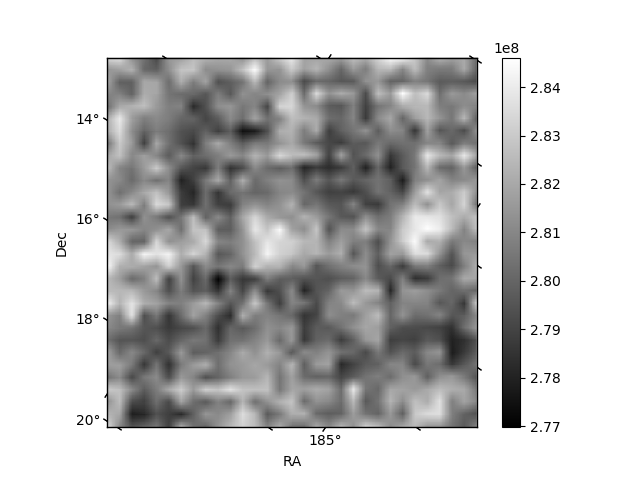
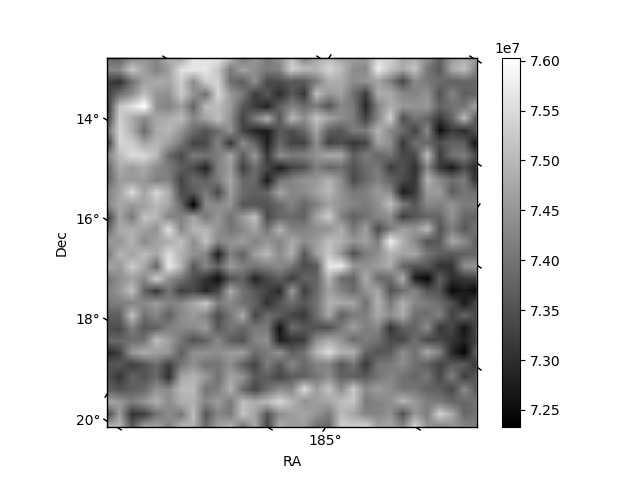
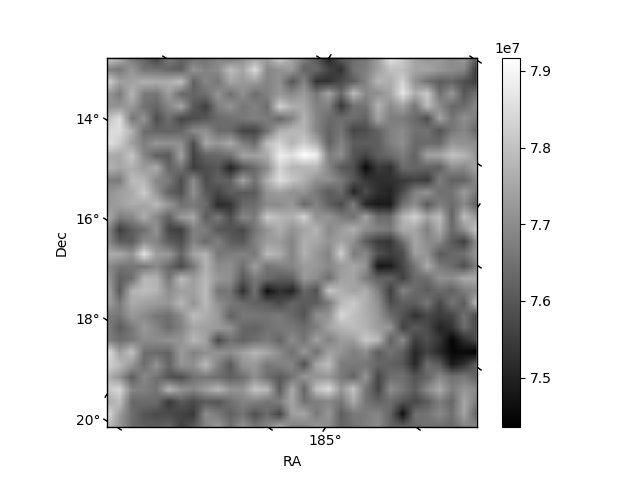
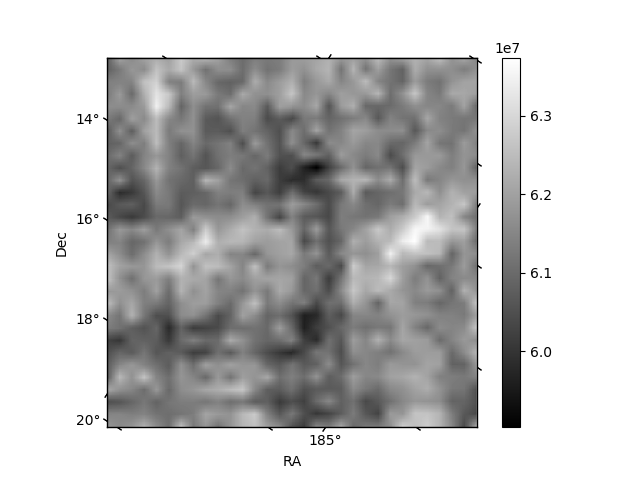
Histogram calculated using DETX and DETY for each event in the final _common_clean file
| Quadrant A | 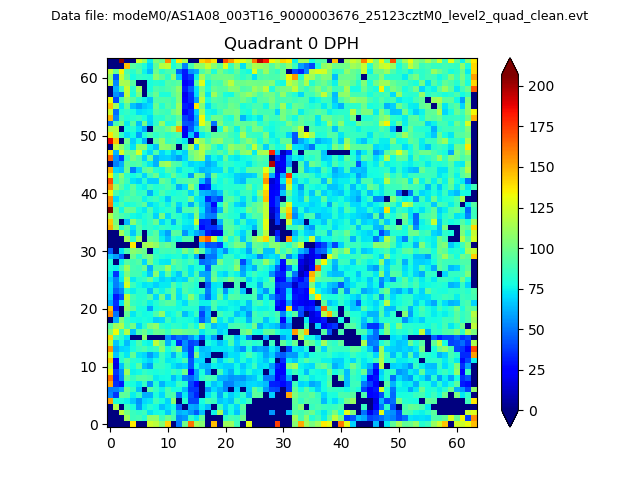 |
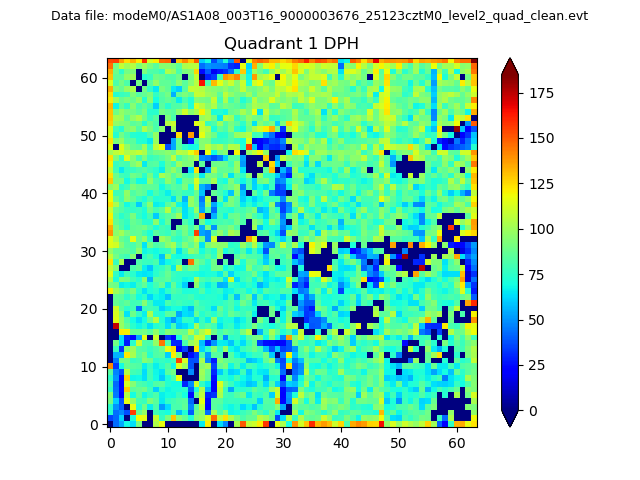 |
Quadrant B |
|---|---|---|---|
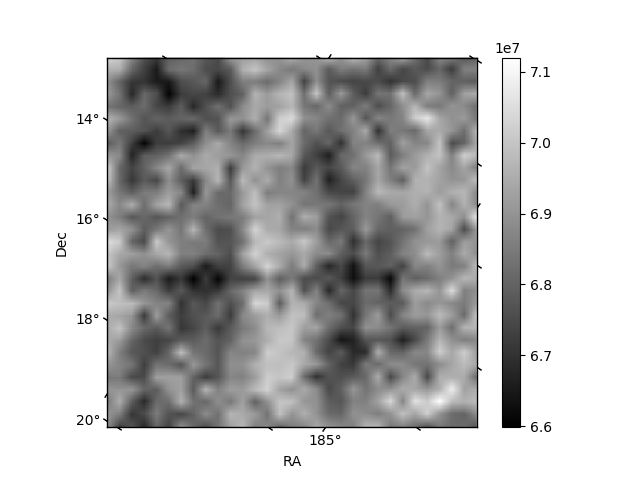
| Quadrant D | 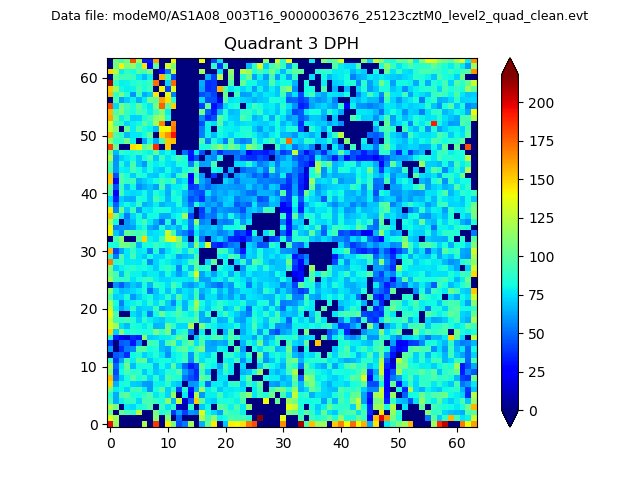 |
 |
Quadrant C |
| Plot type | Count rate plots | Images |
|---|---|---|
| Comparison with Poisson distribution Blue bars denote a histogram of data divided into 1 sec bins. Red curve is a Poisson curve with rate = median count rate of data. |
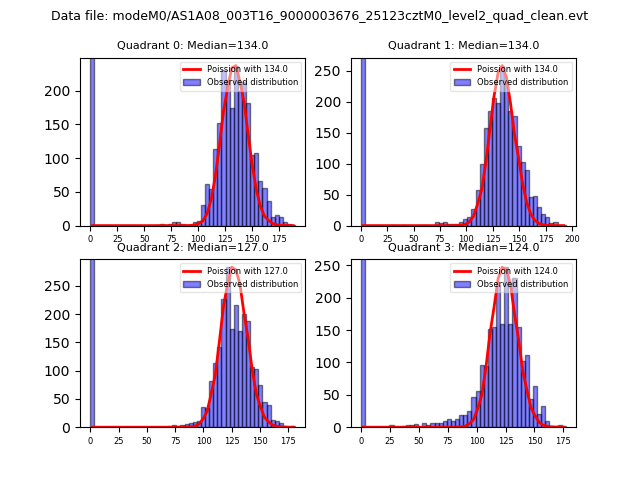 |
 |
| Quadrant-wise count rates Data is divided into 100 sec bins |
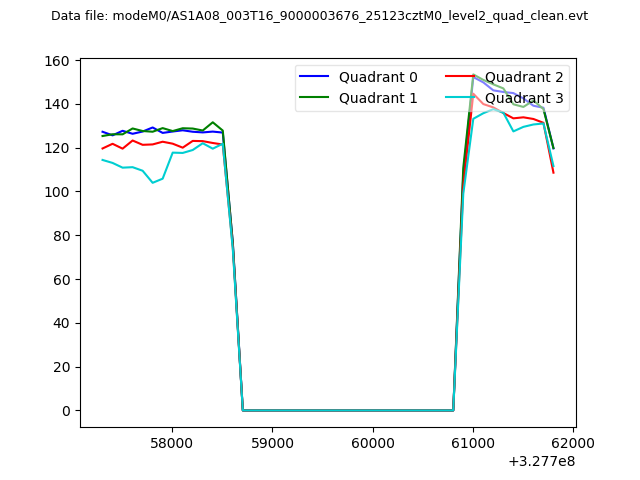 |
|
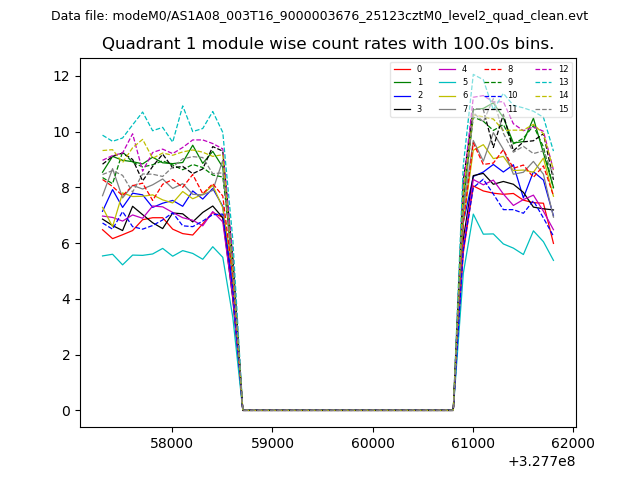
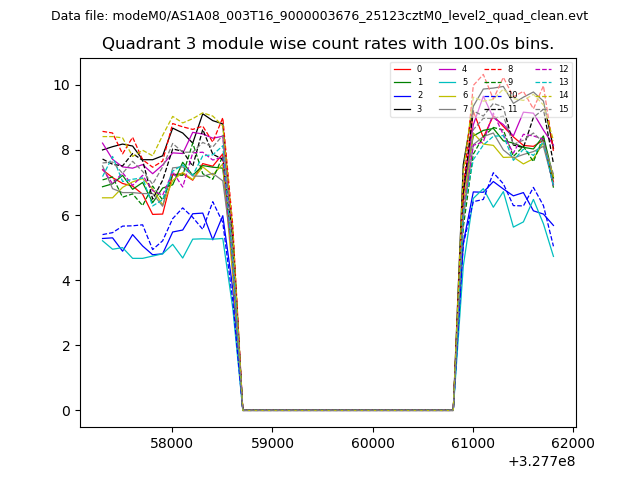
| Module-wise count rates for Quadrant A Data is divided into 100 sec bins |
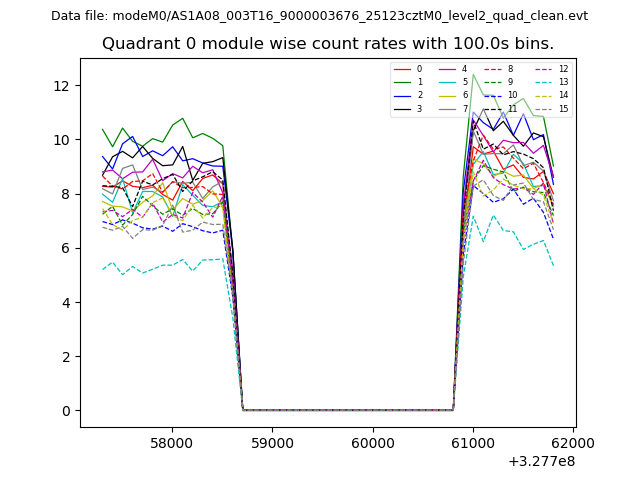 |
 |
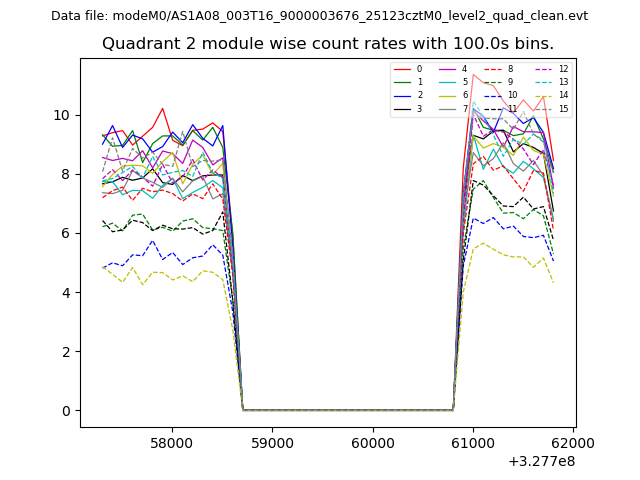
| Module-wise count rates for Quadrant B Data is divided into 100 sec bins |
 |
 |
| Module-wise count rates for Quadrant C Data is divided into 100 sec bins |
 |
 |
| Module-wise count rates for Quadrant D Data is divided into 100 sec bins |
 |
 |
| Parameter | Plot |
|---|---|
| CZT HV Monitor | 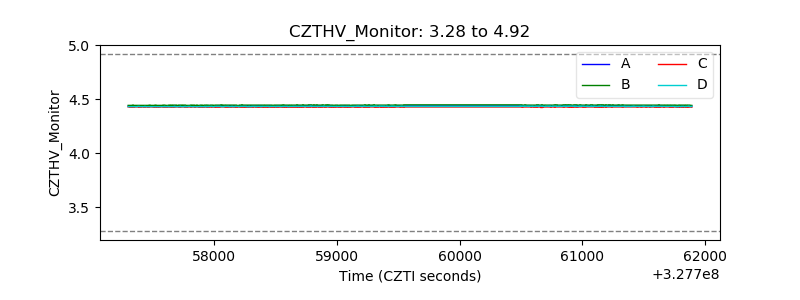 |
| D_VDD | 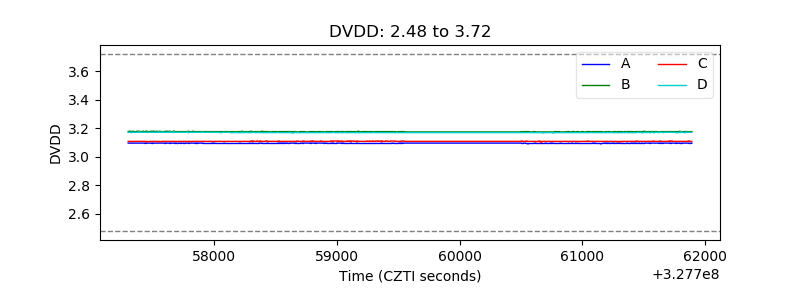 |
| Temperature 1 | 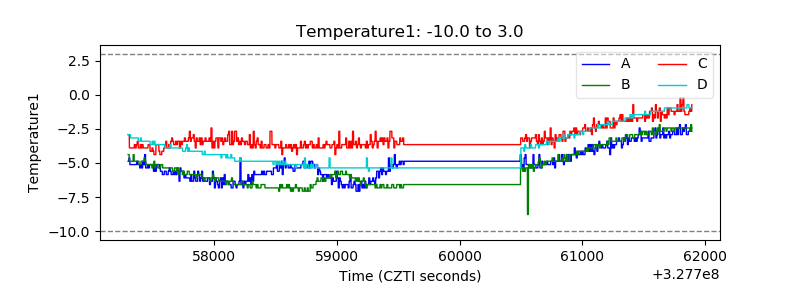 |
| Veto HV Monitor | 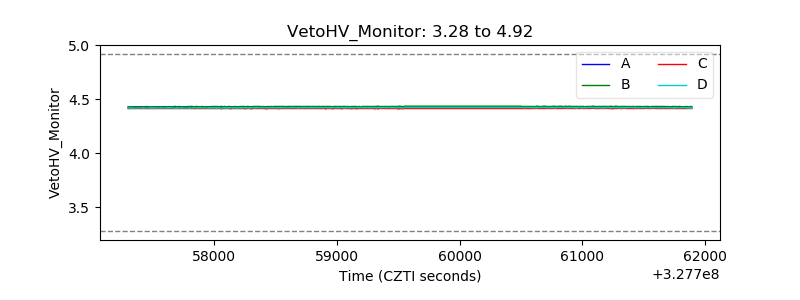 |
| Veto LLD |  |
| Alpha Counter | 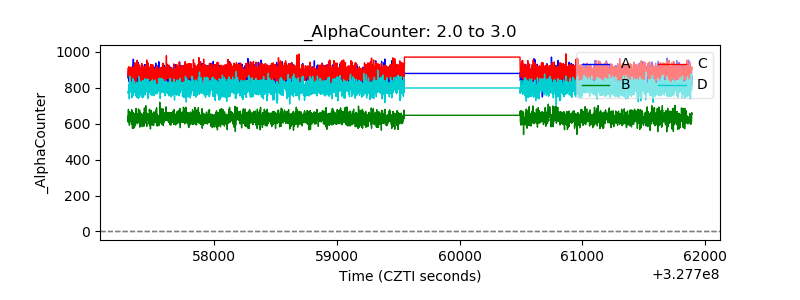 |
| _CPM_Rate | 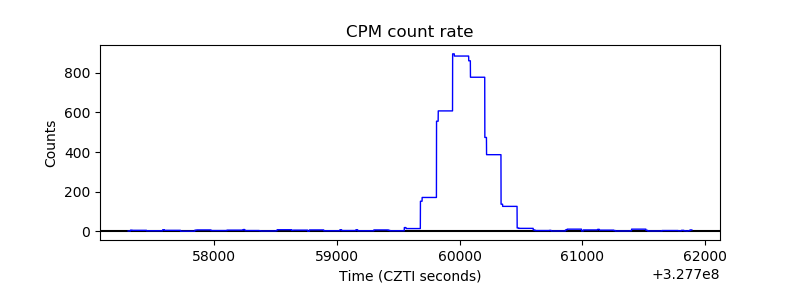 |
| CZT Counter | 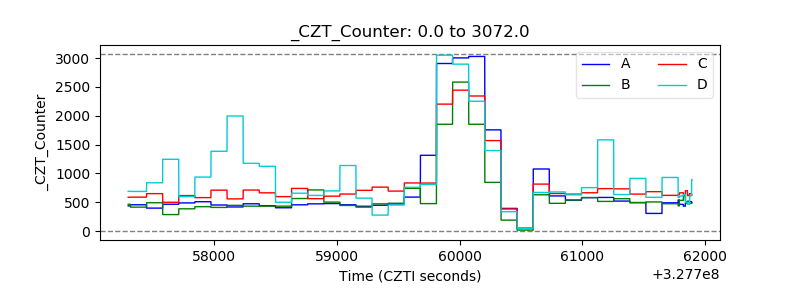 |
| +2.5 Volts monitor |  |
| +5 Volts monitor |  |
| _ROLL_ROT | 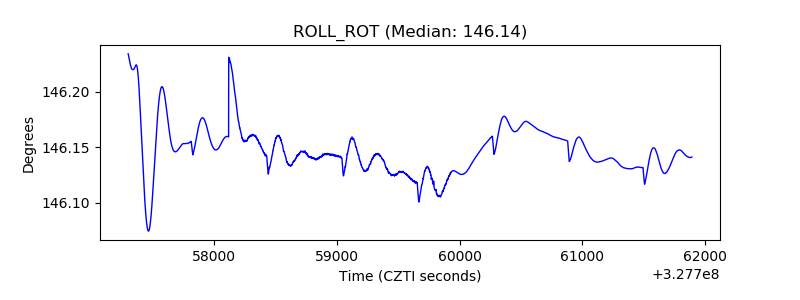 |
| _Roll_DEC | 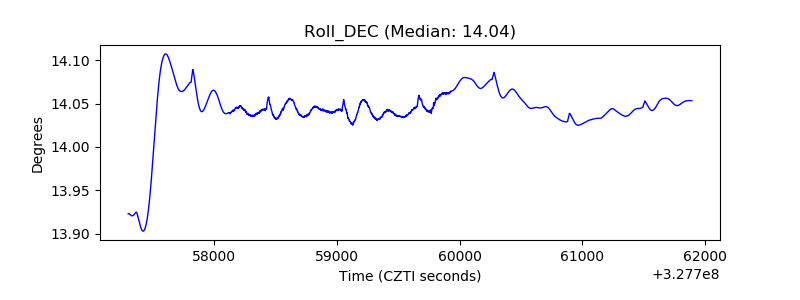 |
| _Roll_RA | 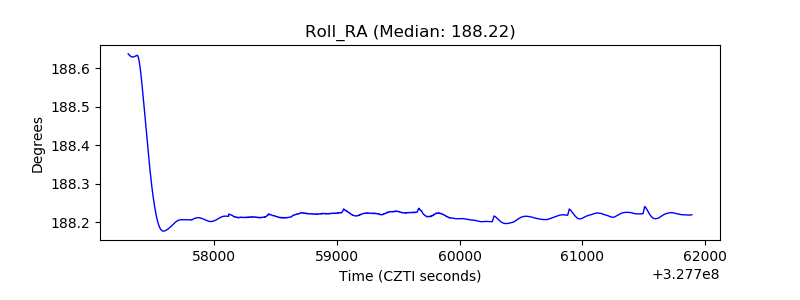 |
| Veto Counter | 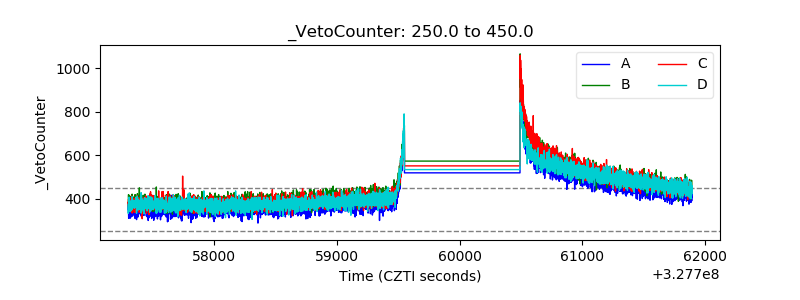 |