| Param | Original file | Final file |
|---|---|---|
| Filename | modeM0/AS1A08_003T16_9000003676_25125cztM0_level2.evt | modeM0/AS1A08_003T16_9000003676_25125cztM0_level2_quad_clean.evt |
| Size (bytes) | 507,314,880 | 103,703,040 |
| Size | 483.8 MB | 98.9 MB |
| Events in quadrant A | 3,046,778 | 706,869 |
| Events in quadrant B | 3,174,544 | 707,446 |
| Events in quadrant C | 3,652,279 | 666,577 |
| Events in quadrant D | 5,073,882 | 630,889 |
| Mode M9 | |||
|---|---|---|---|
| Quadrant | BADHDUFLAG | Total packets | Discarded packets |
| A | 0 | 11 | 0 |
| B | 0 | 11 | 0 |
| C | 0 | 11 | 0 |
| D | 0 | 11 | 0 |
| Mode M0 | |||
|---|---|---|---|
| Quadrant | BADHDUFLAG | Total packets | Discarded packets |
| A | 0 | 13026 | 0 |
| B | 0 | 13396 | 0 |
| C | 0 | 15316 | 0 |
| D | 0 | 19246 | 0 |
| Quadrant | Total seconds | Saturated seconds | Saturation percentage |
|---|---|---|---|
| A | 6146 | 51 | 0.829808% |
| B | 6147 | 73 | 1.187571% |
| C | 6146 | 101 | 1.643345% |
| D | 6146 | 494 | 8.037748% |
Noise dominated data is calculated using 1-second bins in cleaned event files. If a bin has >2000 counts, and if more than 50% of those come from <1% of pixels, then it is considered to be noise-dominated and hence unusable.
| Quadrant | # 1 sec bins | Bins with >0 counts | Bins with >2000 counts | High rate bins dominated by noise | Noise dominated (total time) | Noise dominated (detector-on time) | Marked lightcurve |
|---|---|---|---|---|---|---|---|
| A | 7241 | 6146 | 0 | 0 | 0.00% | 0.00% | 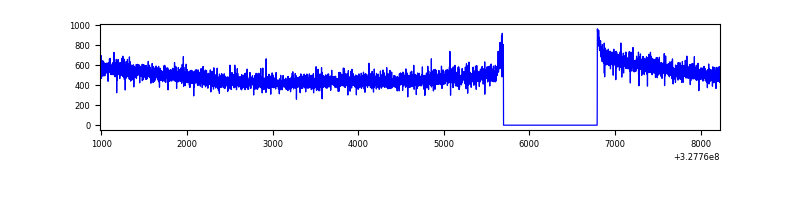 |
| B | 7242 | 6147 | 21 | 21 | 0.29% | 0.34% | 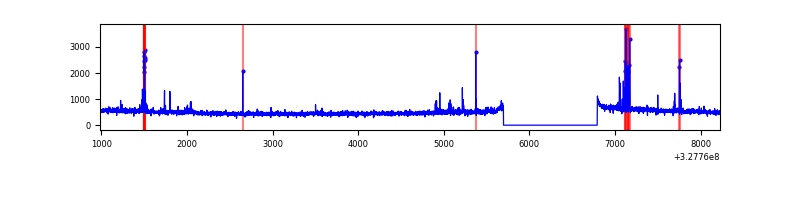 |
| C | 7241 | 6146 | 0 | 0 | 0.00% | 0.00% | 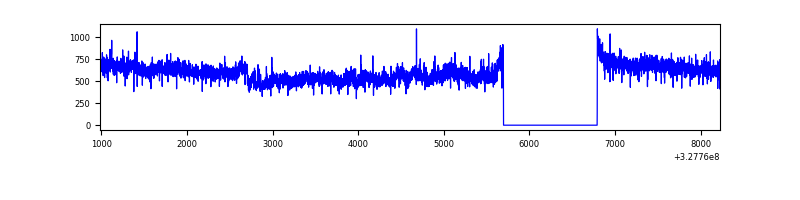 |
| D | 7241 | 6146 | 398 | 398 | 5.50% | 6.48% | 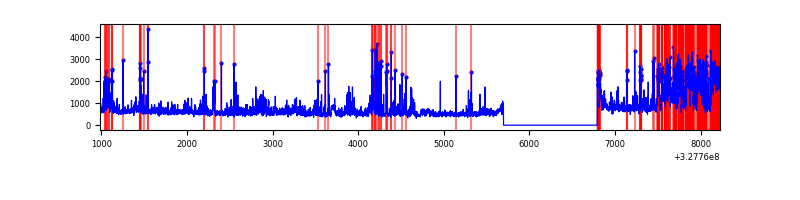 |
Top three noisy pixels from each quadrant. If the there are fewer than three noisy pixels in the level2.evt file, extra rows are filled as -1
| Pixel properties | Quadrant properties | ||||||
|---|---|---|---|---|---|---|---|
| Quadrant | DetID | PixID | Counts | Sigma | Mean | Median | Sigma |
| A | 13 | 254 | 9664 | 56.46 | 790 | 773 | 157.5 |
| A | 3 | 137 | 6920 | 39.04 | 790 | 773 | 157.5 |
| A | 0 | 226 | 6849 | 38.59 | 790 | 773 | 157.5 |
| B | 3 | 64 | 82063 | 545.21 | 776 | 758 | 149.1 |
| B | 10 | 251 | 27597 | 179.98 | 776 | 758 | 149.1 |
| B | 12 | 111 | 18008 | 115.67 | 776 | 758 | 149.1 |
| C | 7 | 247 | 595015 | 3355.78 | 751 | 757 | 177.1 |
| C | 14 | 238 | 120143 | 674.17 | 751 | 757 | 177.1 |
| C | 3 | 233 | 9812 | 51.13 | 751 | 757 | 177.1 |
| D | 1 | 52 | 1356223 | 7092.12 | 743 | 728 | 191.1 |
| D | 8 | 195 | 292651 | 1527.38 | 743 | 728 | 191.1 |
| D | 2 | 244 | 197214 | 1028.04 | 743 | 728 | 191.1 |
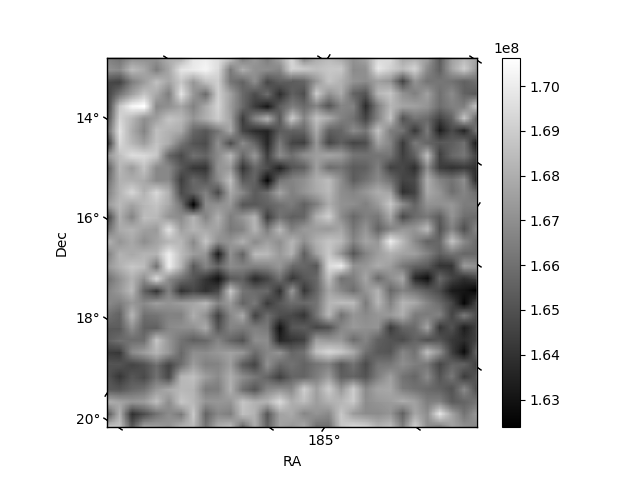
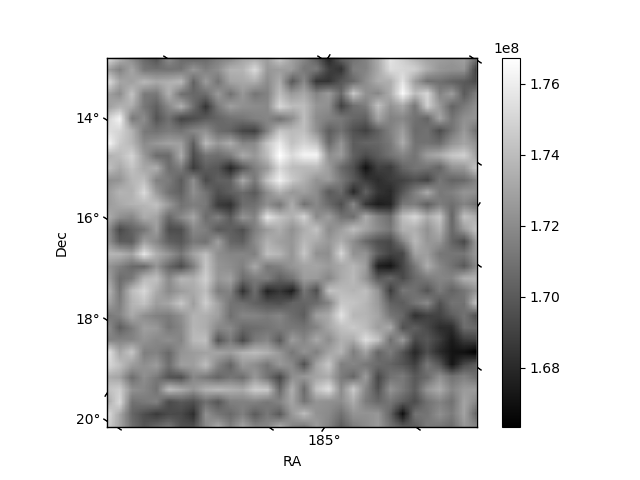
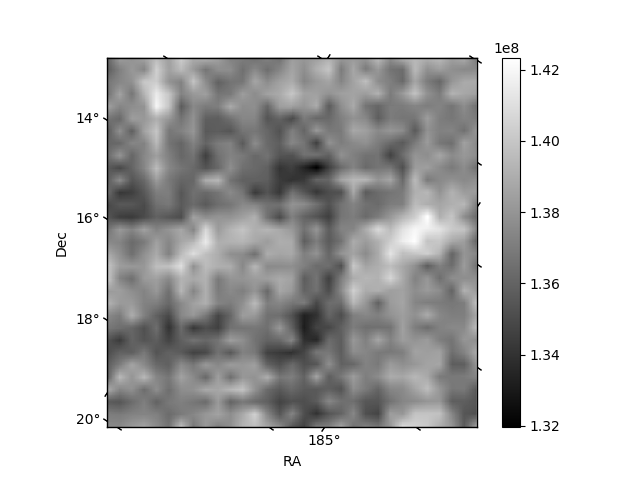
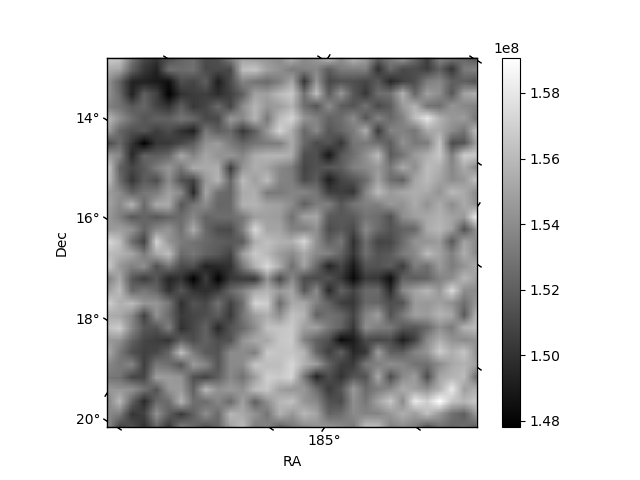
Histogram calculated using DETX and DETY for each event in the final _common_clean file
| Quadrant A | 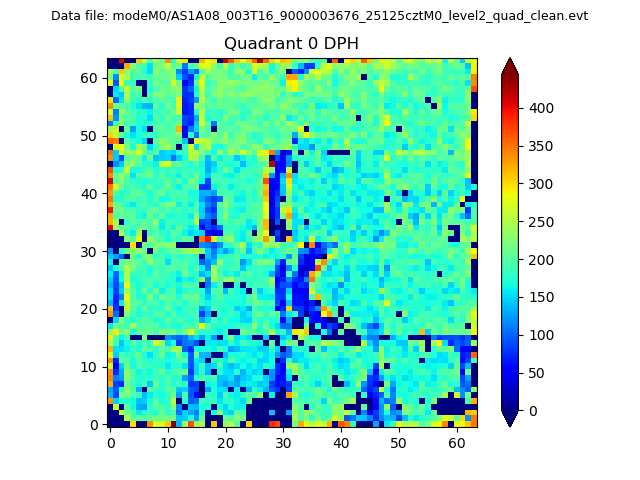 |
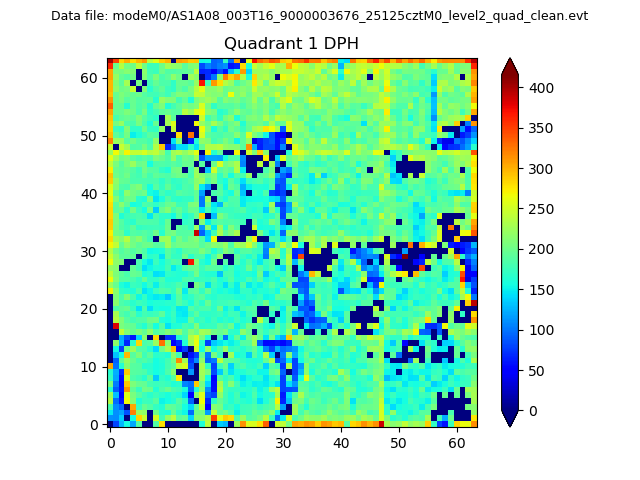 |
Quadrant B |
|---|---|---|---|
| Quadrant D | 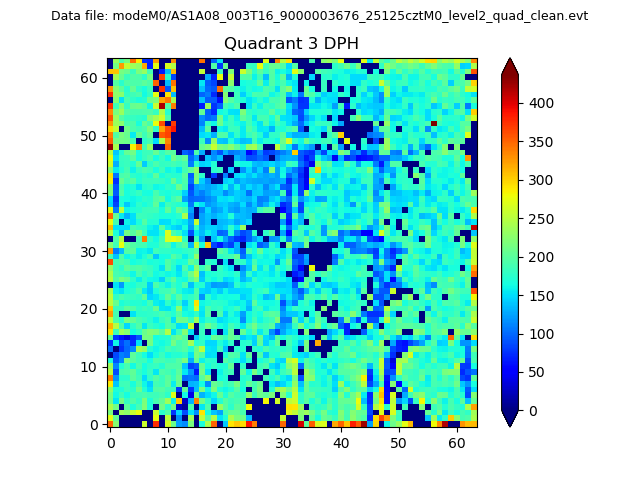 |
 |
Quadrant C |
| Plot type | Count rate plots | Images |
|---|---|---|
| Comparison with Poisson distribution Blue bars denote a histogram of data divided into 1 sec bins. Red curve is a Poisson curve with rate = median count rate of data. |
 |
 |
| Quadrant-wise count rates Data is divided into 100 sec bins |
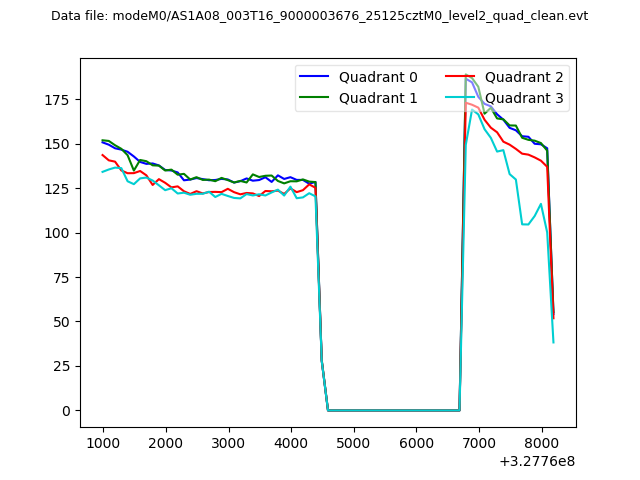 |
|
| Module-wise count rates for Quadrant A Data is divided into 100 sec bins |
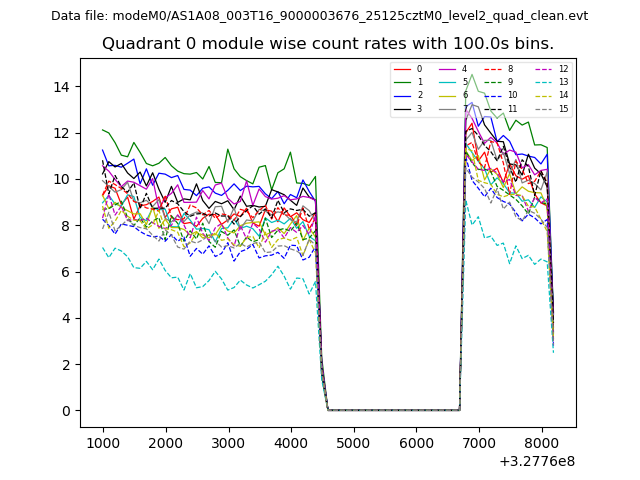 |
 |
| Module-wise count rates for Quadrant B Data is divided into 100 sec bins |
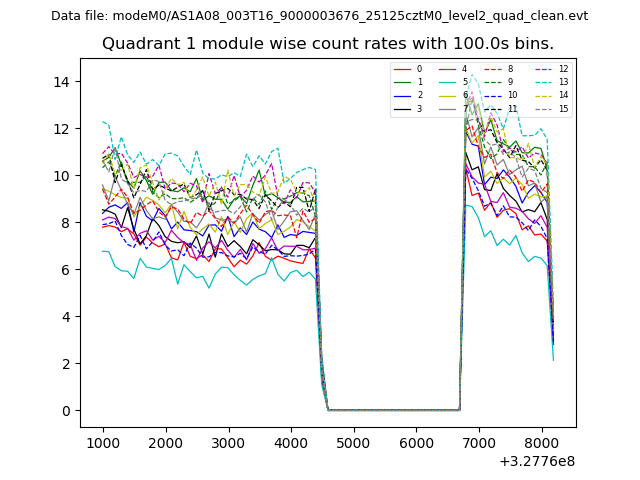 |
 |
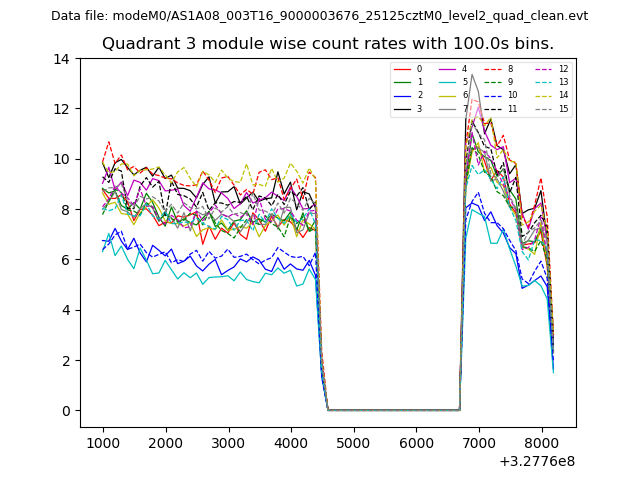
| Module-wise count rates for Quadrant C Data is divided into 100 sec bins |
 |
 |
| Module-wise count rates for Quadrant D Data is divided into 100 sec bins |
 |
 |
| Parameter | Plot |
|---|---|
| CZT HV Monitor |  |
| D_VDD | 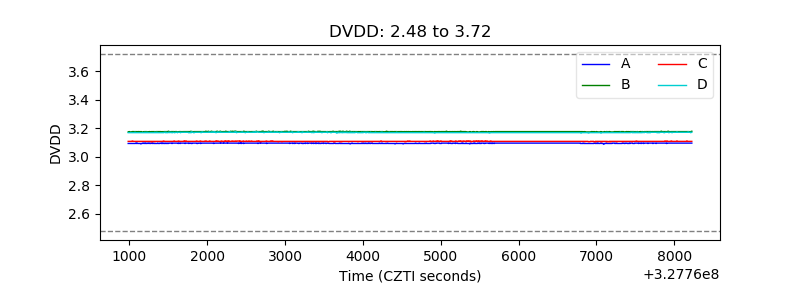 |
| Temperature 1 | 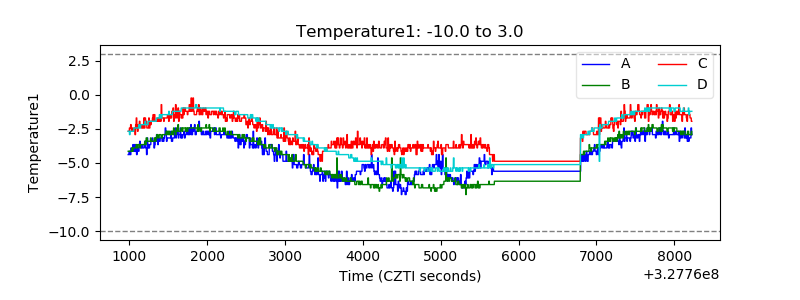 |
| Veto HV Monitor | 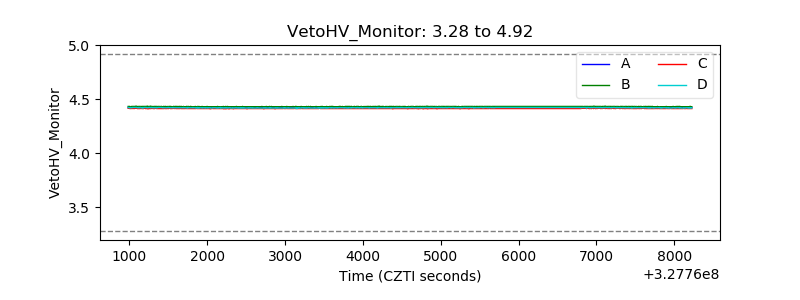 |
| Veto LLD | 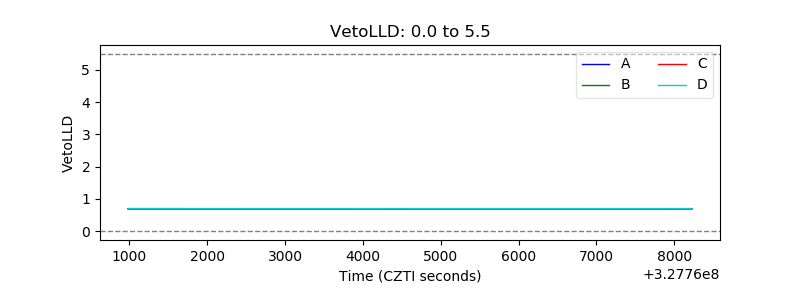 |
| Alpha Counter | 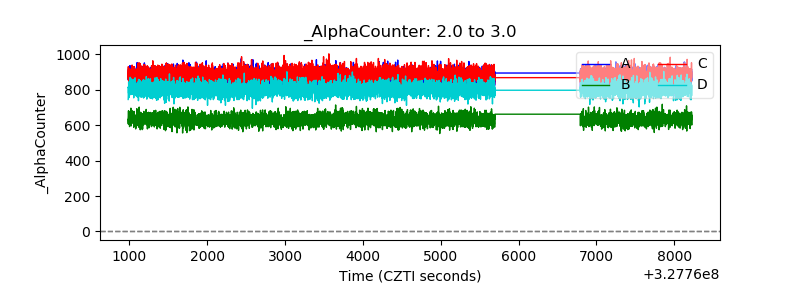 |
| _CPM_Rate | 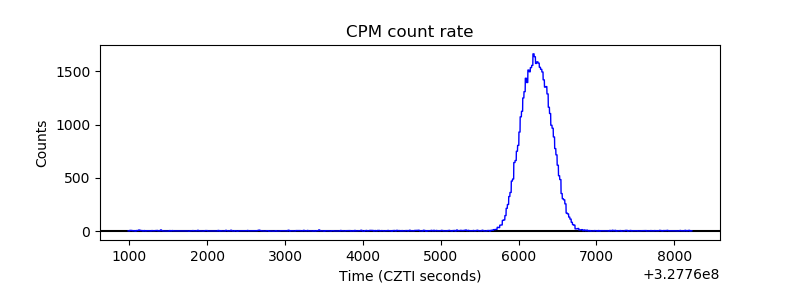 |
| CZT Counter | 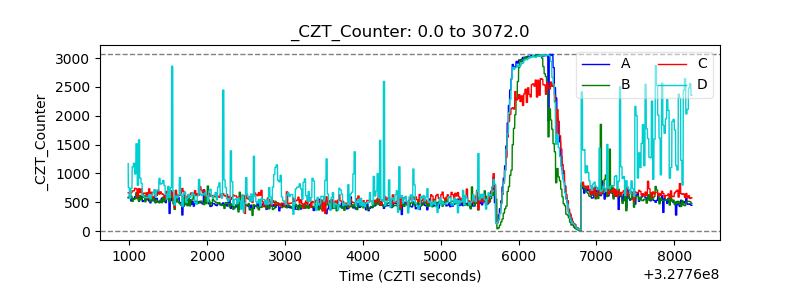 |
| +2.5 Volts monitor |  |
| +5 Volts monitor |  |
| _ROLL_ROT | 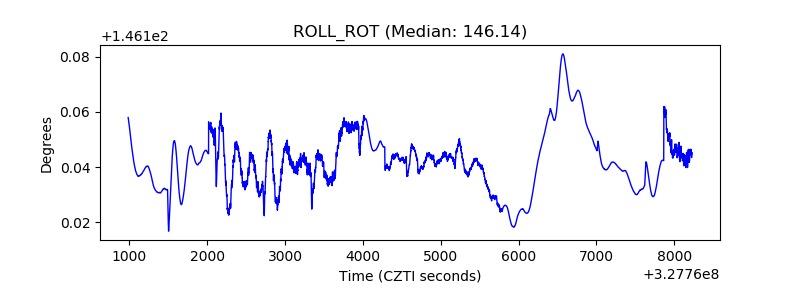 |
| _Roll_DEC | 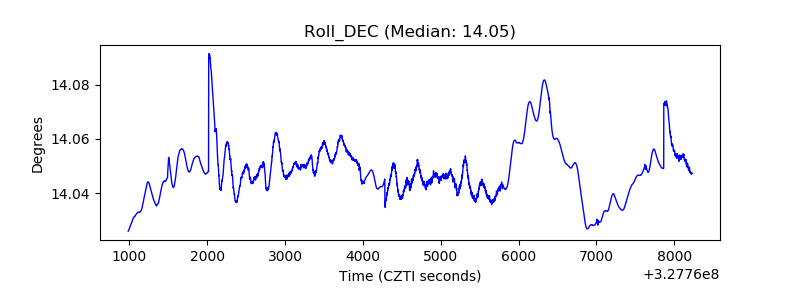 |
| _Roll_RA | 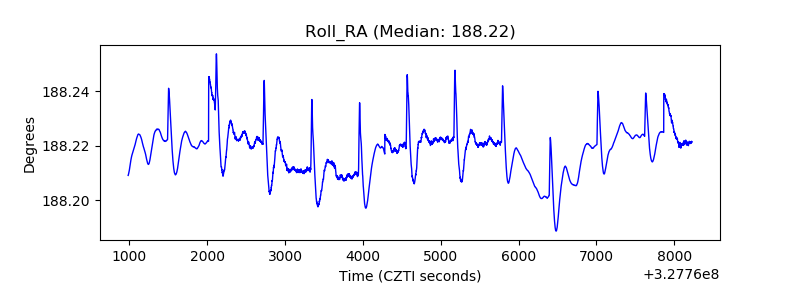 |
| Veto Counter | 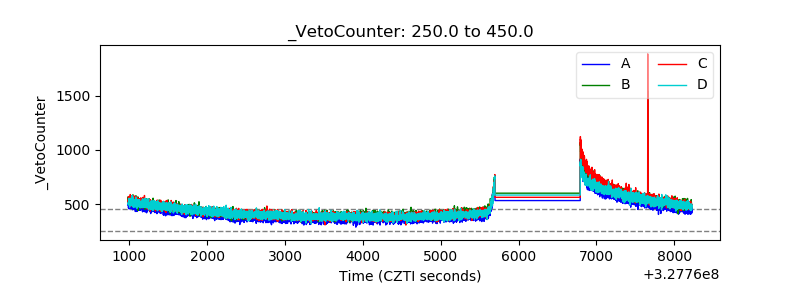 |