| Param | Original file | Final file |
|---|---|---|
| Filename | modeM0/AS1A08_003T16_9000003676_25126cztM0_level2.evt | modeM0/AS1A08_003T16_9000003676_25126cztM0_level2_quad_clean.evt |
| Size (bytes) | 589,170,240 | 98,881,920 |
| Size | 561.9 MB | 94.3 MB |
| Events in quadrant A | 3,057,327 | 681,579 |
| Events in quadrant B | 3,143,439 | 684,669 |
| Events in quadrant C | 3,490,232 | 647,202 |
| Events in quadrant D | 7,745,980 | 561,638 |
| Mode M9 | |||
|---|---|---|---|
| Quadrant | BADHDUFLAG | Total packets | Discarded packets |
| A | 0 | 12 | 0 |
| B | 0 | 12 | 0 |
| C | 0 | 12 | 0 |
| D | 0 | 12 | 0 |
| Mode M0 | |||
|---|---|---|---|
| Quadrant | BADHDUFLAG | Total packets | Discarded packets |
| A | 0 | 12907 | 0 |
| B | 0 | 13106 | 0 |
| C | 0 | 14281 | 0 |
| D | 0 | 27262 | 0 |
| Quadrant | Total seconds | Saturated seconds | Saturation percentage |
|---|---|---|---|
| A | 5999 | 60 | 1.000167% |
| B | 5999 | 74 | 1.233539% |
| C | 5999 | 111 | 1.850308% |
| D | 5999 | 1354 | 22.570428% |
Noise dominated data is calculated using 1-second bins in cleaned event files. If a bin has >2000 counts, and if more than 50% of those come from <1% of pixels, then it is considered to be noise-dominated and hence unusable.
| Quadrant | # 1 sec bins | Bins with >0 counts | Bins with >2000 counts | High rate bins dominated by noise | Noise dominated (total time) | Noise dominated (detector-on time) | Marked lightcurve |
|---|---|---|---|---|---|---|---|
| A | 7184 | 5999 | 0 | 0 | 0.00% | 0.00% | 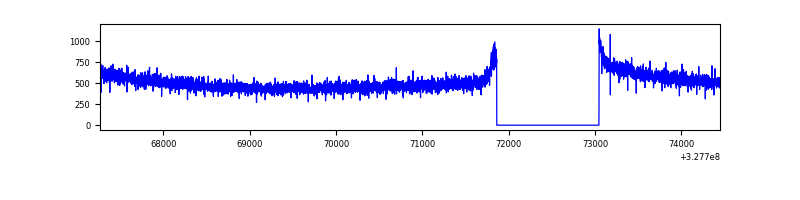 |
| B | 7184 | 5999 | 7 | 7 | 0.10% | 0.12% | 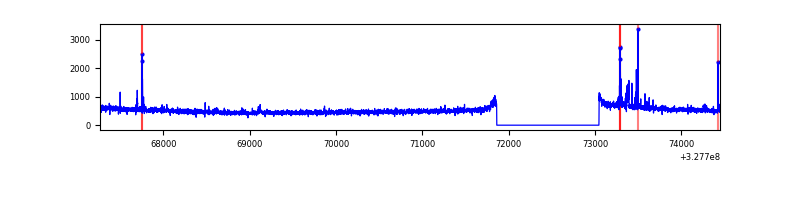 |
| C | 7184 | 5999 | 0 | 0 | 0.00% | 0.00% | 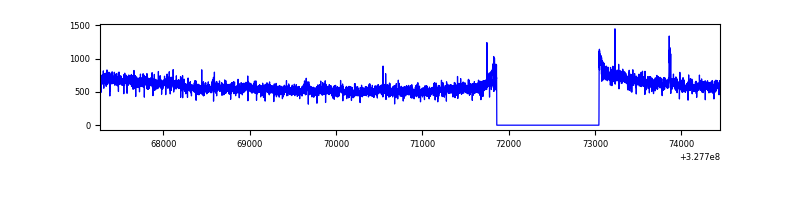 |
| D | 7184 | 5999 | 1250 | 1250 | 17.40% | 20.84% | 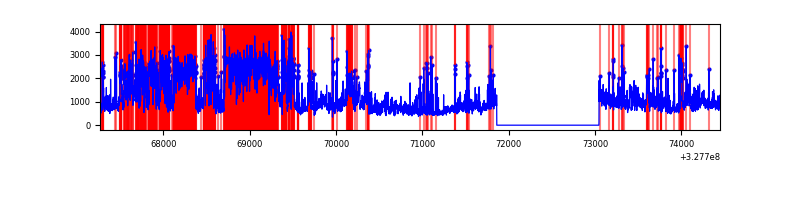 |
Top three noisy pixels from each quadrant. If the there are fewer than three noisy pixels in the level2.evt file, extra rows are filled as -1
| Pixel properties | Quadrant properties | ||||||
|---|---|---|---|---|---|---|---|
| Quadrant | DetID | PixID | Counts | Sigma | Mean | Median | Sigma |
| A | 13 | 254 | 9756 | 56.95 | 793 | 778 | 157.7 |
| A | 3 | 137 | 6871 | 38.65 | 793 | 778 | 157.7 |
| A | 0 | 226 | 6808 | 38.25 | 793 | 778 | 157.7 |
| B | 3 | 64 | 53083 | 353.39 | 779 | 761 | 148.1 |
| B | 12 | 111 | 17287 | 111.62 | 779 | 761 | 148.1 |
| B | 0 | 190 | 16986 | 109.59 | 779 | 761 | 148.1 |
| C | 7 | 247 | 402431 | 2266.43 | 755 | 762 | 177.2 |
| C | 14 | 238 | 121649 | 682.11 | 755 | 762 | 177.2 |
| C | 7 | 220 | 21172 | 115.16 | 755 | 762 | 177.2 |
| D | 1 | 52 | 4091530 | 23353.98 | 722 | 703 | 175.2 |
| D | 8 | 195 | 593550 | 3384.48 | 722 | 703 | 175.2 |
| D | 2 | 244 | 194038 | 1103.72 | 722 | 703 | 175.2 |
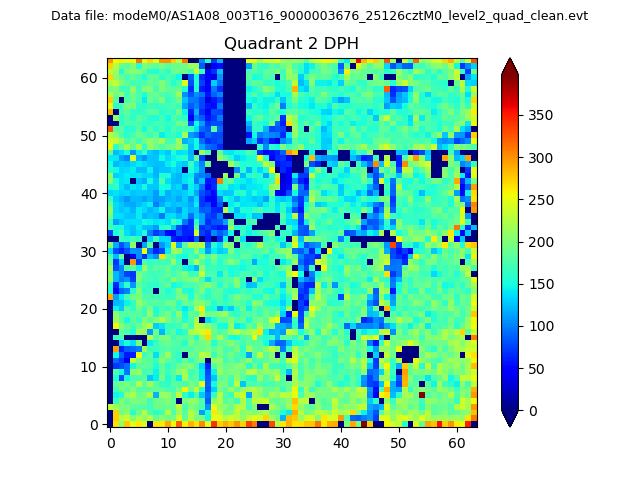
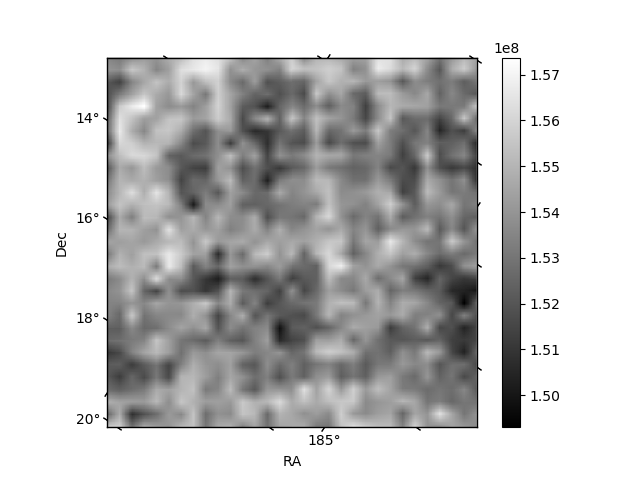
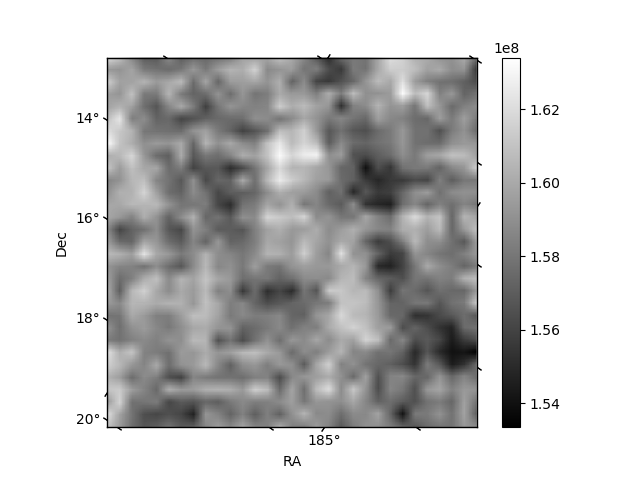
Histogram calculated using DETX and DETY for each event in the final _common_clean file
| Quadrant A |  |
 |
Quadrant B |
|---|---|---|---|
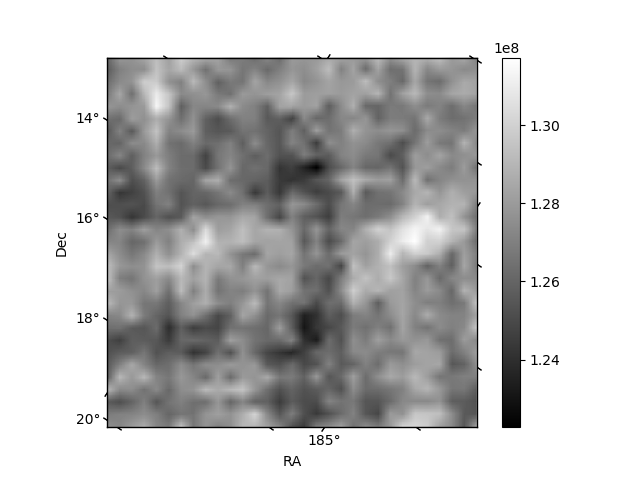
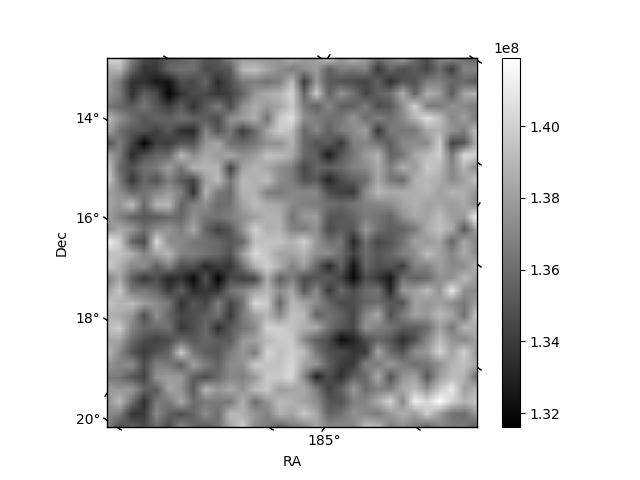
| Quadrant D |  |
 |
Quadrant C |
| Plot type | Count rate plots | Images |
|---|---|---|
| Comparison with Poisson distribution Blue bars denote a histogram of data divided into 1 sec bins. Red curve is a Poisson curve with rate = median count rate of data. |
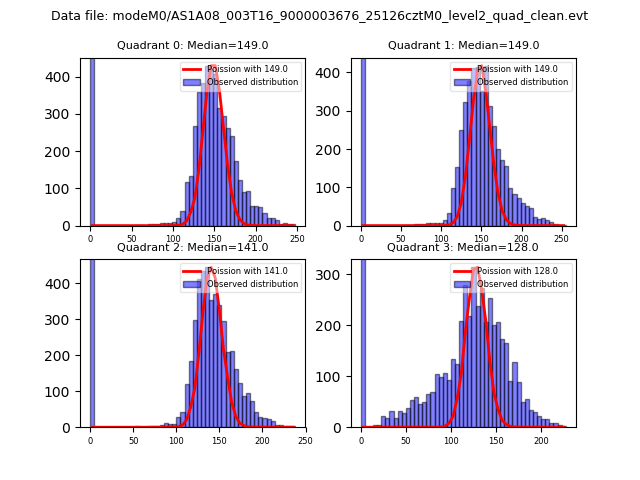 |
 |
| Quadrant-wise count rates Data is divided into 100 sec bins |
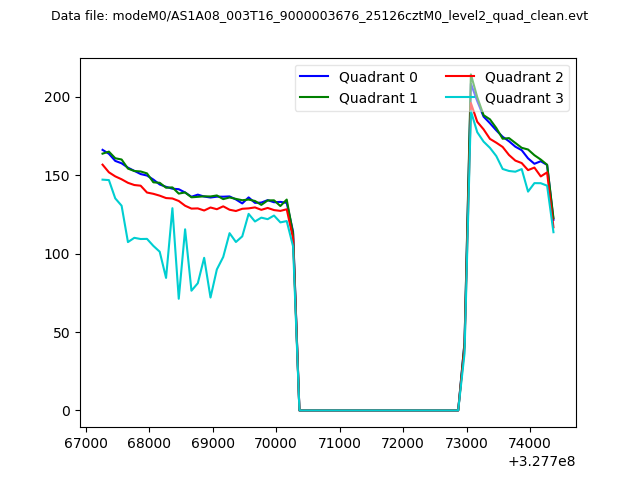 |
|
| Module-wise count rates for Quadrant A Data is divided into 100 sec bins |
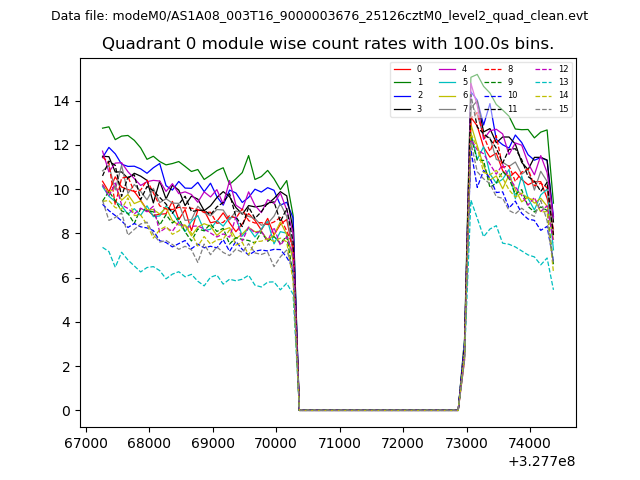 |
 |
| Module-wise count rates for Quadrant B Data is divided into 100 sec bins |
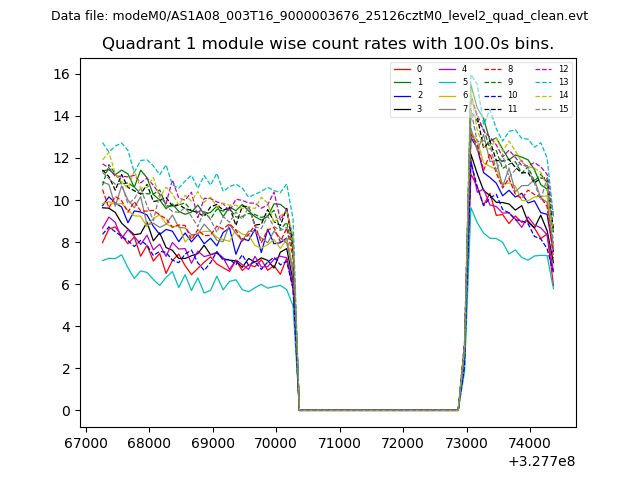 |
 |
| Module-wise count rates for Quadrant C Data is divided into 100 sec bins |
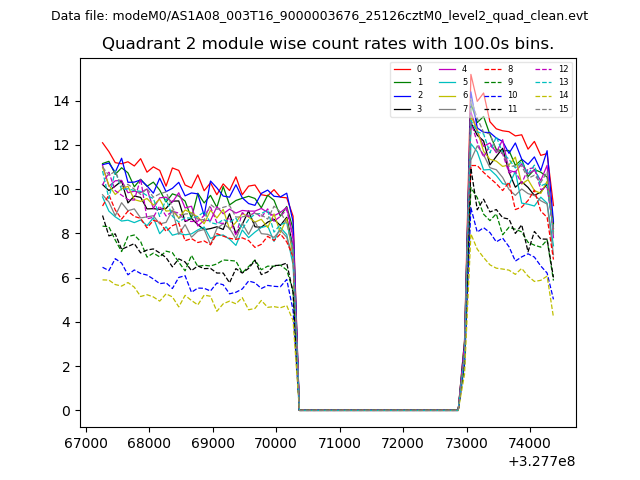 |
 |
| Module-wise count rates for Quadrant D Data is divided into 100 sec bins |
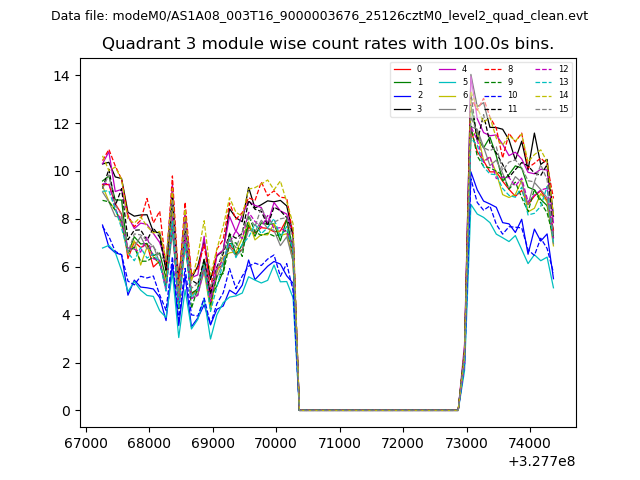 |
 |
| Parameter | Plot |
|---|---|
| CZT HV Monitor | 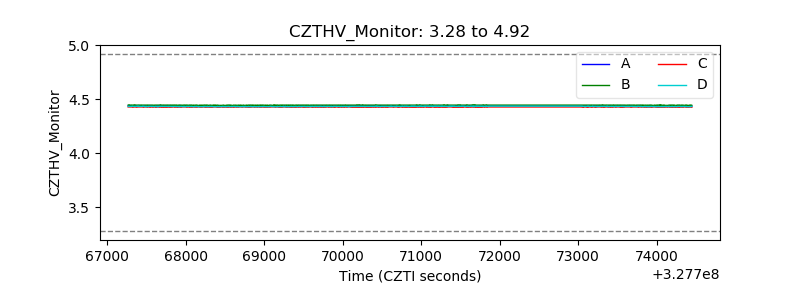 |
| D_VDD | 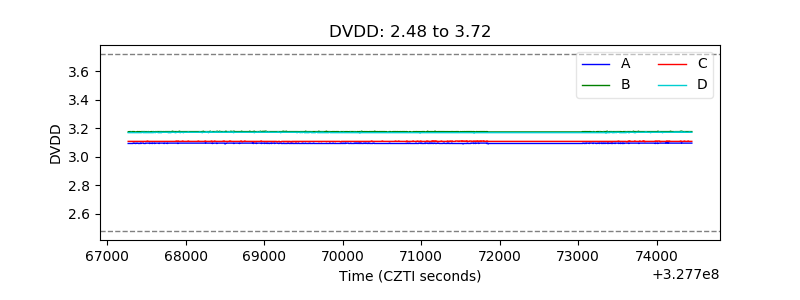 |
| Temperature 1 | 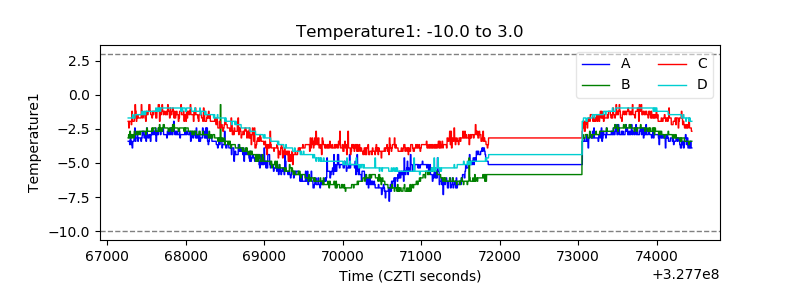 |
| Veto HV Monitor | 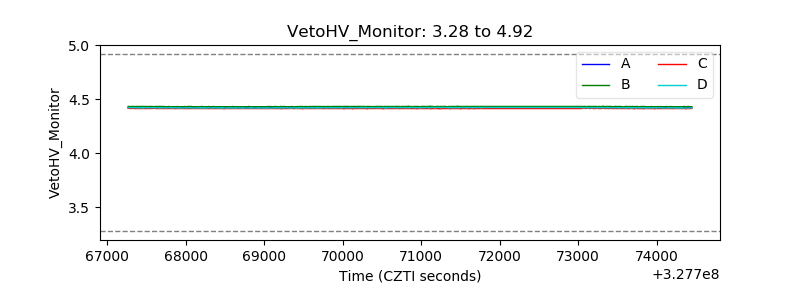 |
| Veto LLD | 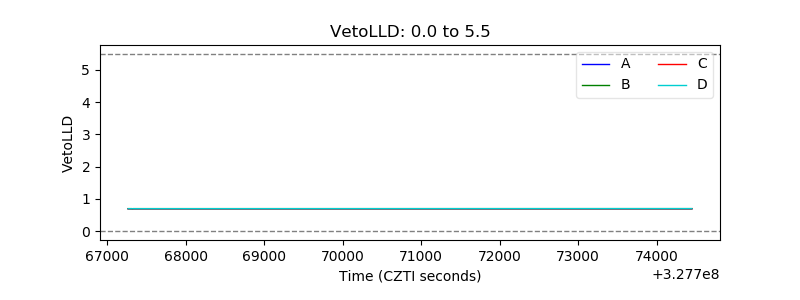 |
| Alpha Counter | 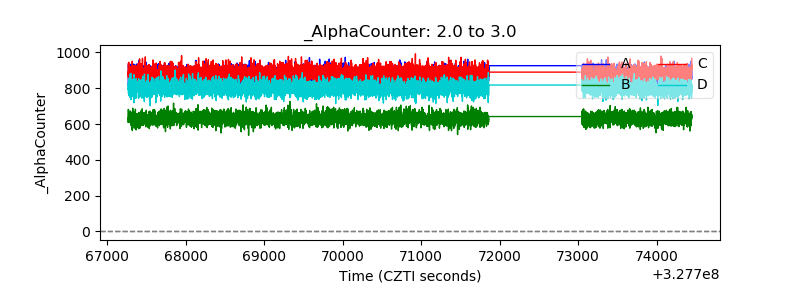 |
| _CPM_Rate | 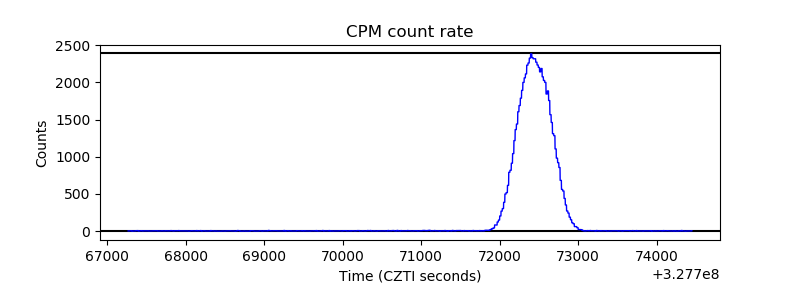 |
| CZT Counter | 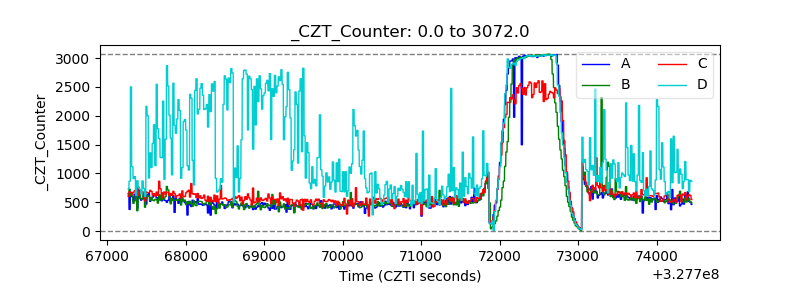 |
| +2.5 Volts monitor |  |
| +5 Volts monitor | 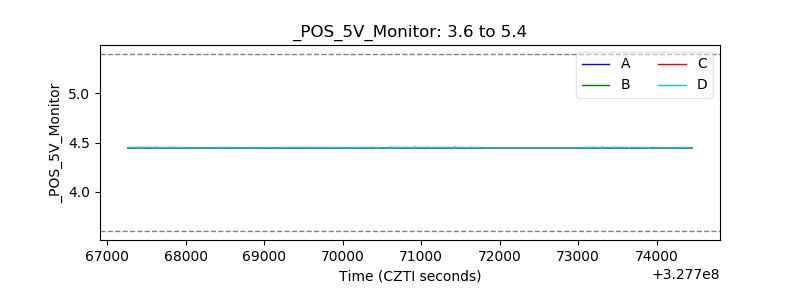 |
| _ROLL_ROT | 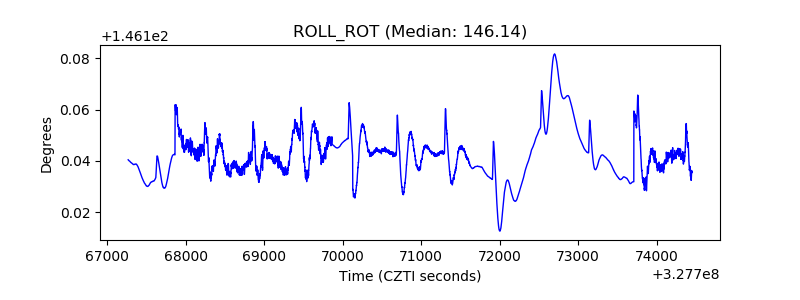 |
| _Roll_DEC | 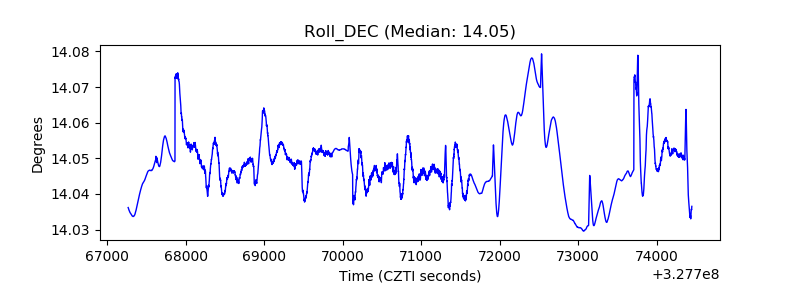 |
| _Roll_RA | 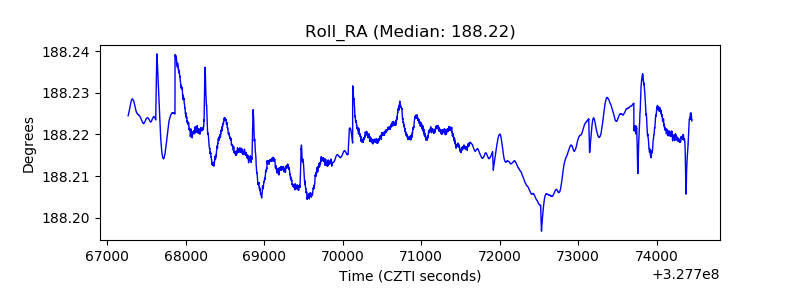 |
| Veto Counter | 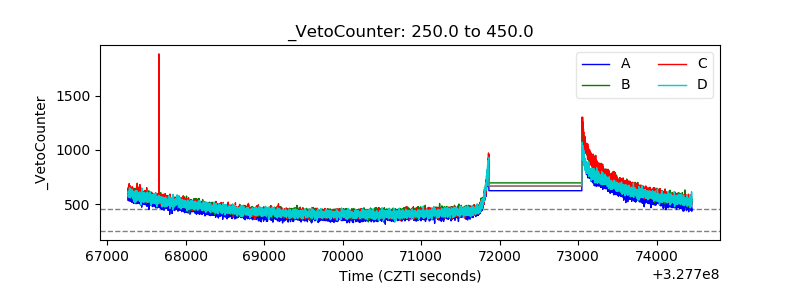 |