| Param | Original file | Final file |
|---|---|---|
| Filename | modeM0/AS1A08_003T16_9000003676_25128cztM0_level2.evt | modeM0/AS1A08_003T16_9000003676_25128cztM0_level2_quad_clean.evt |
| Size (bytes) | 585,573,120 | 98,375,040 |
| Size | 558.4 MB | 93.8 MB |
| Events in quadrant A | 3,294,105 | 661,776 |
| Events in quadrant B | 3,344,382 | 678,320 |
| Events in quadrant C | 4,326,170 | 633,597 |
| Events in quadrant D | 6,344,404 | 567,004 |
| Mode M9 | |||
|---|---|---|---|
| Quadrant | BADHDUFLAG | Total packets | Discarded packets |
| A | 0 | 18 | 0 |
| B | 0 | 19 | 0 |
| C | 0 | 19 | 0 |
| D | 0 | 19 | 0 |
| Mode M0 | |||
|---|---|---|---|
| Quadrant | BADHDUFLAG | Total packets | Discarded packets |
| A | 0 | 13651 | 0 |
| B | 0 | 13760 | 0 |
| C | 0 | 17605 | 0 |
| D | 0 | 23202 | 0 |
| Quadrant | Total seconds | Saturated seconds | Saturation percentage |
|---|---|---|---|
| A | 6279 | 72 | 1.146679% |
| B | 6279 | 75 | 1.194458% |
| C | 6279 | 154 | 2.452620% |
| D | 6278 | 790 | 12.583625% |
Noise dominated data is calculated using 1-second bins in cleaned event files. If a bin has >2000 counts, and if more than 50% of those come from <1% of pixels, then it is considered to be noise-dominated and hence unusable.
| Quadrant | # 1 sec bins | Bins with >0 counts | Bins with >2000 counts | High rate bins dominated by noise | Noise dominated (total time) | Noise dominated (detector-on time) | Marked lightcurve |
|---|---|---|---|---|---|---|---|
| A | 7599 | 6280 | 0 | 0 | 0.00% | 0.00% |  |
| B | 7599 | 6279 | 0 | 0 | 0.00% | 0.00% |  |
| C | 7599 | 6280 | 0 | 0 | 0.00% | 0.00% |  |
| D | 7598 | 6278 | 655 | 655 | 8.62% | 10.43% |  |
Top three noisy pixels from each quadrant. If the there are fewer than three noisy pixels in the level2.evt file, extra rows are filled as -1
| Pixel properties | Quadrant properties | ||||||
|---|---|---|---|---|---|---|---|
| Quadrant | DetID | PixID | Counts | Sigma | Mean | Median | Sigma |
| A | 13 | 254 | 9842 | 53.07 | 854 | 839 | 169.6 |
| A | 0 | 226 | 7420 | 38.79 | 854 | 839 | 169.6 |
| A | 3 | 137 | 7295 | 38.06 | 854 | 839 | 169.6 |
| B | 12 | 111 | 18438 | 110.38 | 850 | 830 | 159.5 |
| B | 11 | 111 | 16766 | 99.9 | 850 | 830 | 159.5 |
| B | 14 | 111 | 15039 | 89.08 | 850 | 830 | 159.5 |
| C | 7 | 247 | 986304 | 5193.45 | 817 | 824 | 189.8 |
| C | 14 | 238 | 130879 | 685.39 | 817 | 824 | 189.8 |
| C | 9 | 54 | 17092 | 85.73 | 817 | 824 | 189.8 |
| D | 12 | 235 | 1412119 | 7318.58 | 794 | 775 | 192.8 |
| D | 1 | 52 | 1384518 | 7175.46 | 794 | 775 | 192.8 |
| D | 8 | 195 | 378194 | 1957.12 | 794 | 775 | 192.8 |
Histogram calculated using DETX and DETY for each event in the final _common_clean file
| Quadrant A |  |
 |
Quadrant B |
|---|---|---|---|
| Quadrant D |  |
 |
Quadrant C |
| Plot type | Count rate plots | Images |
|---|---|---|
| Comparison with Poisson distribution Blue bars denote a histogram of data divided into 1 sec bins. Red curve is a Poisson curve with rate = median count rate of data. |
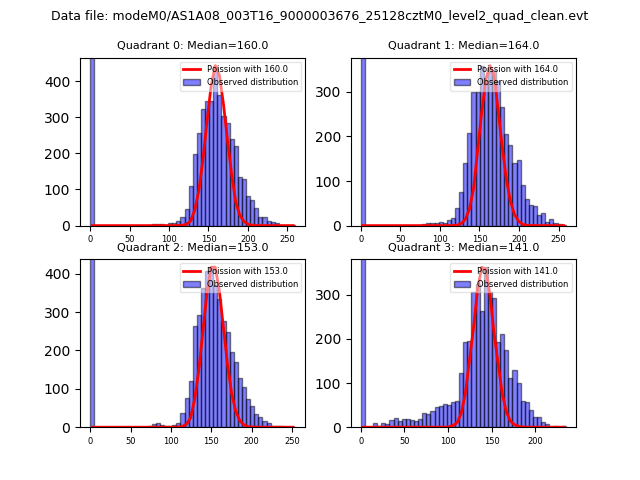 |
 |
| Quadrant-wise count rates Data is divided into 100 sec bins |
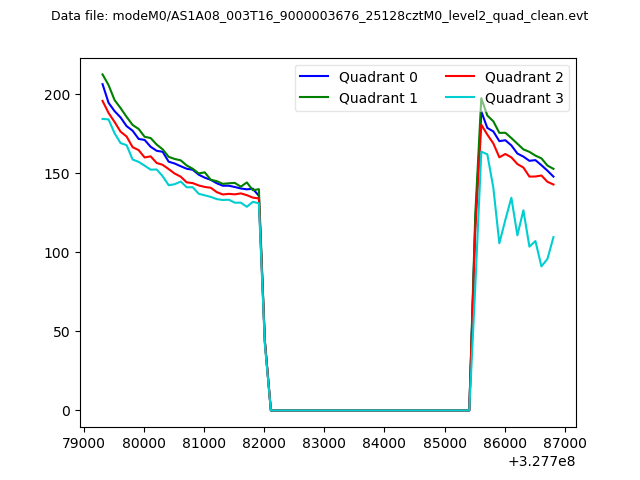 |
|
| Module-wise count rates for Quadrant A Data is divided into 100 sec bins |
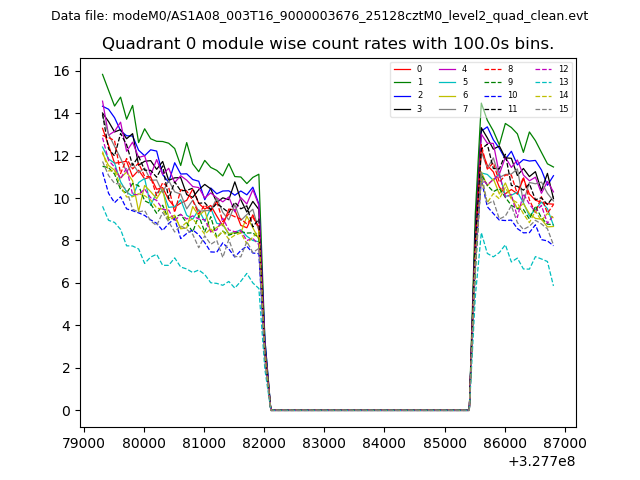 |
 |
| Module-wise count rates for Quadrant B Data is divided into 100 sec bins |
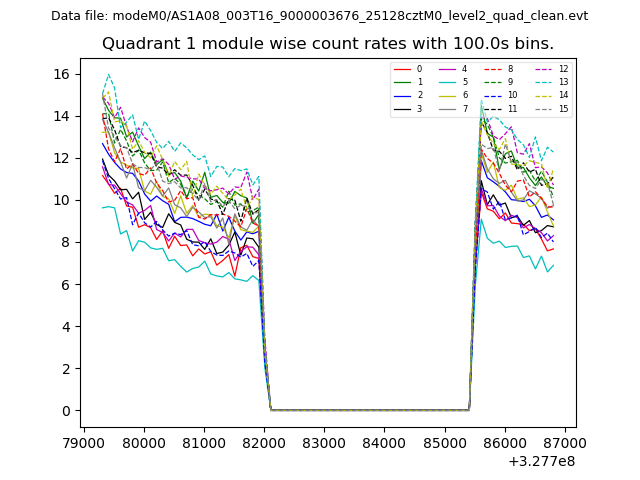 |
 |
| Module-wise count rates for Quadrant C Data is divided into 100 sec bins |
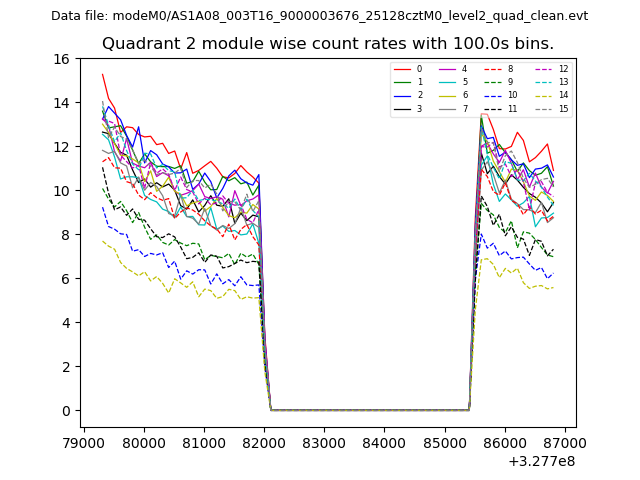 |
 |
| Module-wise count rates for Quadrant D Data is divided into 100 sec bins |
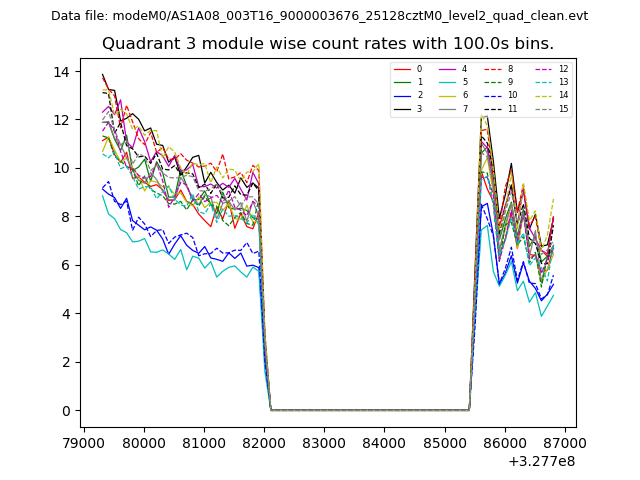 |
 |
| Parameter | Plot |
|---|---|
| CZT HV Monitor | 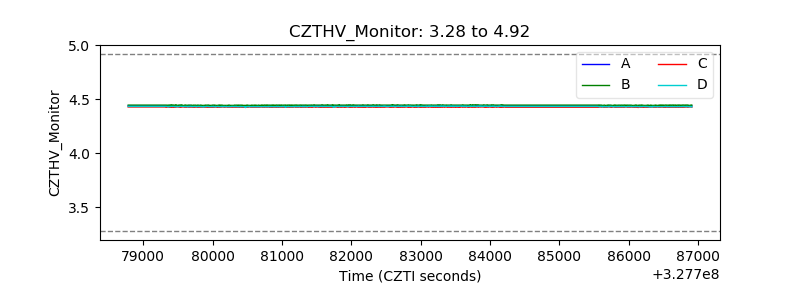 |
| D_VDD |  |
| Temperature 1 |  |
| Veto HV Monitor |  |
| Veto LLD |  |
| Alpha Counter | 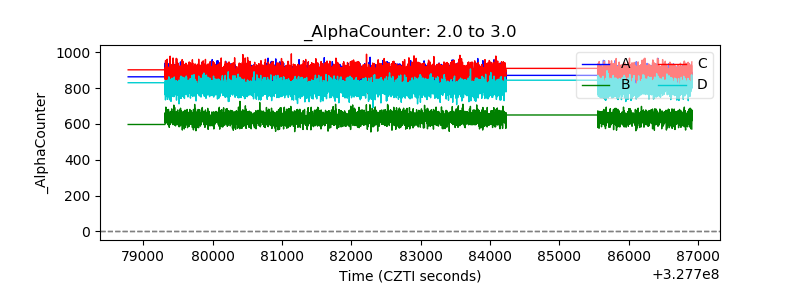 |
| _CPM_Rate | 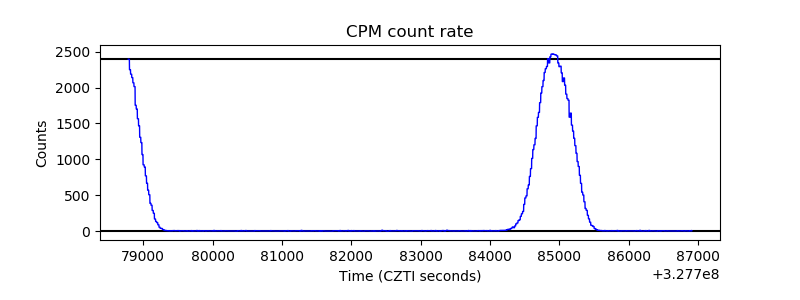 |
| CZT Counter |  |
| +2.5 Volts monitor |  |
| +5 Volts monitor |  |
| _ROLL_ROT |  |
| _Roll_DEC | 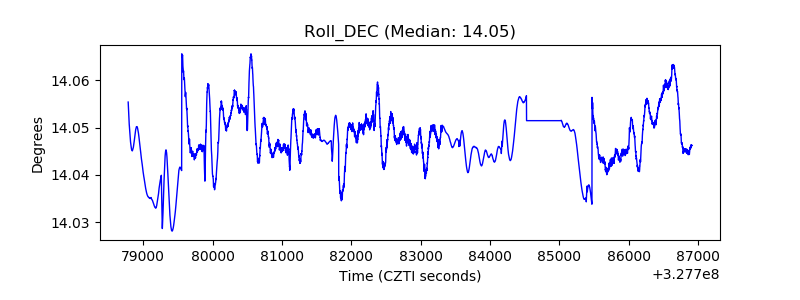 |
| _Roll_RA |  |
| Veto Counter | 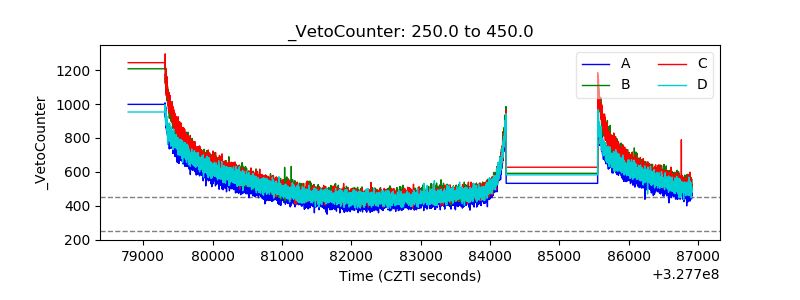 |