| Param | Original file | Final file |
|---|---|---|
| Filename | modeM0/AS1A07_018T07_9000003680cztM0_level2.fits | modeM0/AS1A07_018T07_9000003680cztM0_level2_quad_clean.evt |
| Size (bytes) | 649,189,440 | 540,023,040 |
| Size | 619.1 MB | 515.0 MB |
| Events in quadrant A | 4,049,874 | 3,137,774 |
| Events in quadrant B | 3,884,364 | 3,153,465 |
| Events in quadrant C | 3,938,824 | 2,978,870 |
| Events in quadrant D | 3,430,020 | 2,725,855 |
| Mode SS | |||
|---|---|---|---|
| Quadrant | BADHDUFLAG | Total packets | Discarded packets |
| A | 0 | 1294 | 0 |
| B | 0 | 1294 | 0 |
| C | 0 | 1294 | 0 |
| D | 0 | 1294 | 0 |
| Mode M0 | |||
|---|---|---|---|
| Quadrant | BADHDUFLAG | Total packets | Discarded packets |
| A | 0 | 134411 | 0 |
| B | 0 | 136084 | 0 |
| C | 0 | 149997 | 0 |
| D | 0 | 182046 | 0 |
| Mode M9 | |||
|---|---|---|---|
| Quadrant | BADHDUFLAG | Total packets | Discarded packets |
| A | 0 | 110 | 0 |
| B | 0 | 110 | 0 |
| C | 0 | 110 | 0 |
| D | 0 | 110 | 0 |
| Quadrant | Total seconds | Saturated seconds | Saturation percentage |
|---|---|---|---|
| A | 63530 | 633 | 0.996380% |
| B | 63530 | 816 | 1.284433% |
| C | 63530 | 1744 | 2.745160% |
| D | 63530 | 2795 | 4.399496% |
Noise dominated data is calculated using 1-second bins in cleaned event files. If a bin has >2000 counts, and if more than 50% of those come from <1% of pixels, then it is considered to be noise-dominated and hence unusable.
| Quadrant | # 1 sec bins | Bins with >0 counts | Bins with >2000 counts | High rate bins dominated by noise | Noise dominated (total time) | Noise dominated (detector-on time) | Marked lightcurve |
|---|---|---|---|---|---|---|---|
| A | 74375 | 63520 | 0 | 0 | 0.00% | 0.00% |  |
| B | 74375 | 63518 | 0 | 0 | 0.00% | 0.00% |  |
| C | 74375 | 63492 | 0 | 0 | 0.00% | 0.00% |  |
| D | 74375 | 63477 | 0 | 0 | 0.00% | 0.00% | 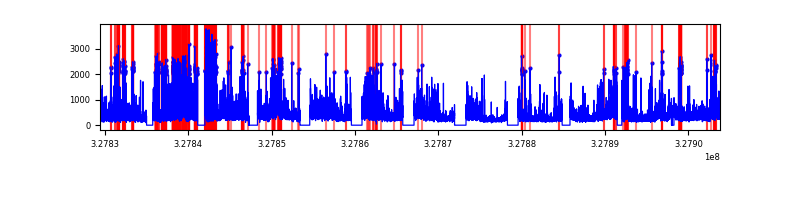 |
Top three noisy pixels from each quadrant. If the there are fewer than three noisy pixels in the level2.evt file, extra rows are filled as -1
| Pixel properties | Quadrant properties | ||||||
|---|---|---|---|---|---|---|---|
| Quadrant | DetID | PixID | Counts | Sigma | Mean | Median | Sigma |
| A | 0 | 29 | 3833 | 11.07 | 1053 | 989 | 256.8 |
| A | 7 | 110 | 3198 | 8.6 | 1053 | 989 | 256.8 |
| A | 0 | 30 | 3004 | 7.84 | 1053 | 989 | 256.8 |
| B | 2 | 9 | 3128 | 10.61 | 1027 | 981 | 202.3 |
| B | 2 | 8 | 2551 | 7.76 | 1027 | 981 | 202.3 |
| B | 5 | 128 | 2540 | 7.71 | 1027 | 981 | 202.3 |
| C | 12 | 241 | 2723 | 6.72 | 1041 | 979 | 259.5 |
| C | 3 | 126 | 2670 | 6.52 | 1041 | 979 | 259.5 |
| C | 9 | 209 | 2613 | 6.3 | 1041 | 979 | 259.5 |
| D | 7 | 3 | 2492 | 6.16 | 980 | 897 | 258.8 |
| D | 3 | 14 | 2487 | 6.14 | 980 | 897 | 258.8 |
| D | 10 | 189 | 2443 | 5.97 | 980 | 897 | 258.8 |
Histogram calculated using DETX and DETY for each event in the final _common_clean file
| Quadrant A | 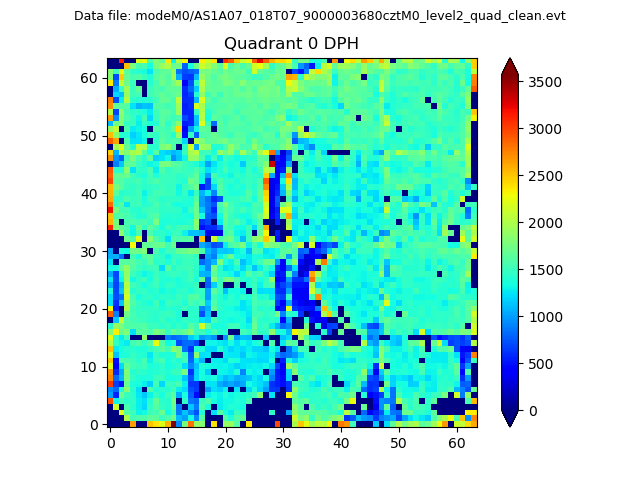 |
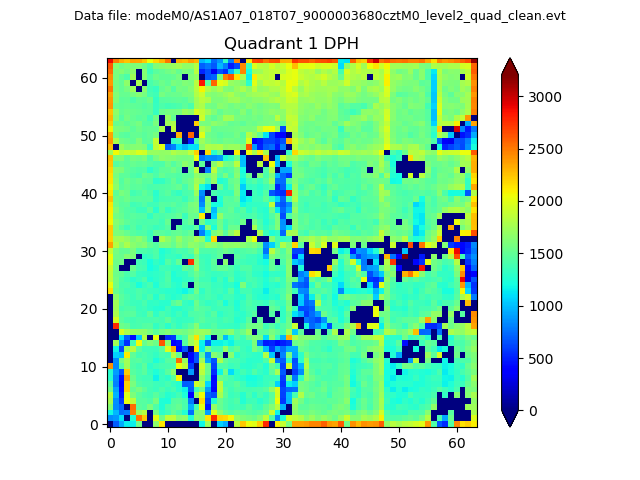 |
Quadrant B |
|---|---|---|---|
| Quadrant D | 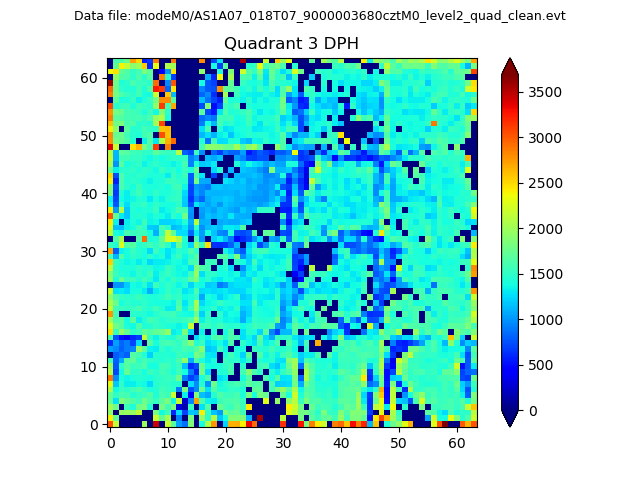 |
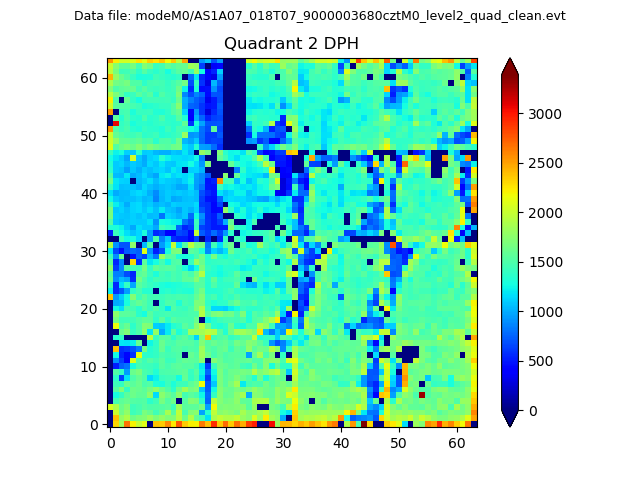 |
Quadrant C |
| Plot type | Count rate plots | Images |
|---|---|---|
| Comparison with Poisson distribution Blue bars denote a histogram of data divided into 1 sec bins. Red curve is a Poisson curve with rate = median count rate of data. |
 |
 |
| Quadrant-wise count rates Data is divided into 100 sec bins |
 |
|
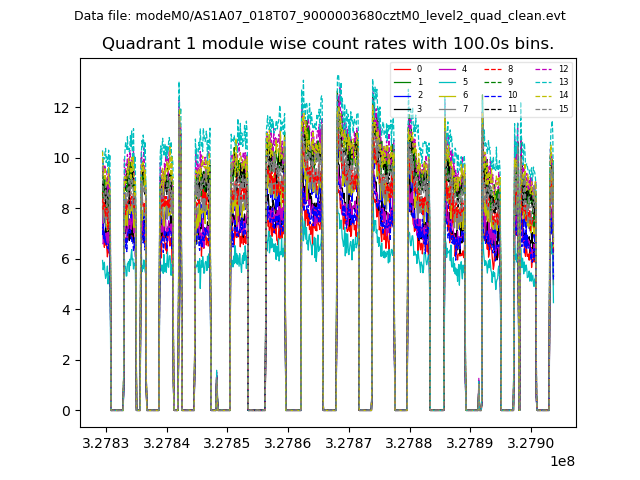
| Module-wise count rates for Quadrant A Data is divided into 100 sec bins |
 |
 |
| Module-wise count rates for Quadrant B Data is divided into 100 sec bins |
 |
 |
| Module-wise count rates for Quadrant C Data is divided into 100 sec bins |
 |
 |
| Module-wise count rates for Quadrant D Data is divided into 100 sec bins |
 |
 |
| Parameter | Plot |
|---|---|
| CZT HV Monitor |  |
| D_VDD | 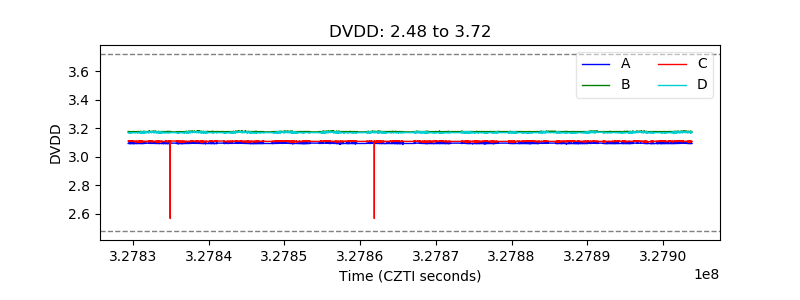 |
| Temperature 1 |  |
| Veto HV Monitor | 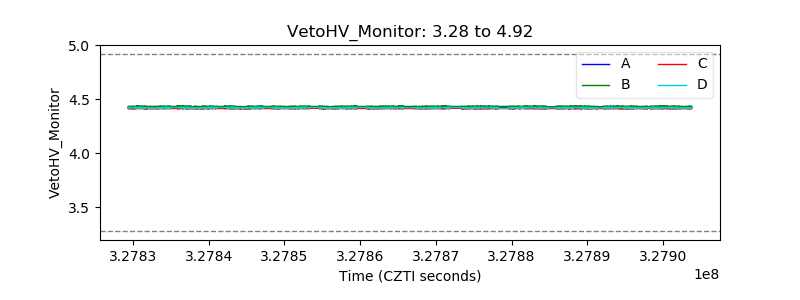 |
| Veto LLD |  |
| Alpha Counter |  |
| _CPM_Rate |  |
| CZT Counter |  |
| +2.5 Volts monitor |  |
| +5 Volts monitor | 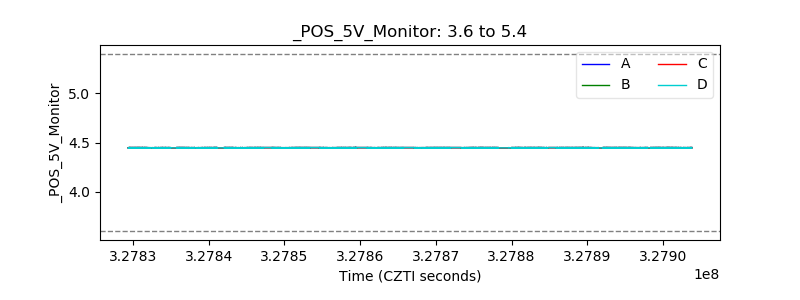 |
| _ROLL_ROT |  |
| _Roll_DEC |  |
| _Roll_RA |  |
| Veto Counter |  |