| Param | Original file | Final file |
|---|---|---|
| Filename | modeM0/AS1A07_018T07_9000003680_25136cztM0_level2.evt | modeM0/AS1A07_018T07_9000003680_25136cztM0_level2_quad_clean.evt |
| Size (bytes) | 498,386,880 | 82,428,480 |
| Size | 475.3 MB | 78.6 MB |
| Events in quadrant A | 2,917,584 | 525,006 |
| Events in quadrant B | 2,973,965 | 533,226 |
| Events in quadrant C | 4,341,026 | 502,145 |
| Events in quadrant D | 4,432,497 | 495,166 |
| Mode M0 | |||
|---|---|---|---|
| Quadrant | BADHDUFLAG | Total packets | Discarded packets |
| A | 0 | 12748 | 0 |
| B | 0 | 12838 | 0 |
| C | 0 | 16714 | 0 |
| D | 0 | 17271 | 0 |
| Mode M9 | |||
|---|---|---|---|
| Quadrant | BADHDUFLAG | Total packets | Discarded packets |
| A | 0 | 8 | 0 |
| B | 0 | 8 | 0 |
| C | 0 | 8 | 0 |
| D | 0 | 8 | 0 |
| Quadrant | Total seconds | Saturated seconds | Saturation percentage |
|---|---|---|---|
| A | 6313 | 53 | 0.839537% |
| B | 6313 | 74 | 1.172184% |
| C | 6313 | 498 | 7.888484% |
| D | 6313 | 217 | 3.437351% |
Noise dominated data is calculated using 1-second bins in cleaned event files. If a bin has >2000 counts, and if more than 50% of those come from <1% of pixels, then it is considered to be noise-dominated and hence unusable.
| Quadrant | # 1 sec bins | Bins with >0 counts | Bins with >2000 counts | High rate bins dominated by noise | Noise dominated (total time) | Noise dominated (detector-on time) | Marked lightcurve |
|---|---|---|---|---|---|---|---|
| A | 7058 | 6313 | 0 | 0 | 0.00% | 0.00% | 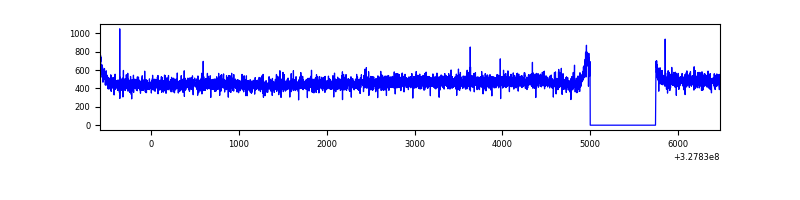 |
| B | 7058 | 6313 | 3 | 3 | 0.04% | 0.05% | 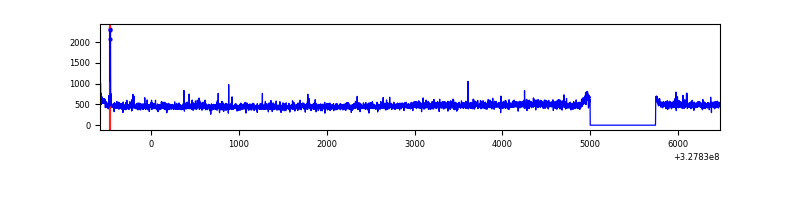 |
| C | 7058 | 6313 | 401 | 401 | 5.68% | 6.35% | 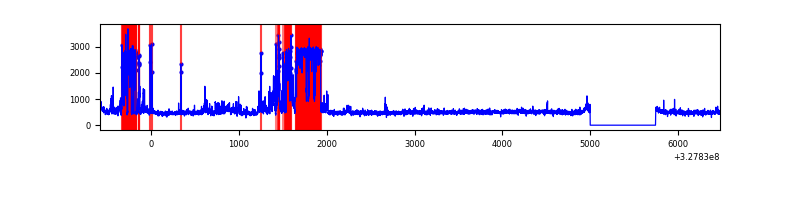 |
| D | 7058 | 6313 | 157 | 157 | 2.22% | 2.49% | 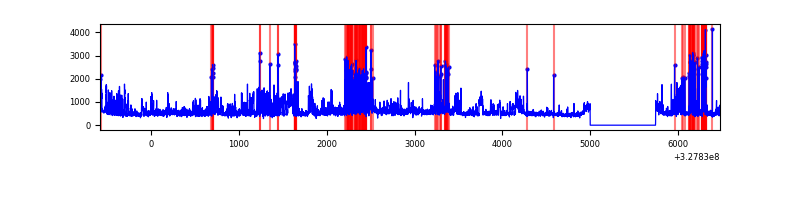 |
Top three noisy pixels from each quadrant. If the there are fewer than three noisy pixels in the level2.evt file, extra rows are filled as -1
| Pixel properties | Quadrant properties | ||||||
|---|---|---|---|---|---|---|---|
| Quadrant | DetID | PixID | Counts | Sigma | Mean | Median | Sigma |
| A | 13 | 254 | 9666 | 58.26 | 756 | 740 | 153.2 |
| A | 3 | 137 | 7117 | 41.62 | 756 | 740 | 153.2 |
| A | 0 | 226 | 6346 | 36.59 | 756 | 740 | 153.2 |
| B | 12 | 111 | 18454 | 122.12 | 752 | 733 | 145.1 |
| B | 11 | 111 | 16471 | 108.45 | 752 | 733 | 145.1 |
| B | 14 | 111 | 14962 | 98.05 | 752 | 733 | 145.1 |
| C | 7 | 247 | 1483856 | 9047.46 | 695 | 700 | 163.9 |
| C | 14 | 238 | 108309 | 656.43 | 695 | 700 | 163.9 |
| C | 7 | 87 | 26121 | 155.07 | 695 | 700 | 163.9 |
| D | 1 | 52 | 1169572 | 6553.26 | 727 | 704 | 178.4 |
| D | 8 | 195 | 285625 | 1597.41 | 727 | 704 | 178.4 |
| D | 2 | 244 | 164009 | 915.57 | 727 | 704 | 178.4 |
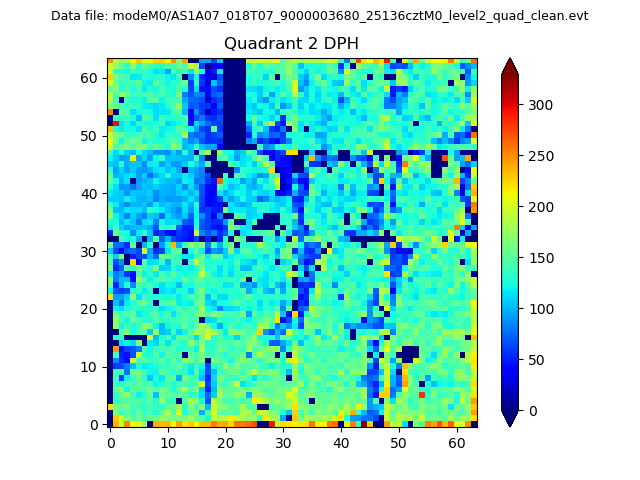
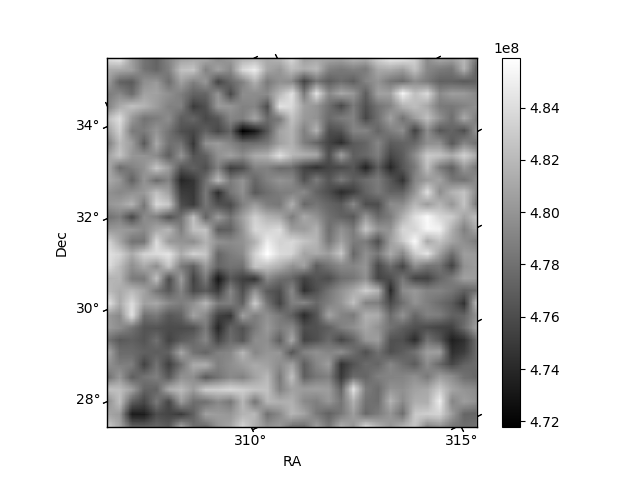
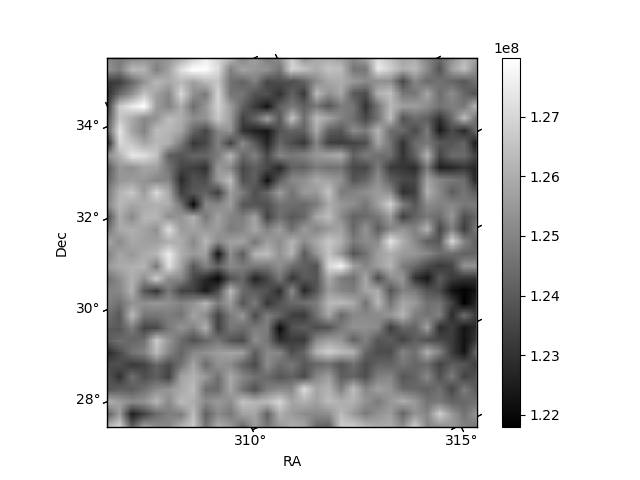
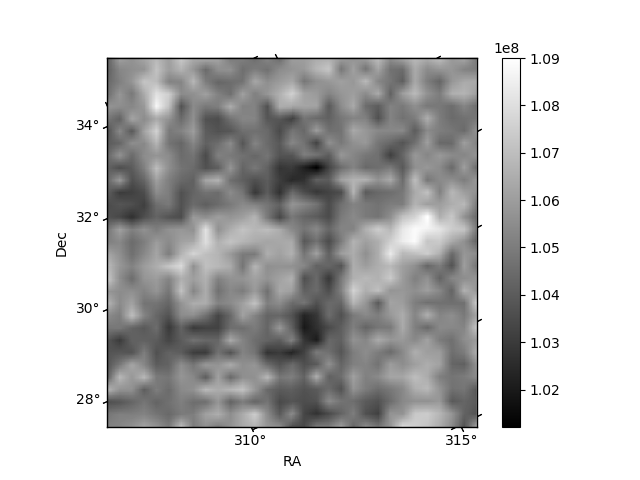
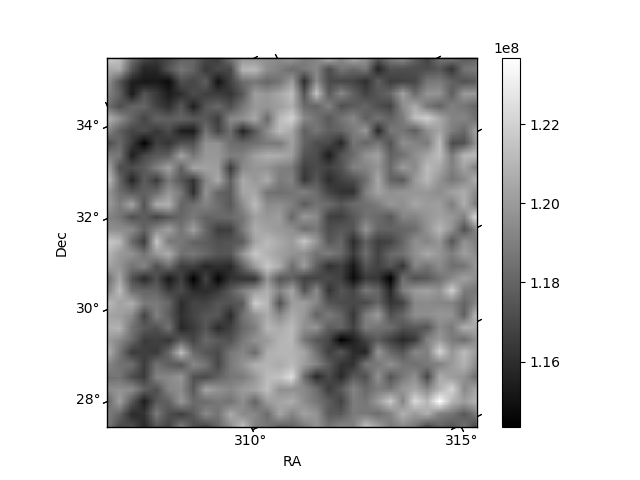
Histogram calculated using DETX and DETY for each event in the final _common_clean file
| Quadrant A | 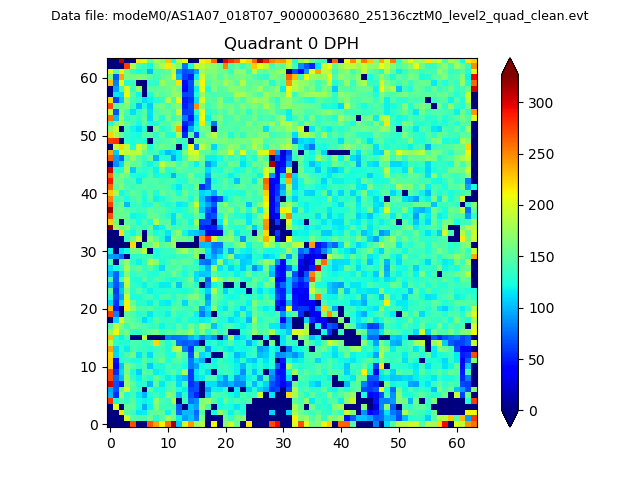 |
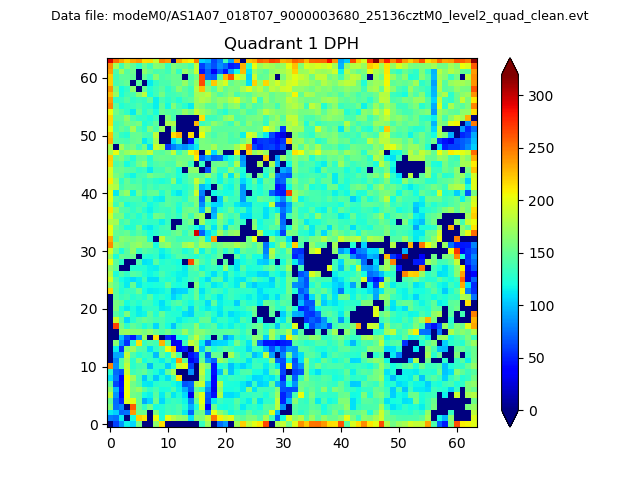 |
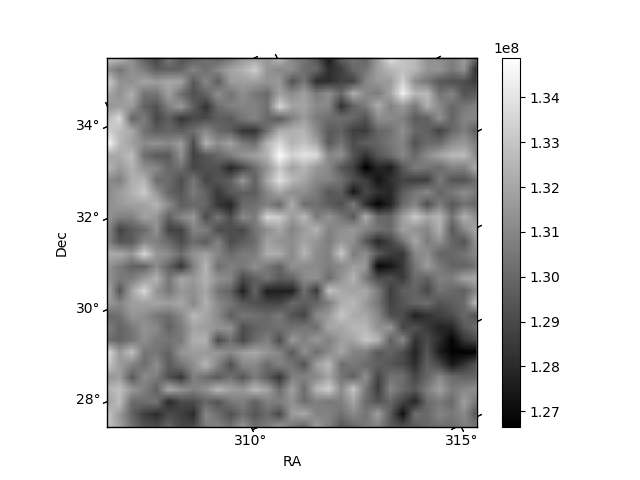
Quadrant B |
|---|---|---|---|
| Quadrant D | 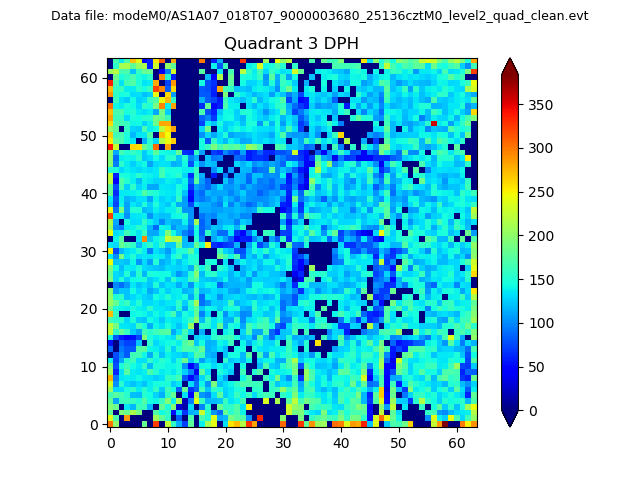 |
 |
Quadrant C |
| Plot type | Count rate plots | Images |
|---|---|---|
| Comparison with Poisson distribution Blue bars denote a histogram of data divided into 1 sec bins. Red curve is a Poisson curve with rate = median count rate of data. |
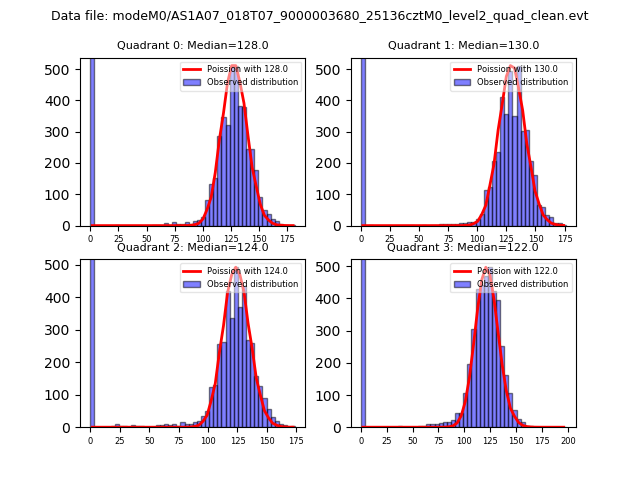 |
 |
| Quadrant-wise count rates Data is divided into 100 sec bins |
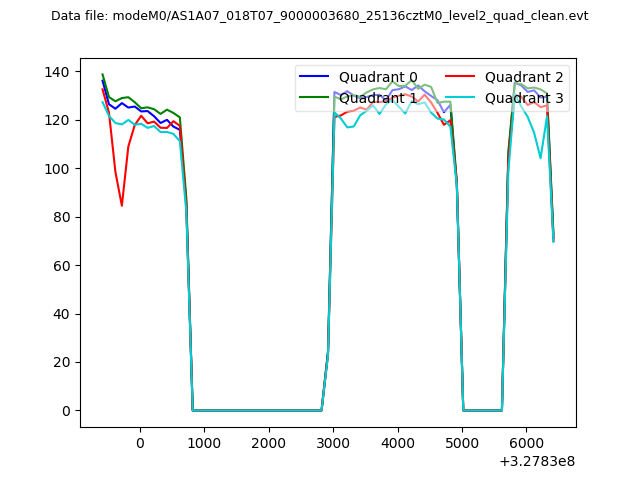 |
|
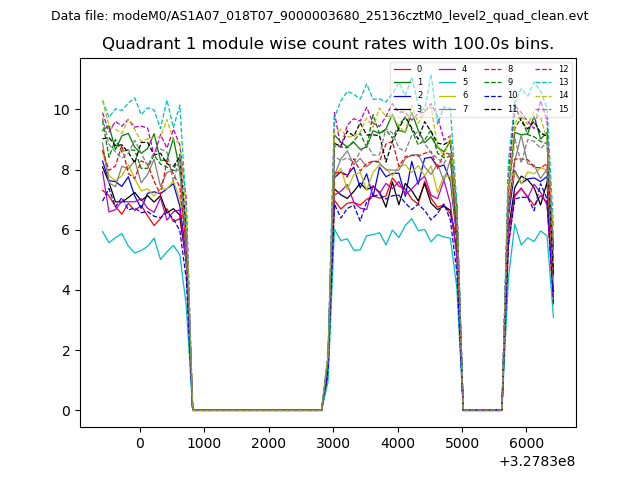
| Module-wise count rates for Quadrant A Data is divided into 100 sec bins |
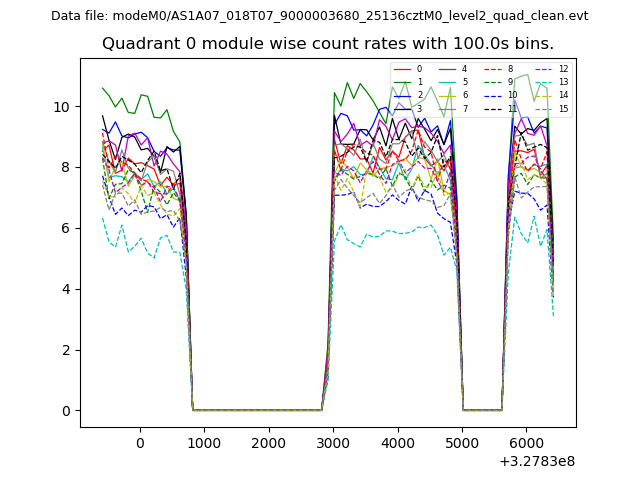 |
 |
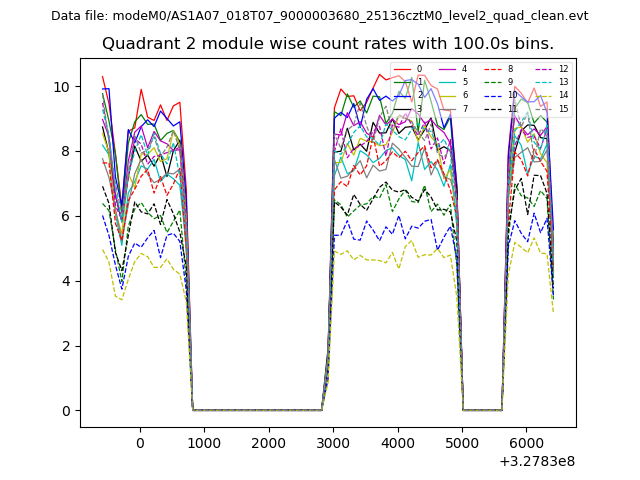
| Module-wise count rates for Quadrant B Data is divided into 100 sec bins |
 |
 |
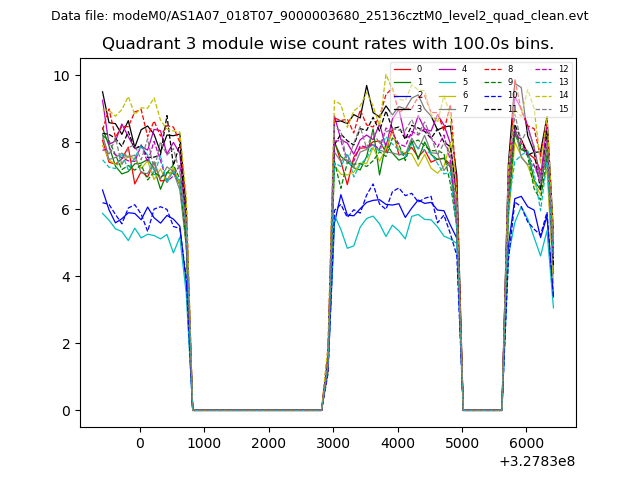
| Module-wise count rates for Quadrant C Data is divided into 100 sec bins |
 |
 |
| Module-wise count rates for Quadrant D Data is divided into 100 sec bins |
 |
 |
| Parameter | Plot |
|---|---|
| CZT HV Monitor | 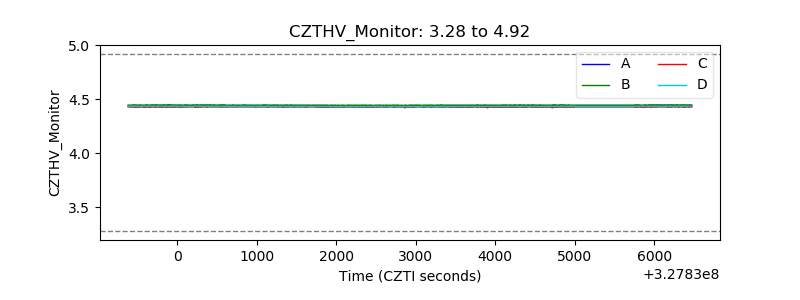 |
| D_VDD | 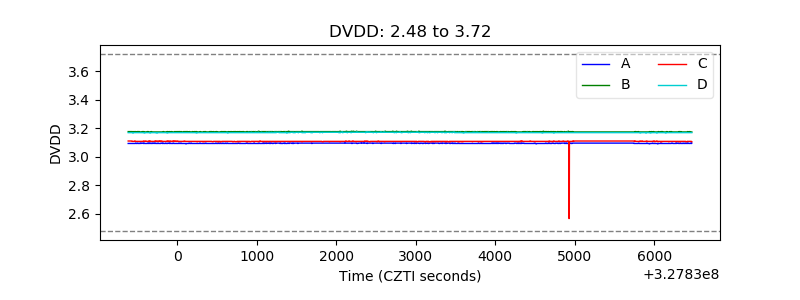 |
| Temperature 1 | 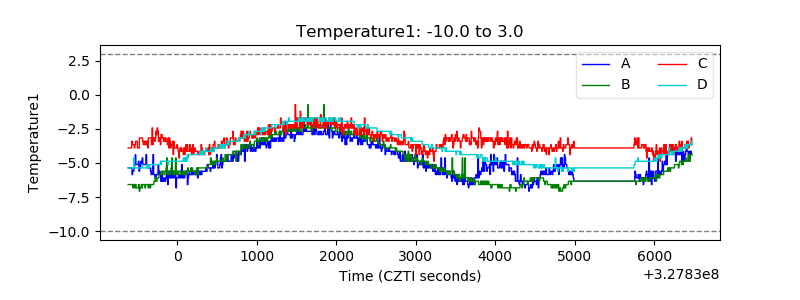 |
| Veto HV Monitor |  |
| Veto LLD | 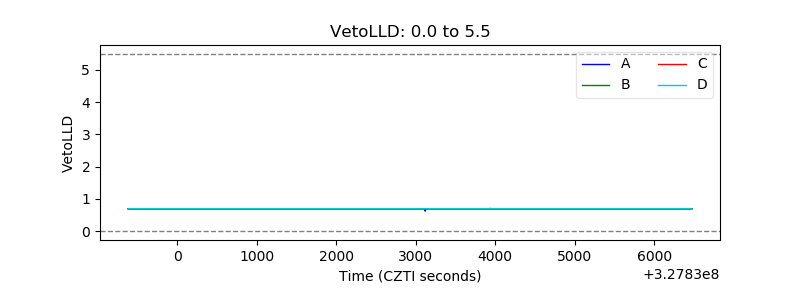 |
| Alpha Counter |  |
| _CPM_Rate | 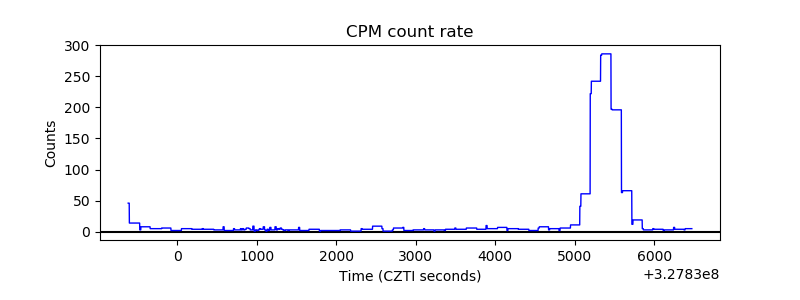 |
| CZT Counter | 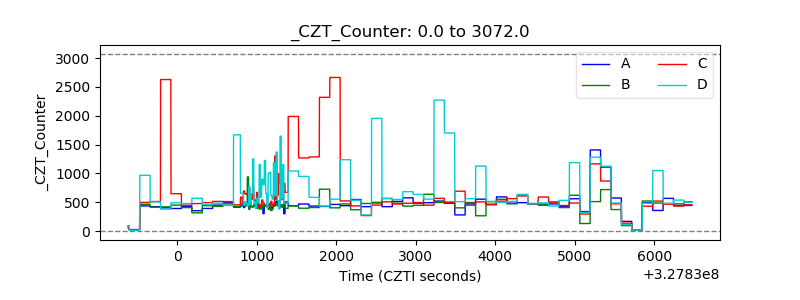 |
| +2.5 Volts monitor |  |
| +5 Volts monitor |  |
| _ROLL_ROT | 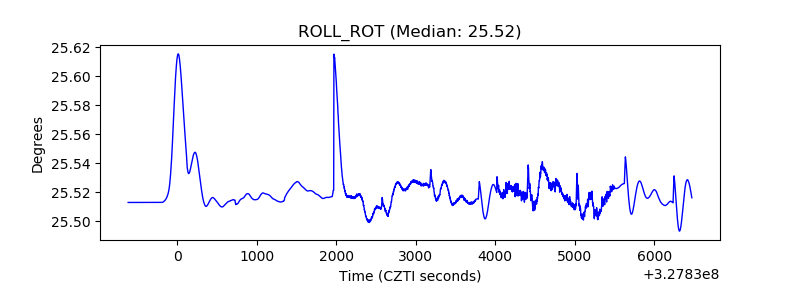 |
| _Roll_DEC | 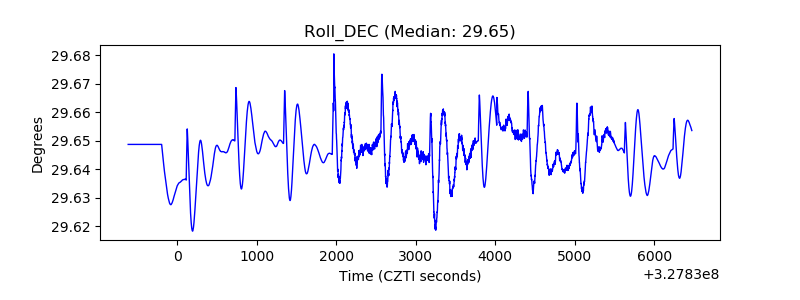 |
| _Roll_RA | 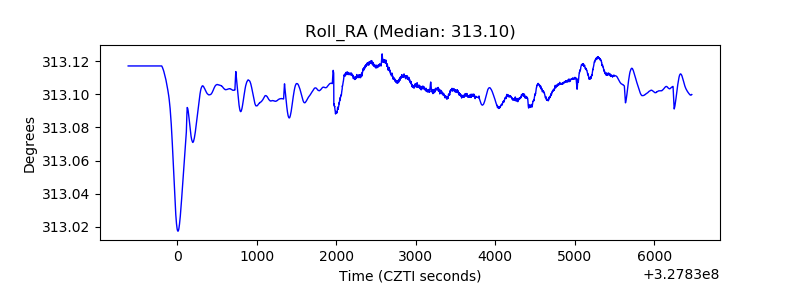 |
| Veto Counter | 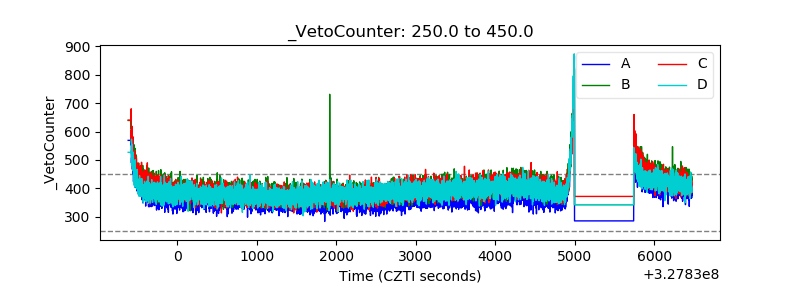 |