| Param | Original file | Final file |
|---|---|---|
| Filename | modeM0/AS1A07_018T07_9000003680_25138cztM0_level2.evt | modeM0/AS1A07_018T07_9000003680_25138cztM0_level2_quad_clean.evt |
| Size (bytes) | 582,923,520 | 68,218,560 |
| Size | 555.9 MB | 65.1 MB |
| Events in quadrant A | 3,376,322 | 413,501 |
| Events in quadrant B | 3,399,461 | 419,067 |
| Events in quadrant C | 4,614,355 | 393,362 |
| Events in quadrant D | 5,808,530 | 370,836 |
| Mode M0 | |||
|---|---|---|---|
| Quadrant | BADHDUFLAG | Total packets | Discarded packets |
| A | 0 | 14187 | 0 |
| B | 0 | 14162 | 0 |
| C | 0 | 18521 | 0 |
| D | 0 | 22036 | 0 |
| Mode M9 | |||
|---|---|---|---|
| Quadrant | BADHDUFLAG | Total packets | Discarded packets |
| A | 0 | 11 | 0 |
| B | 0 | 12 | 0 |
| C | 0 | 12 | 0 |
| D | 0 | 12 | 0 |
| Quadrant | Total seconds | Saturated seconds | Saturation percentage |
|---|---|---|---|
| A | 6723 | 75 | 1.115573% |
| B | 6723 | 85 | 1.264317% |
| C | 6723 | 232 | 3.450840% |
| D | 6723 | 580 | 8.627101% |
Noise dominated data is calculated using 1-second bins in cleaned event files. If a bin has >2000 counts, and if more than 50% of those come from <1% of pixels, then it is considered to be noise-dominated and hence unusable.
| Quadrant | # 1 sec bins | Bins with >0 counts | Bins with >2000 counts | High rate bins dominated by noise | Noise dominated (total time) | Noise dominated (detector-on time) | Marked lightcurve |
|---|---|---|---|---|---|---|---|
| A | 7748 | 6723 | 0 | 0 | 0.00% | 0.00% | 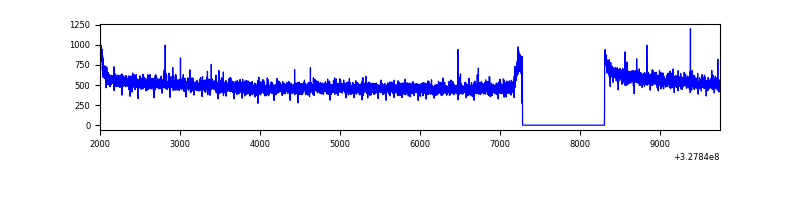 |
| B | 7748 | 6723 | 0 | 0 | 0.00% | 0.00% | 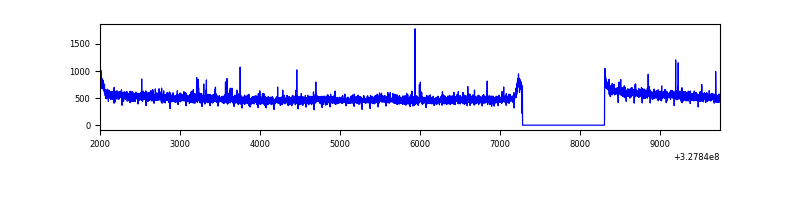 |
| C | 7748 | 6723 | 90 | 90 | 1.16% | 1.34% | 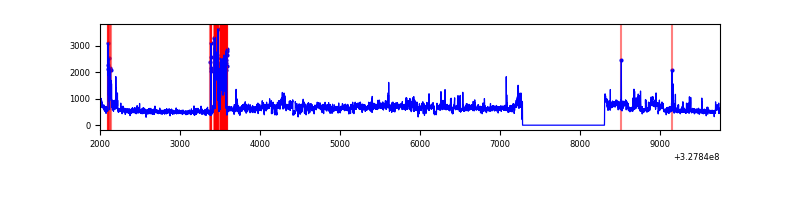 |
| D | 7748 | 6723 | 480 | 480 | 6.20% | 7.14% | 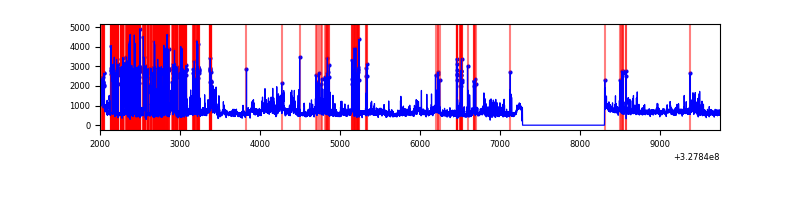 |
Top three noisy pixels from each quadrant. If the there are fewer than three noisy pixels in the level2.evt file, extra rows are filled as -1
| Pixel properties | Quadrant properties | ||||||
|---|---|---|---|---|---|---|---|
| Quadrant | DetID | PixID | Counts | Sigma | Mean | Median | Sigma |
| A | 13 | 254 | 11227 | 59.35 | 873 | 855 | 174.8 |
| A | 3 | 137 | 7823 | 39.87 | 873 | 855 | 174.8 |
| A | 0 | 226 | 7533 | 38.21 | 873 | 855 | 174.8 |
| B | 12 | 111 | 20336 | 116.96 | 861 | 841 | 166.7 |
| B | 11 | 111 | 18214 | 104.23 | 861 | 841 | 166.7 |
| B | 14 | 111 | 16112 | 91.62 | 861 | 841 | 166.7 |
| C | 7 | 247 | 813261 | 4229.13 | 821 | 827 | 192.1 |
| C | 9 | 54 | 300677 | 1560.87 | 821 | 827 | 192.1 |
| C | 2 | 16 | 159926 | 828.19 | 821 | 827 | 192.1 |
| D | 1 | 52 | 1562217 | 8020.44 | 803 | 780 | 194.7 |
| D | 8 | 195 | 526033 | 2698.0 | 803 | 780 | 194.7 |
| D | 12 | 235 | 483456 | 2479.3 | 803 | 780 | 194.7 |
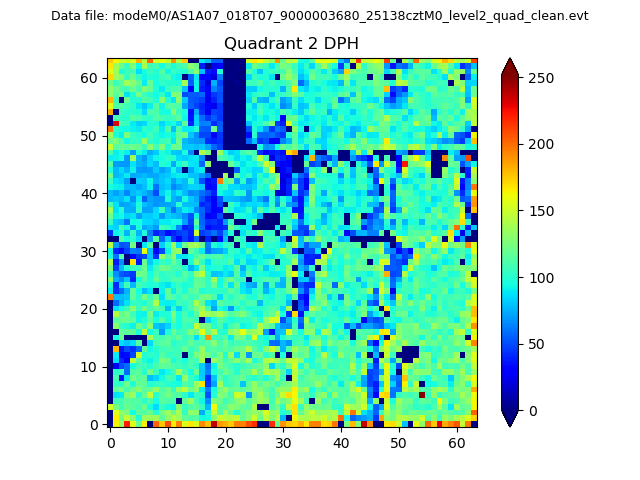
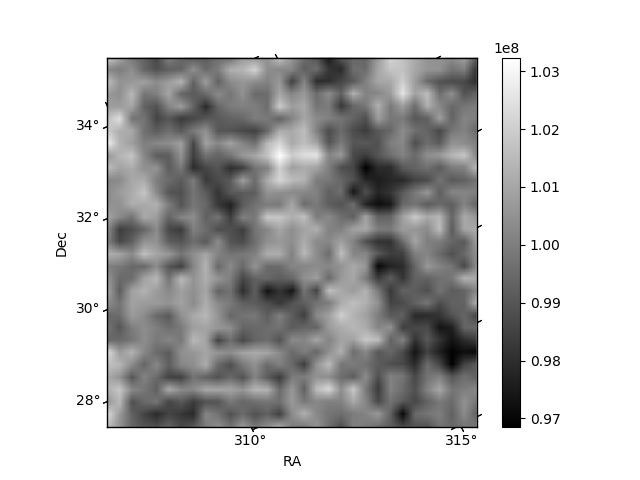
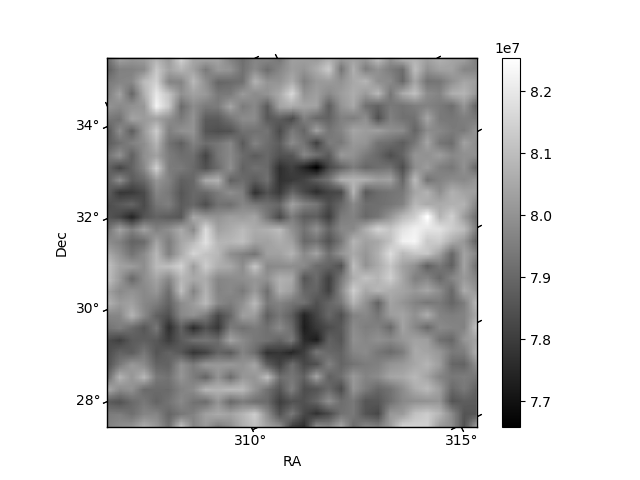
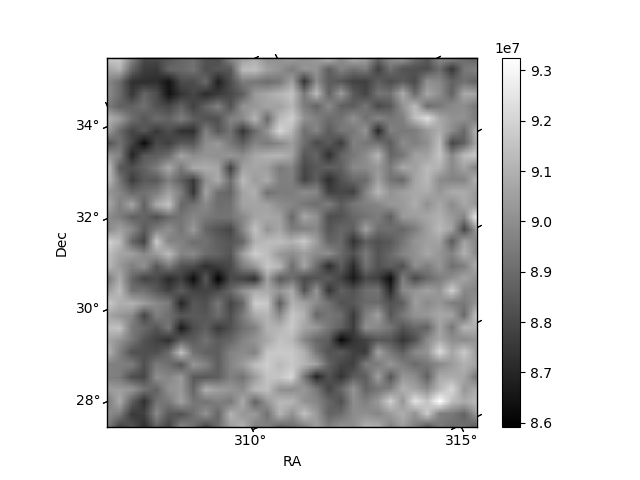
Histogram calculated using DETX and DETY for each event in the final _common_clean file
| Quadrant A | 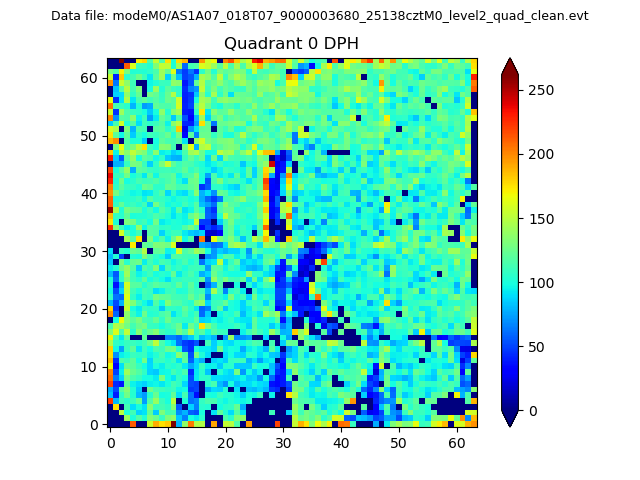 |
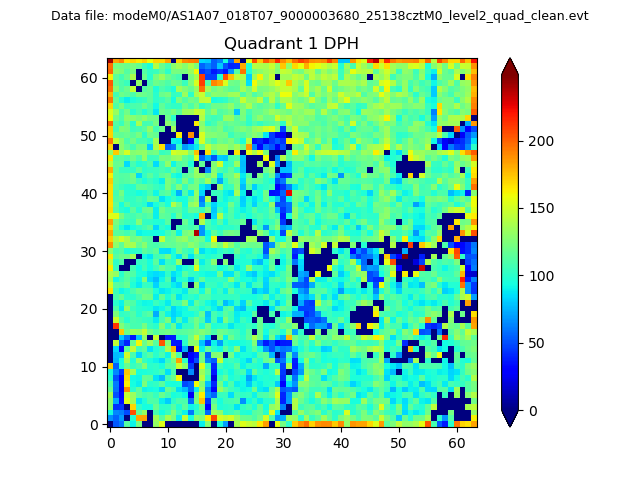 |
Quadrant B |
|---|---|---|---|
| Quadrant D | 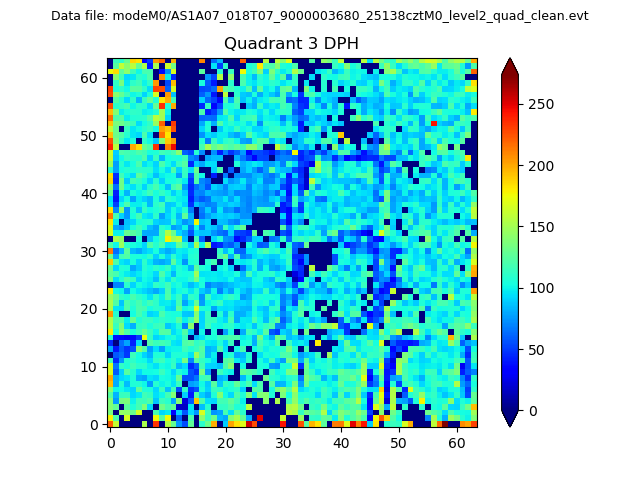 |
 |
Quadrant C |
| Plot type | Count rate plots | Images |
|---|---|---|
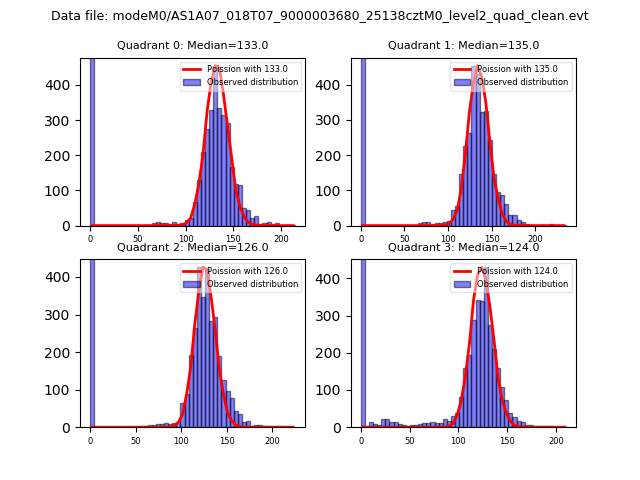
| Comparison with Poisson distribution Blue bars denote a histogram of data divided into 1 sec bins. Red curve is a Poisson curve with rate = median count rate of data. |
 |
 |
| Quadrant-wise count rates Data is divided into 100 sec bins |
 |
|
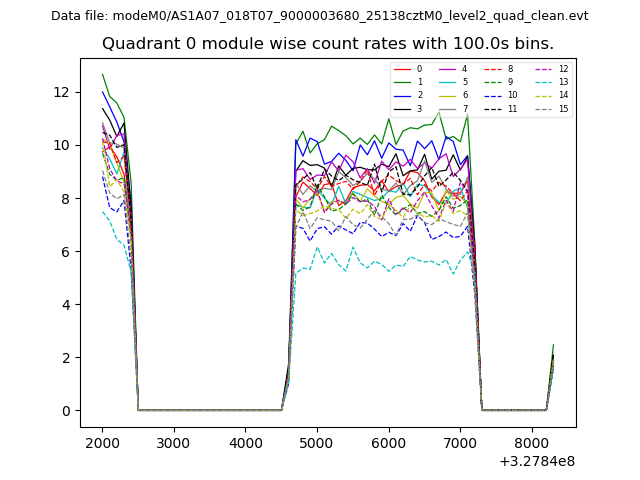
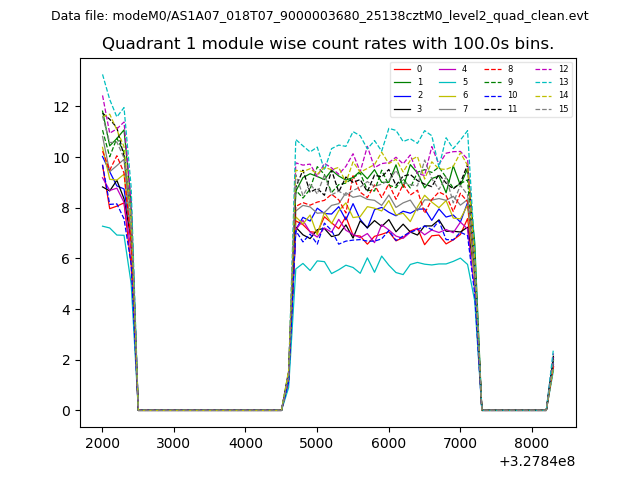
| Module-wise count rates for Quadrant A Data is divided into 100 sec bins |
 |
 |
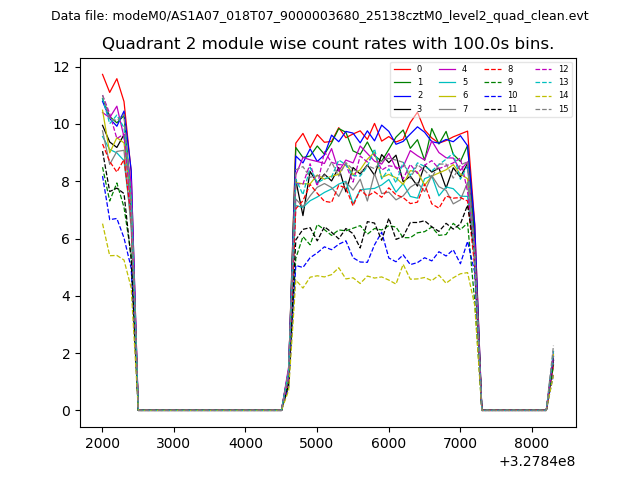
| Module-wise count rates for Quadrant B Data is divided into 100 sec bins |
 |
 |
| Module-wise count rates for Quadrant C Data is divided into 100 sec bins |
 |
 |
| Module-wise count rates for Quadrant D Data is divided into 100 sec bins |
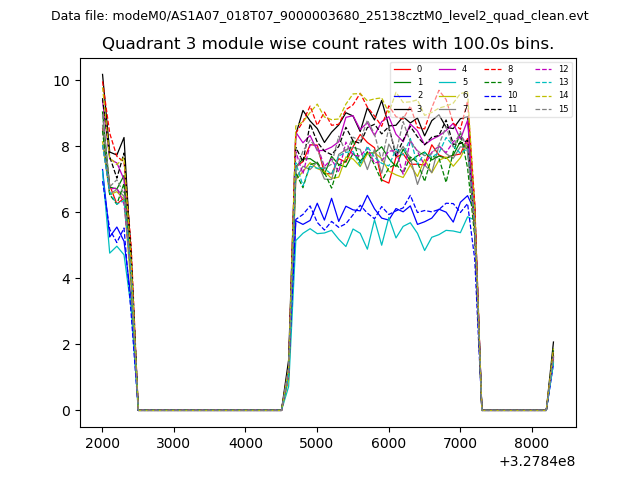 |
 |
| Parameter | Plot |
|---|---|
| CZT HV Monitor | 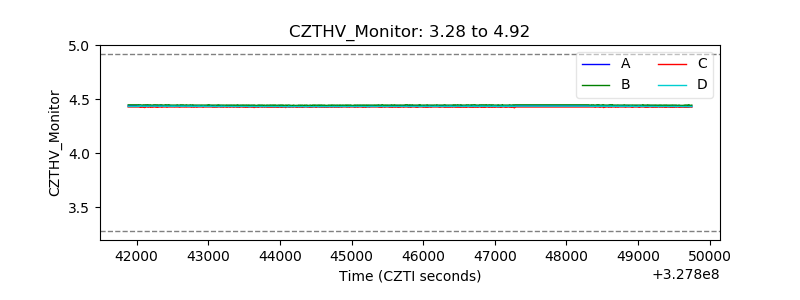 |
| D_VDD | 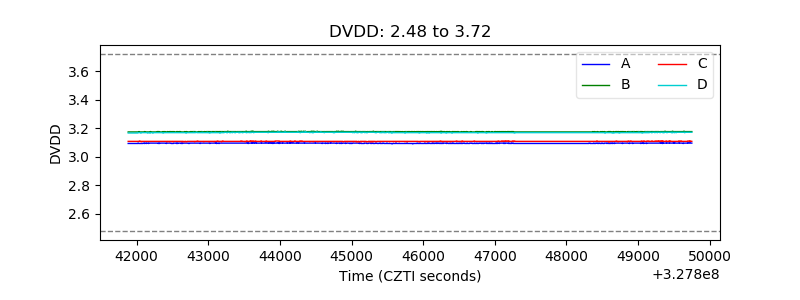 |
| Temperature 1 | 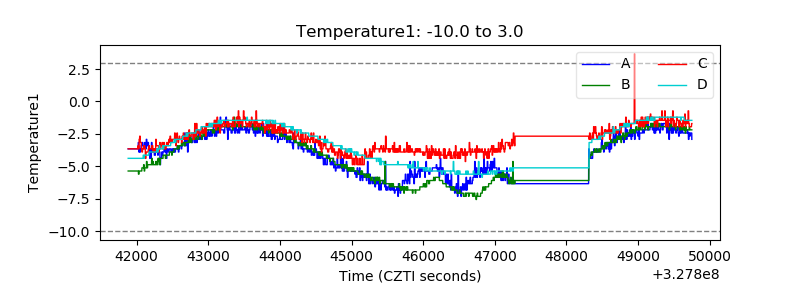 |
| Veto HV Monitor | 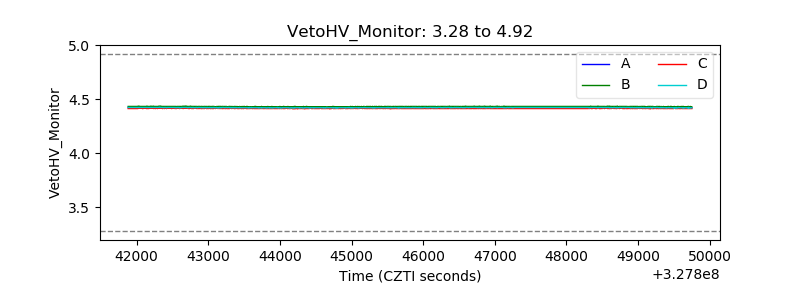 |
| Veto LLD | 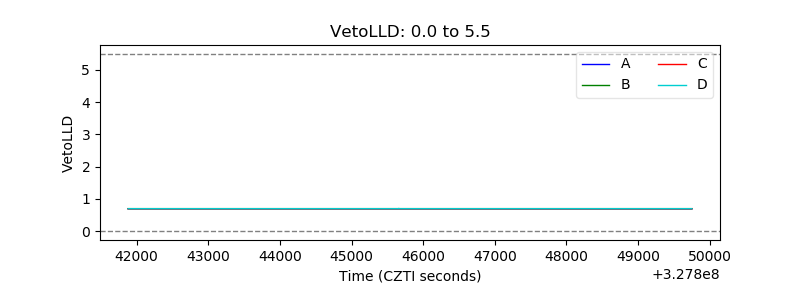 |
| Alpha Counter | 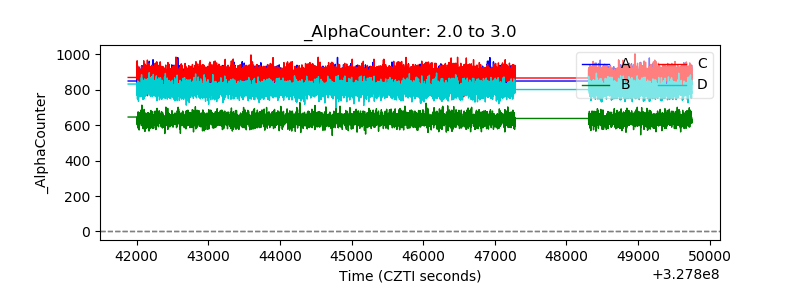 |
| _CPM_Rate | 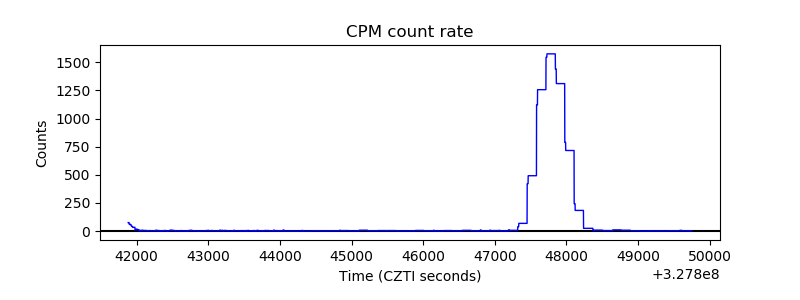 |
| CZT Counter | 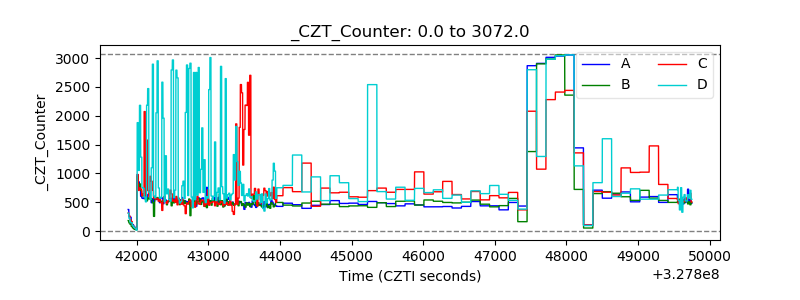 |
| +2.5 Volts monitor |  |
| +5 Volts monitor |  |
| _ROLL_ROT | 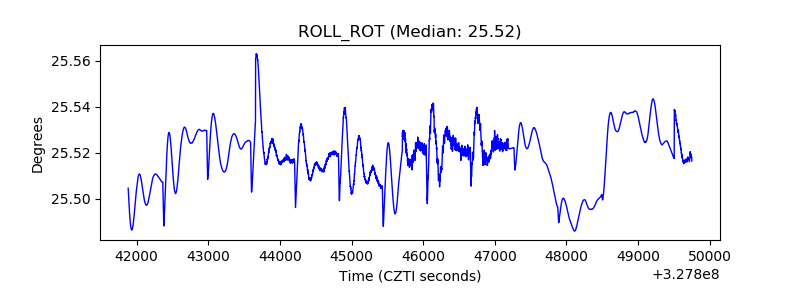 |
| _Roll_DEC | 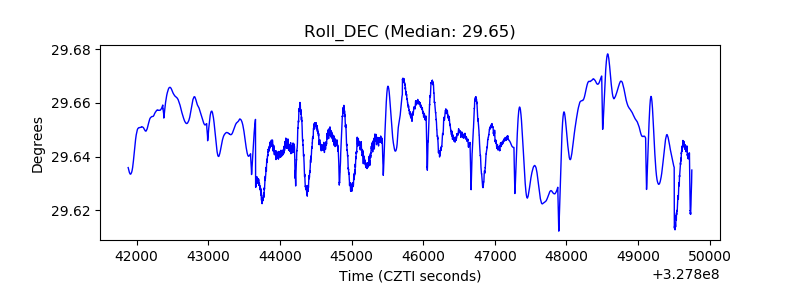 |
| _Roll_RA | 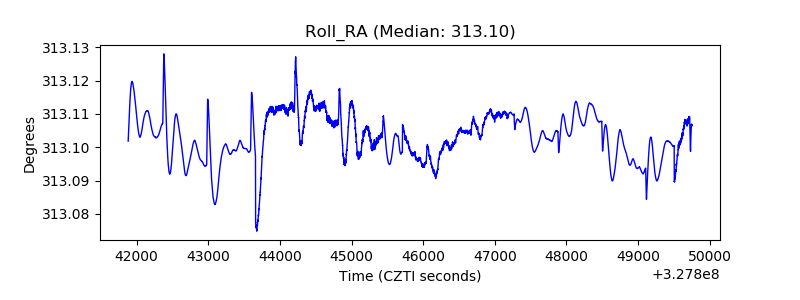 |
| Veto Counter | 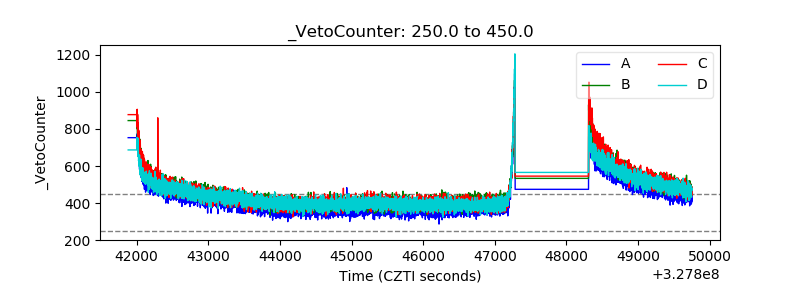 |