| Param | Original file | Final file |
|---|---|---|
| Filename | modeM0/AS1A07_018T07_9000003680_25141cztM0_level2.evt | modeM0/AS1A07_018T07_9000003680_25141cztM0_level2_quad_clean.evt |
| Size (bytes) | 536,215,680 | 73,699,200 |
| Size | 511.4 MB | 70.3 MB |
| Events in quadrant A | 3,394,906 | 458,095 |
| Events in quadrant B | 3,445,608 | 464,412 |
| Events in quadrant C | 4,192,941 | 441,810 |
| Events in quadrant D | 4,788,046 | 436,391 |
| Mode M0 | |||
|---|---|---|---|
| Quadrant | BADHDUFLAG | Total packets | Discarded packets |
| A | 0 | 14214 | 0 |
| B | 0 | 14293 | 0 |
| C | 0 | 16494 | 0 |
| D | 0 | 18589 | 0 |
| Mode M9 | |||
|---|---|---|---|
| Quadrant | BADHDUFLAG | Total packets | Discarded packets |
| A | 0 | 13 | 0 |
| B | 0 | 13 | 0 |
| C | 0 | 13 | 0 |
| D | 0 | 13 | 0 |
| Quadrant | Total seconds | Saturated seconds | Saturation percentage |
|---|---|---|---|
| A | 6175 | 71 | 1.149798% |
| B | 6176 | 86 | 1.392487% |
| C | 6176 | 226 | 3.659326% |
| D | 6175 | 244 | 3.951417% |
Noise dominated data is calculated using 1-second bins in cleaned event files. If a bin has >2000 counts, and if more than 50% of those come from <1% of pixels, then it is considered to be noise-dominated and hence unusable.
| Quadrant | # 1 sec bins | Bins with >0 counts | Bins with >2000 counts | High rate bins dominated by noise | Noise dominated (total time) | Noise dominated (detector-on time) | Marked lightcurve |
|---|---|---|---|---|---|---|---|
| A | 7445 | 6175 | 0 | 0 | 0.00% | 0.00% | 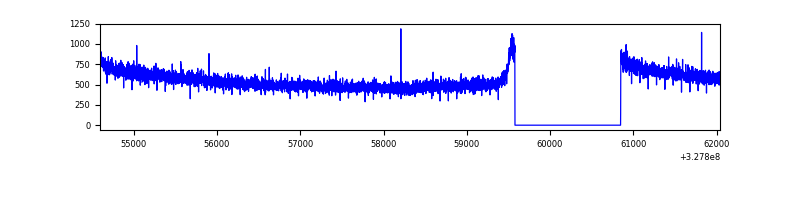 |
| B | 7446 | 6176 | 2 | 2 | 0.03% | 0.03% | 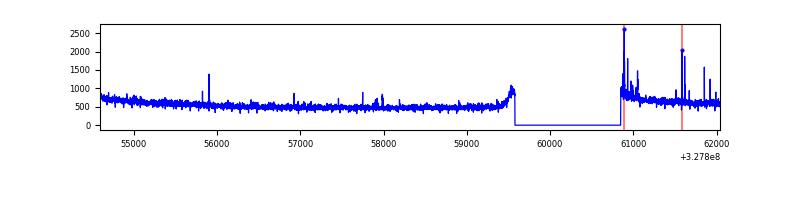 |
| C | 7446 | 6176 | 18 | 18 | 0.24% | 0.29% | 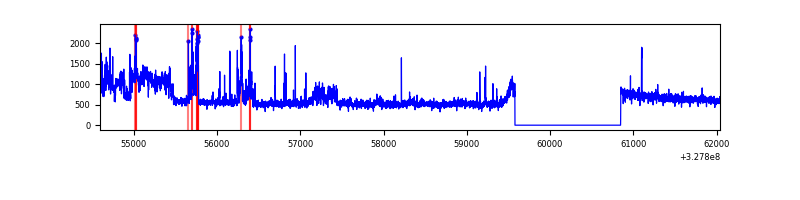 |
| D | 7445 | 6175 | 134 | 134 | 1.80% | 2.17% | 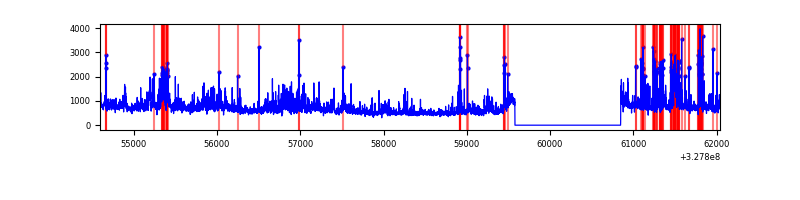 |
Top three noisy pixels from each quadrant. If the there are fewer than three noisy pixels in the level2.evt file, extra rows are filled as -1
| Pixel properties | Quadrant properties | ||||||
|---|---|---|---|---|---|---|---|
| Quadrant | DetID | PixID | Counts | Sigma | Mean | Median | Sigma |
| A | 13 | 254 | 10688 | 56.33 | 878 | 865 | 174.4 |
| A | 0 | 226 | 7517 | 38.14 | 878 | 865 | 174.4 |
| A | 3 | 137 | 7209 | 36.38 | 878 | 865 | 174.4 |
| B | 3 | 64 | 35915 | 215.87 | 869 | 851 | 162.4 |
| B | 12 | 111 | 18854 | 110.84 | 869 | 851 | 162.4 |
| B | 11 | 111 | 16973 | 99.25 | 869 | 851 | 162.4 |
| C | 7 | 247 | 443690 | 2276.43 | 843 | 852 | 194.5 |
| C | 0 | 239 | 287269 | 1472.34 | 843 | 852 | 194.5 |
| C | 14 | 238 | 137258 | 701.2 | 843 | 852 | 194.5 |
| D | 1 | 52 | 853040 | 4194.47 | 848 | 826 | 203.2 |
| D | 8 | 195 | 329830 | 1619.31 | 848 | 826 | 203.2 |
| D | 12 | 235 | 256450 | 1258.14 | 848 | 826 | 203.2 |
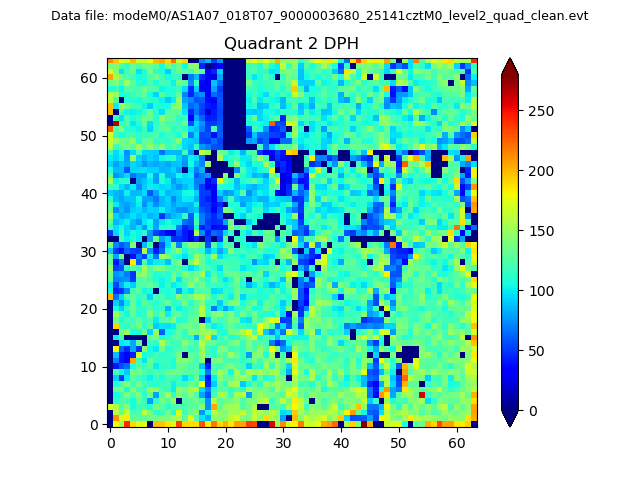
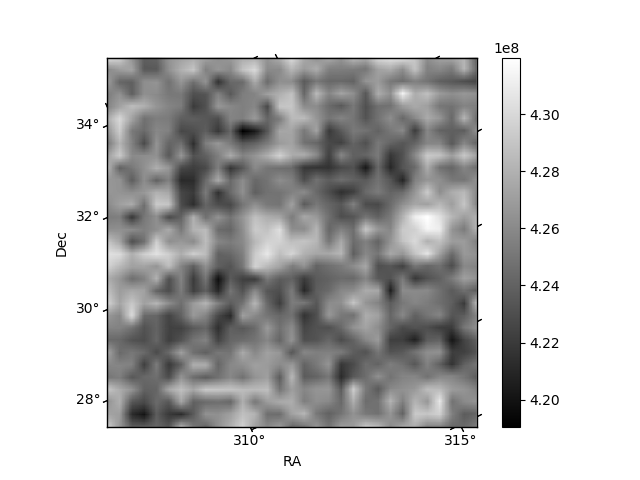
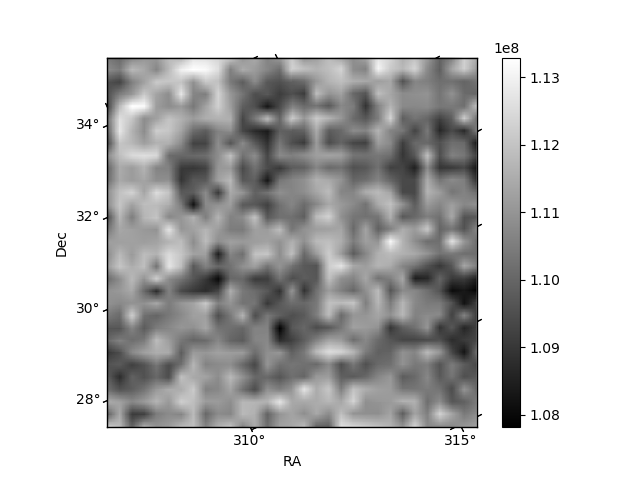
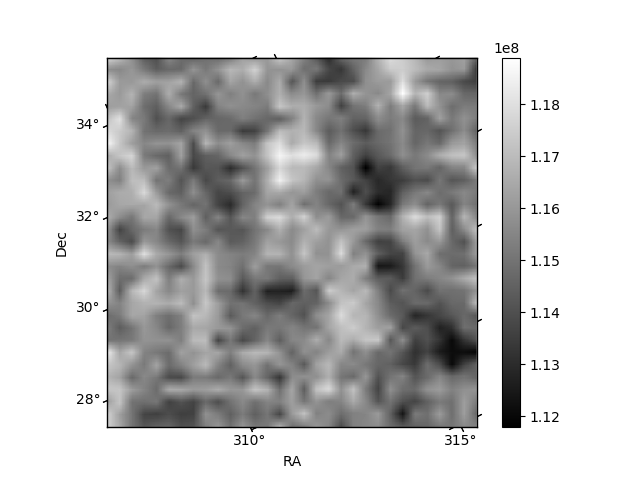
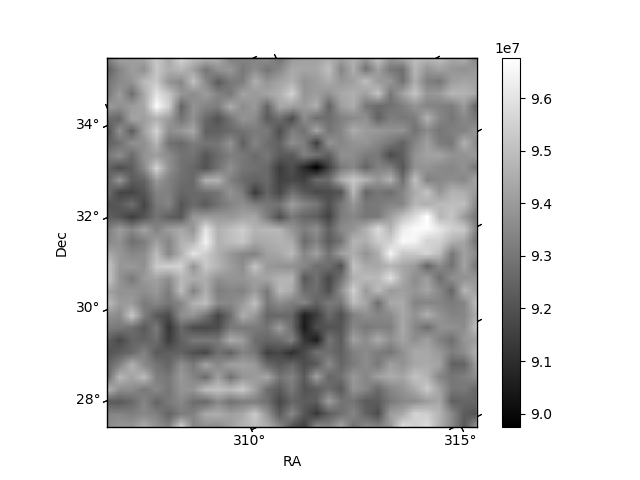
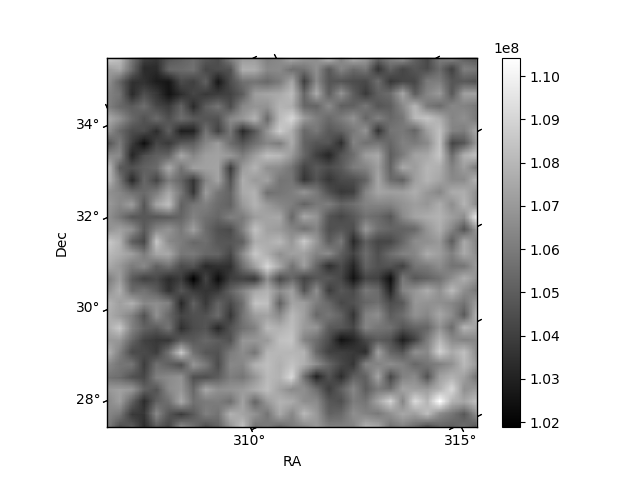
Histogram calculated using DETX and DETY for each event in the final _common_clean file
| Quadrant A | 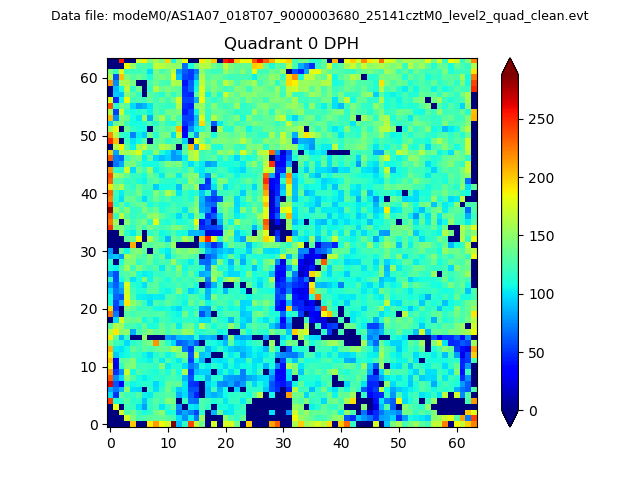 |
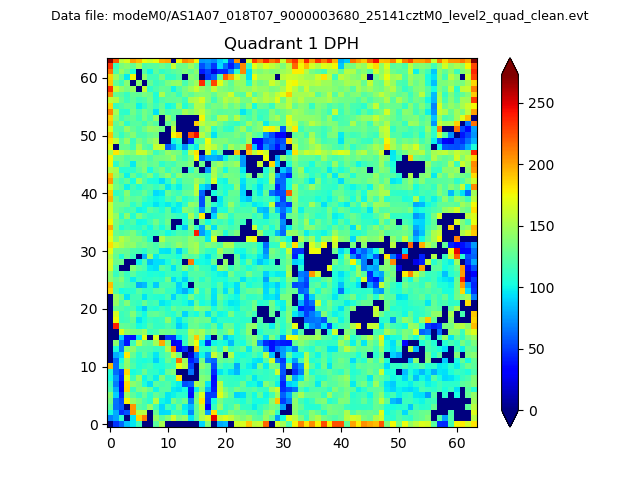 |
Quadrant B |
|---|---|---|---|
| Quadrant D | 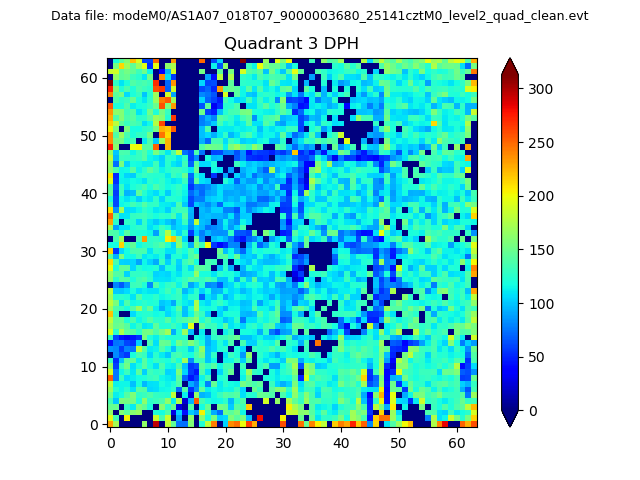 |
 |
Quadrant C |
| Plot type | Count rate plots | Images |
|---|---|---|
| Comparison with Poisson distribution Blue bars denote a histogram of data divided into 1 sec bins. Red curve is a Poisson curve with rate = median count rate of data. |
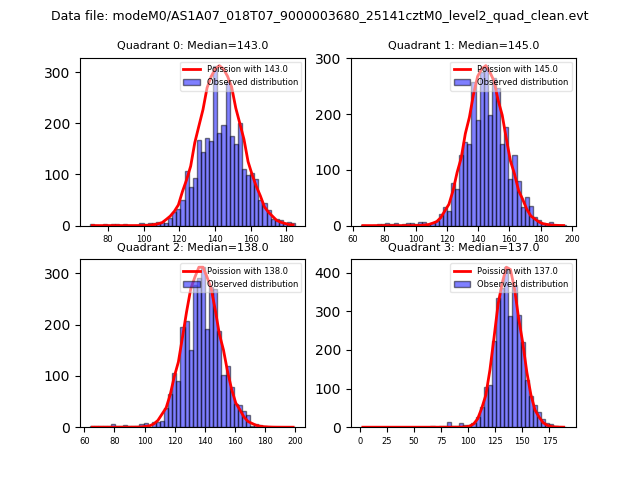 |
 |
| Quadrant-wise count rates Data is divided into 100 sec bins |
 |
|
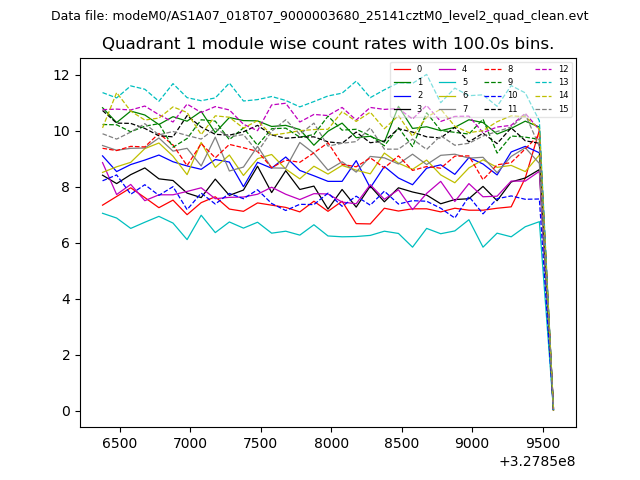
| Module-wise count rates for Quadrant A Data is divided into 100 sec bins |
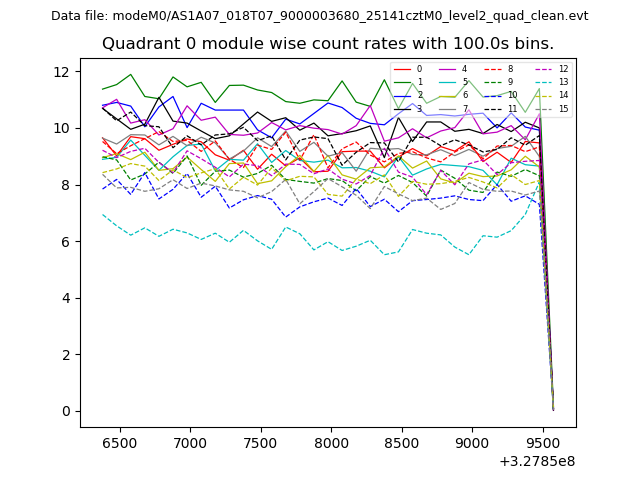 |
 |
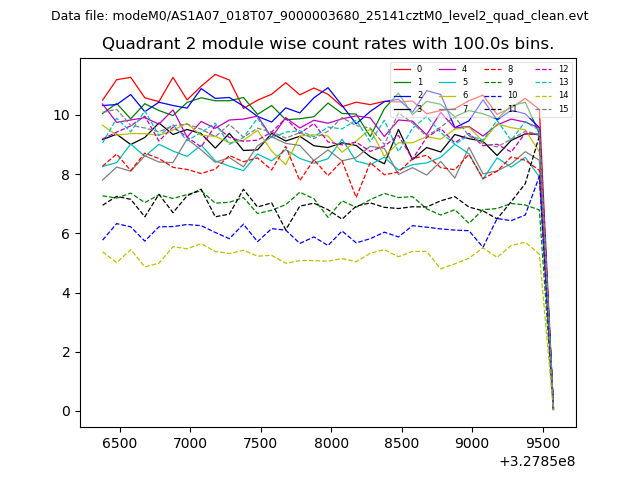
| Module-wise count rates for Quadrant B Data is divided into 100 sec bins |
 |
 |
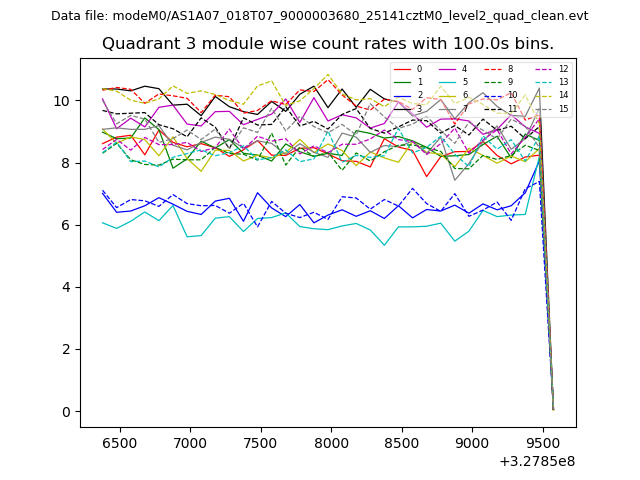
| Module-wise count rates for Quadrant C Data is divided into 100 sec bins |
 |
 |
| Module-wise count rates for Quadrant D Data is divided into 100 sec bins |
 |
 |
| Parameter | Plot |
|---|---|
| CZT HV Monitor | 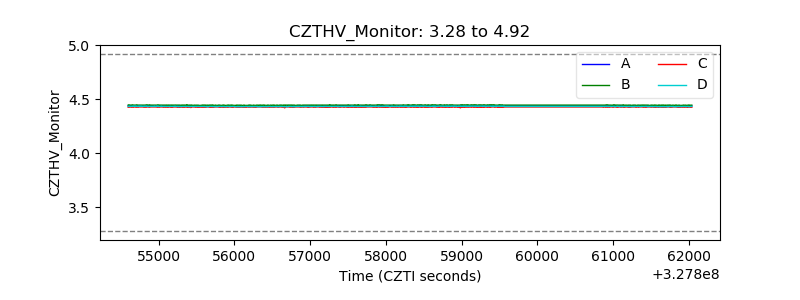 |
| D_VDD | 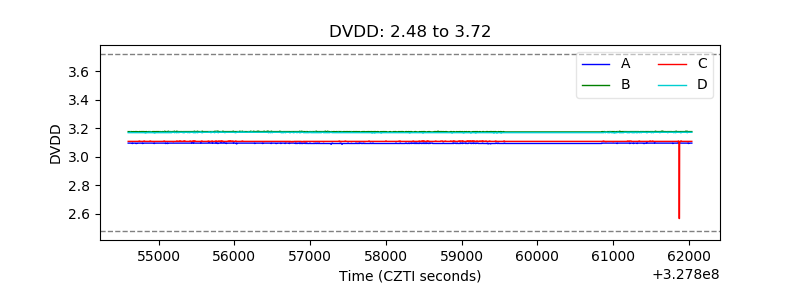 |
| Temperature 1 | 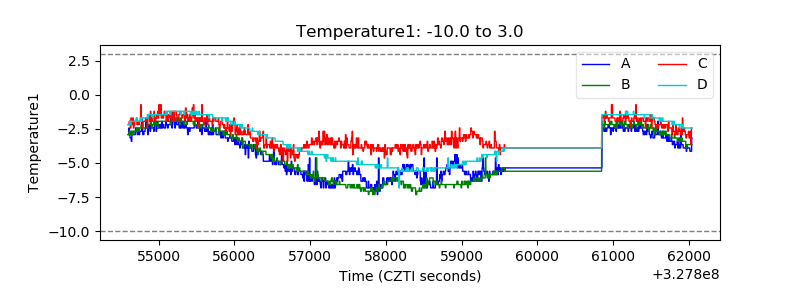 |
| Veto HV Monitor | 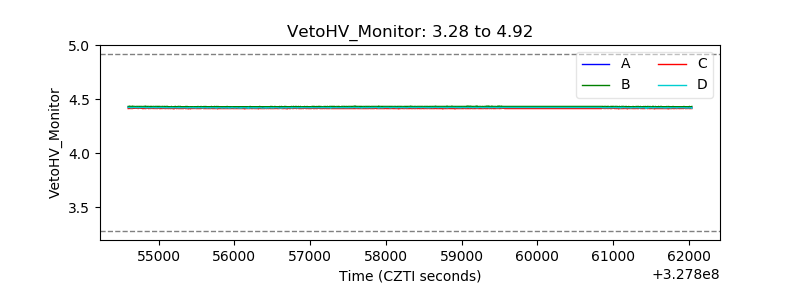 |
| Veto LLD | 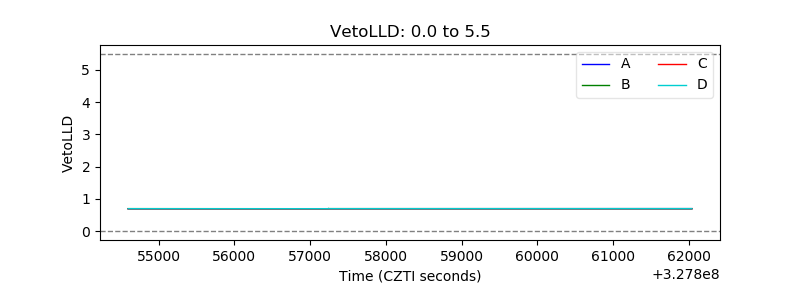 |
| Alpha Counter |  |
| _CPM_Rate | 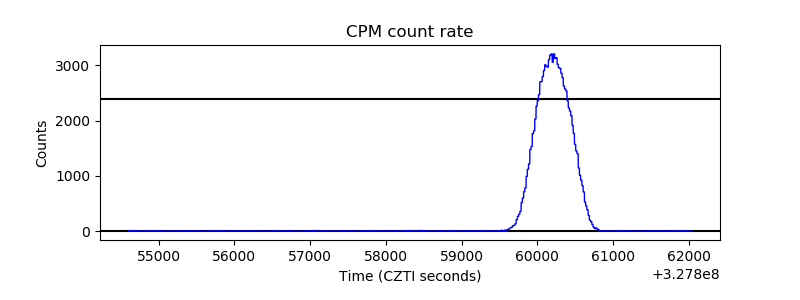 |
| CZT Counter | 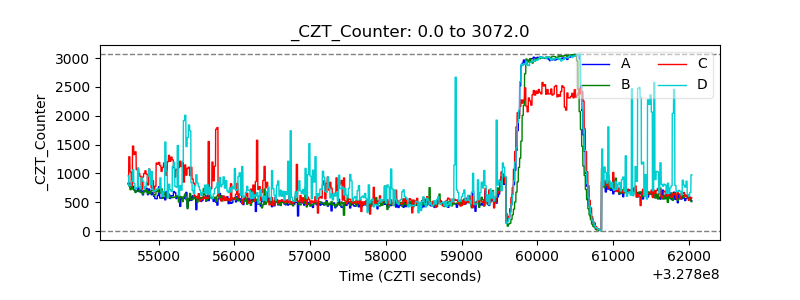 |
| +2.5 Volts monitor |  |
| +5 Volts monitor |  |
| _ROLL_ROT | 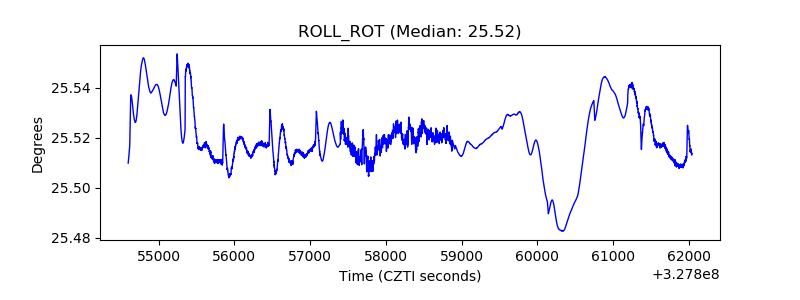 |
| _Roll_DEC | 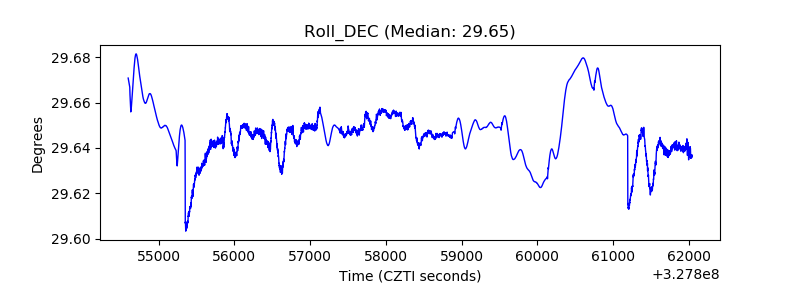 |
| _Roll_RA | 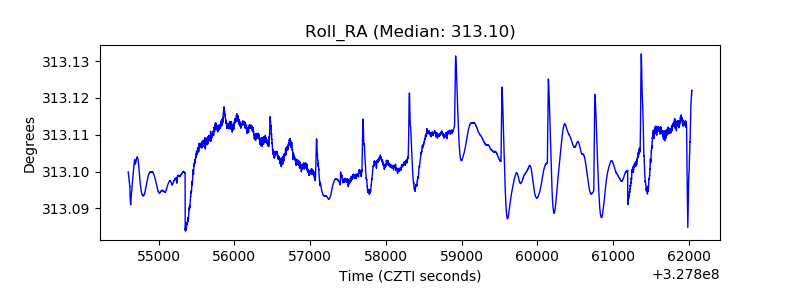 |
| Veto Counter |  |