| Param | Original file | Final file |
|---|---|---|
| Filename | modeM0/AS1A07_018T07_9000003680_25142cztM0_level2.evt | modeM0/AS1A07_018T07_9000003680_25142cztM0_level2_quad_clean.evt |
| Size (bytes) | 515,540,160 | 89,009,280 |
| Size | 491.7 MB | 84.9 MB |
| Events in quadrant A | 3,389,829 | 576,111 |
| Events in quadrant B | 3,553,547 | 585,218 |
| Events in quadrant C | 3,592,300 | 563,474 |
| Events in quadrant D | 4,664,801 | 545,316 |
| Mode M0 | |||
|---|---|---|---|
| Quadrant | BADHDUFLAG | Total packets | Discarded packets |
| A | 0 | 14166 | 0 |
| B | 0 | 14613 | 0 |
| C | 0 | 14821 | 0 |
| D | 0 | 18091 | 0 |
| Mode M9 | |||
|---|---|---|---|
| Quadrant | BADHDUFLAG | Total packets | Discarded packets |
| A | 0 | 14 | 0 |
| B | 0 | 14 | 0 |
| C | 0 | 14 | 0 |
| D | 0 | 14 | 0 |
| Quadrant | Total seconds | Saturated seconds | Saturation percentage |
|---|---|---|---|
| A | 6099 | 38 | 0.623053% |
| B | 6099 | 76 | 1.246106% |
| C | 6098 | 130 | 2.131847% |
| D | 6099 | 284 | 4.656501% |
Noise dominated data is calculated using 1-second bins in cleaned event files. If a bin has >2000 counts, and if more than 50% of those come from <1% of pixels, then it is considered to be noise-dominated and hence unusable.
| Quadrant | # 1 sec bins | Bins with >0 counts | Bins with >2000 counts | High rate bins dominated by noise | Noise dominated (total time) | Noise dominated (detector-on time) | Marked lightcurve |
|---|---|---|---|---|---|---|---|
| A | 7454 | 6100 | 0 | 0 | 0.00% | 0.00% | 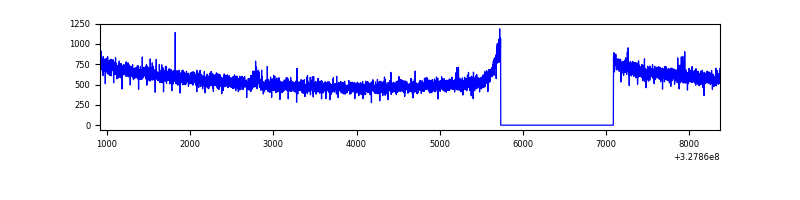 |
| B | 7454 | 6099 | 11 | 11 | 0.15% | 0.18% | 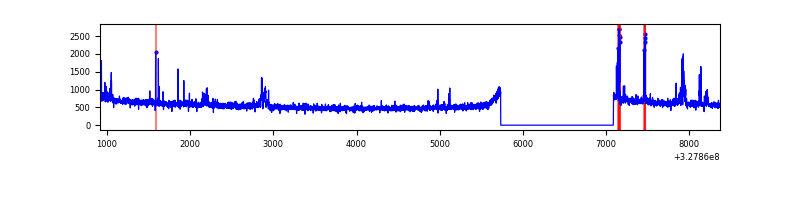 |
| C | 7453 | 6098 | 6 | 6 | 0.08% | 0.10% | 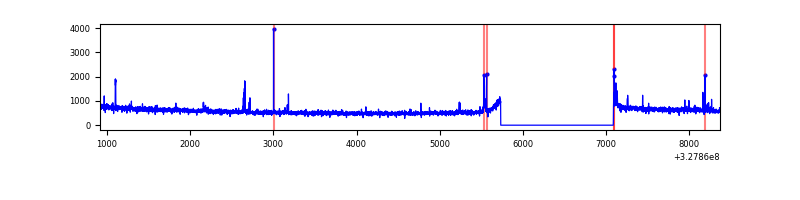 |
| D | 7454 | 6099 | 200 | 200 | 2.68% | 3.28% | 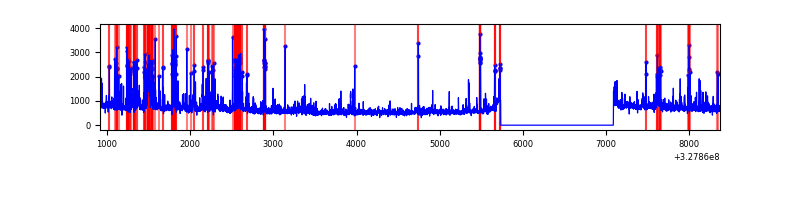 |
Top three noisy pixels from each quadrant. If the there are fewer than three noisy pixels in the level2.evt file, extra rows are filled as -1
| Pixel properties | Quadrant properties | ||||||
|---|---|---|---|---|---|---|---|
| Quadrant | DetID | PixID | Counts | Sigma | Mean | Median | Sigma |
| A | 8 | 205 | 19379 | 107.19 | 874 | 860 | 172.8 |
| A | 13 | 254 | 10619 | 56.49 | 874 | 860 | 172.8 |
| A | 0 | 226 | 7455 | 38.17 | 874 | 860 | 172.8 |
| B | 0 | 229 | 79546 | 482.52 | 868 | 848 | 163.1 |
| B | 3 | 64 | 65153 | 394.28 | 868 | 848 | 163.1 |
| B | 12 | 111 | 18897 | 110.66 | 868 | 848 | 163.1 |
| C | 14 | 238 | 138107 | 696.48 | 851 | 860 | 197.1 |
| C | 9 | 54 | 45402 | 226.03 | 851 | 860 | 197.1 |
| C | 7 | 247 | 35341 | 174.98 | 851 | 860 | 197.1 |
| D | 1 | 52 | 835199 | 4135.37 | 843 | 821 | 201.8 |
| D | 8 | 195 | 392299 | 1940.25 | 843 | 821 | 201.8 |
| D | 2 | 244 | 121783 | 599.52 | 843 | 821 | 201.8 |
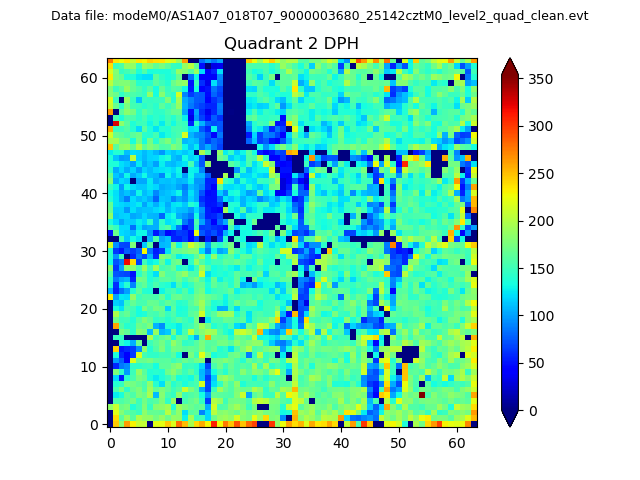
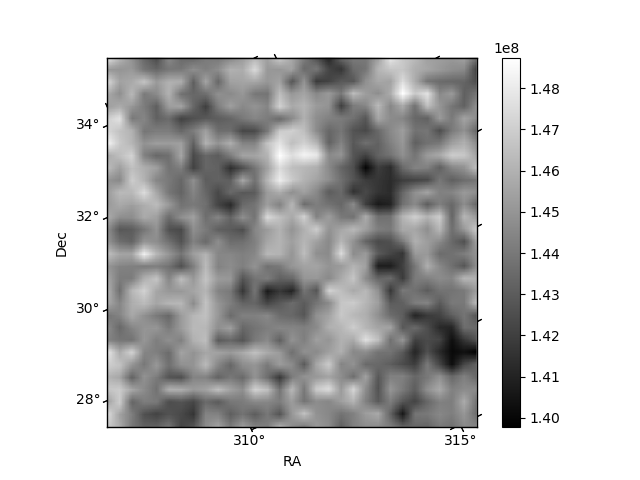
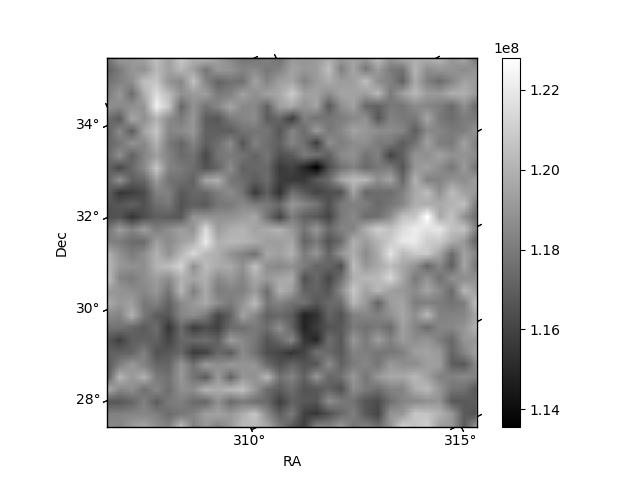
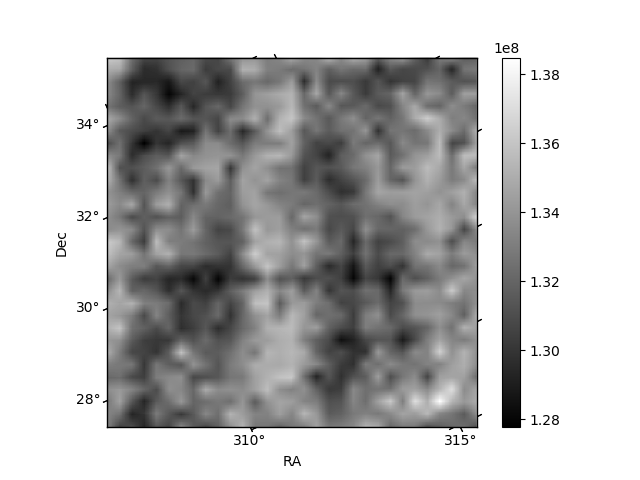
Histogram calculated using DETX and DETY for each event in the final _common_clean file
| Quadrant A | 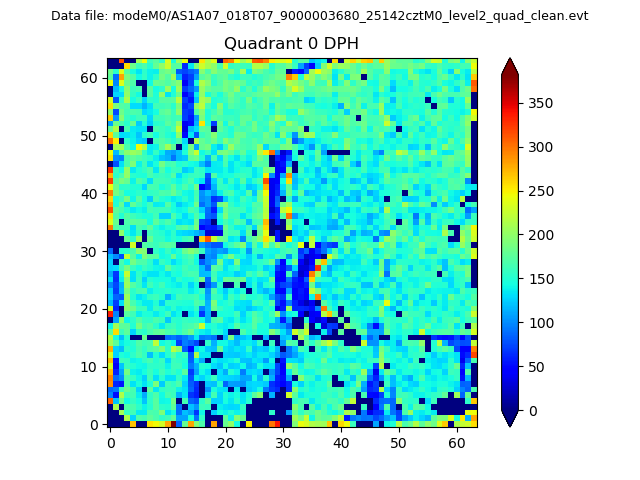 |
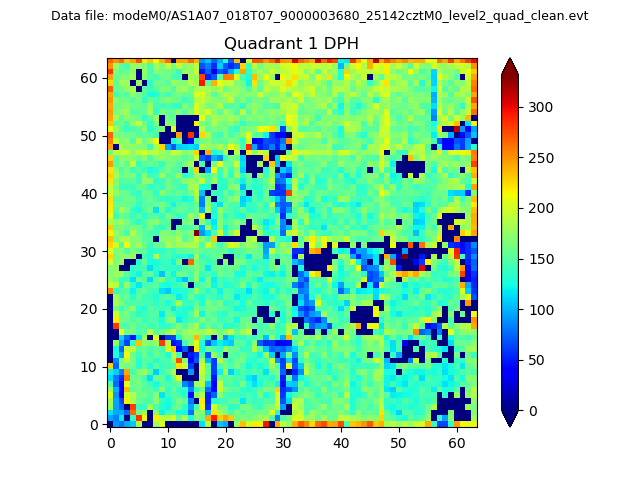 |
Quadrant B |
|---|---|---|---|
| Quadrant D | 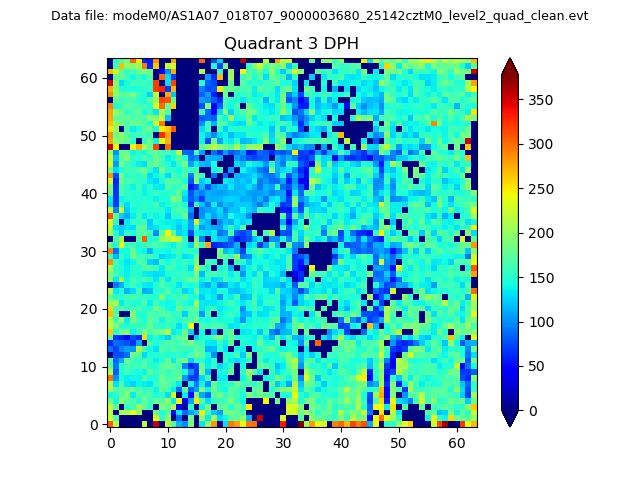 |
 |
Quadrant C |
| Plot type | Count rate plots | Images |
|---|---|---|
| Comparison with Poisson distribution Blue bars denote a histogram of data divided into 1 sec bins. Red curve is a Poisson curve with rate = median count rate of data. |
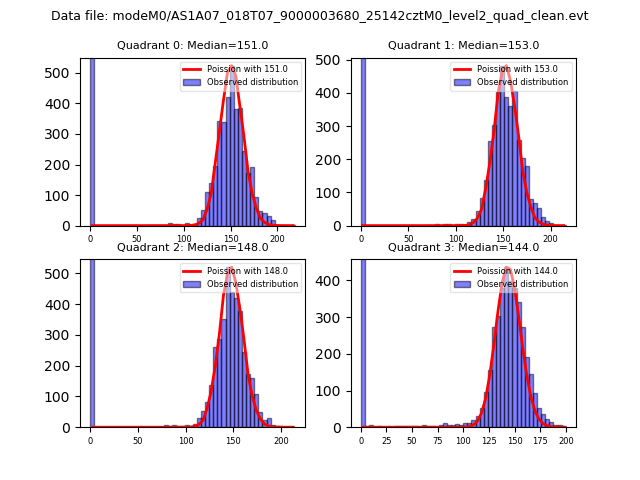 |
 |
| Quadrant-wise count rates Data is divided into 100 sec bins |
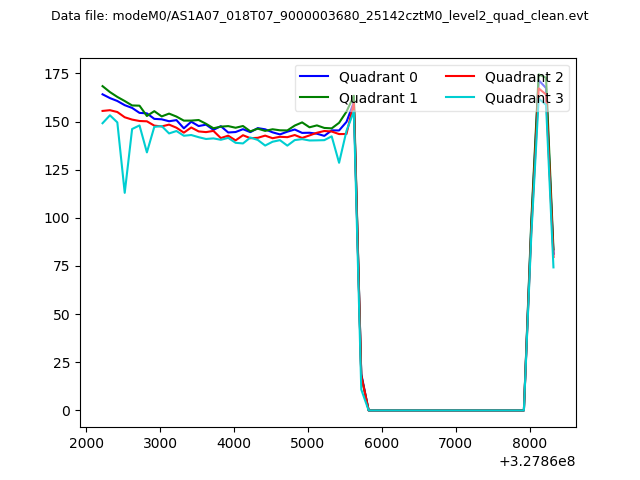 |
|
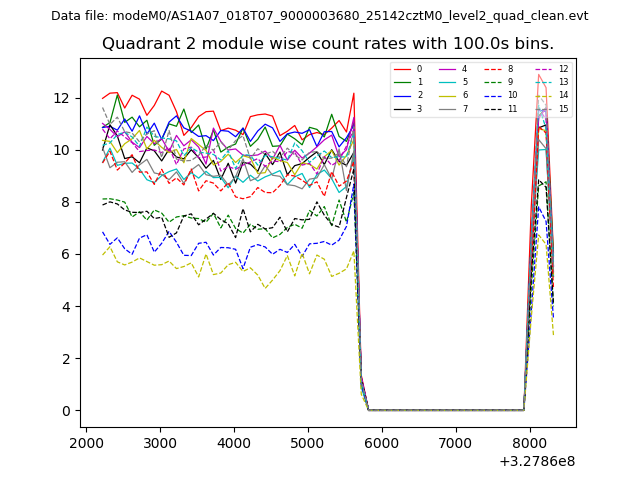
| Module-wise count rates for Quadrant A Data is divided into 100 sec bins |
 |
 |
| Module-wise count rates for Quadrant B Data is divided into 100 sec bins |
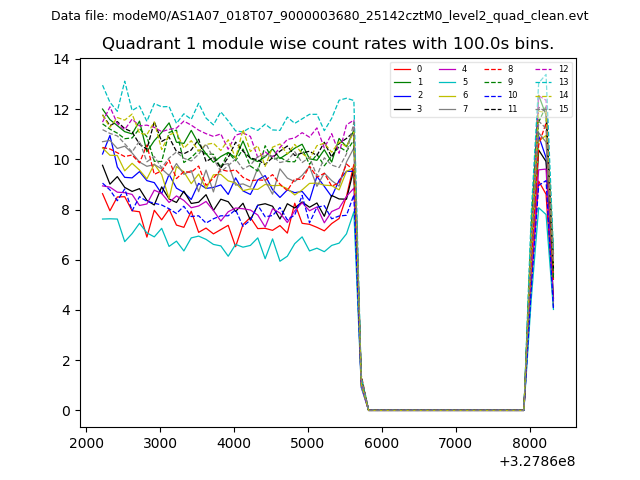 |
 |
| Module-wise count rates for Quadrant C Data is divided into 100 sec bins |
 |
 |
| Module-wise count rates for Quadrant D Data is divided into 100 sec bins |
 |
 |
| Parameter | Plot |
|---|---|
| CZT HV Monitor | 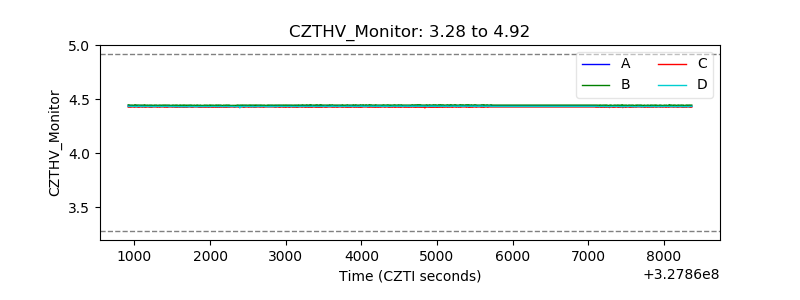 |
| D_VDD | 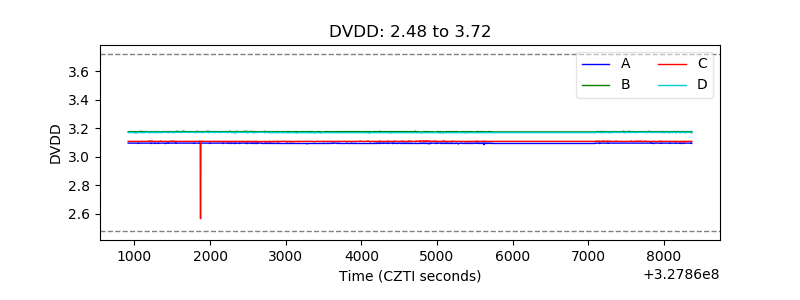 |
| Temperature 1 | 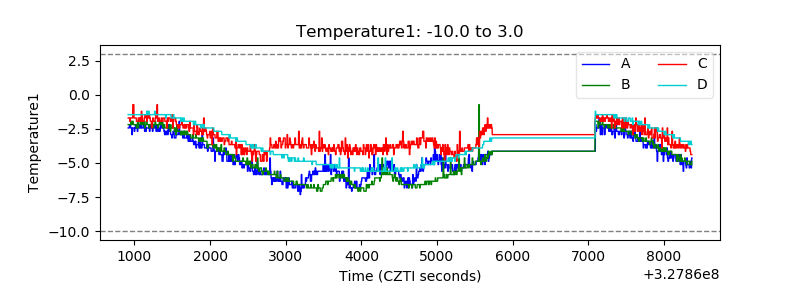 |
| Veto HV Monitor | 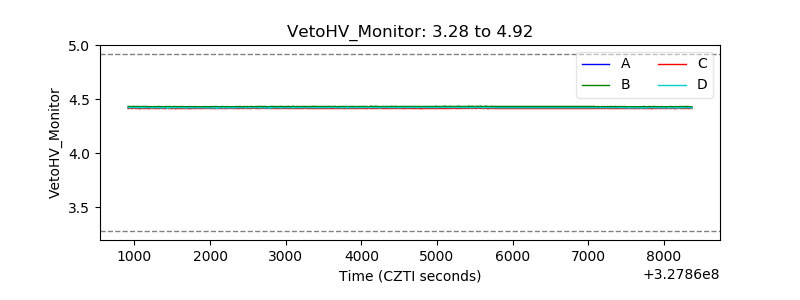 |
| Veto LLD | 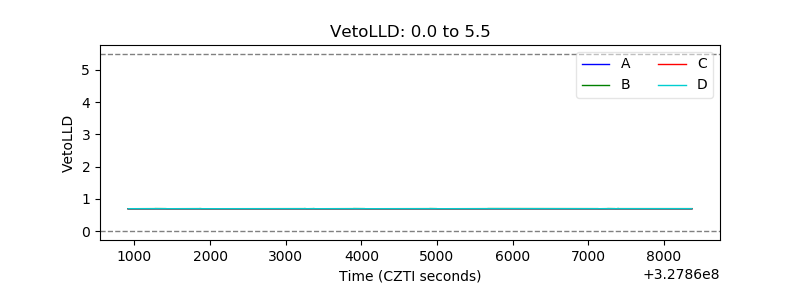 |
| Alpha Counter | 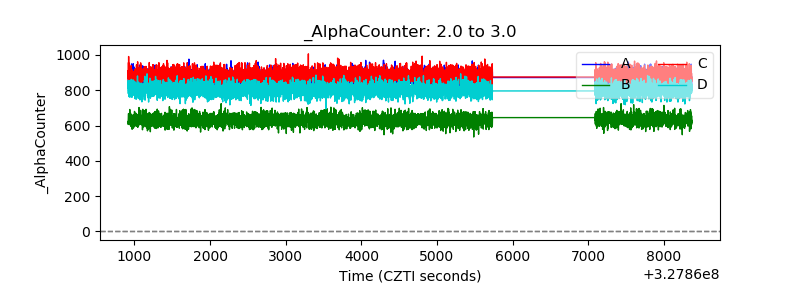 |
| _CPM_Rate | 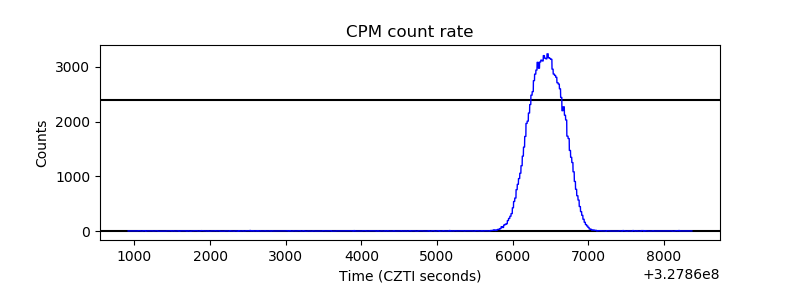 |
| CZT Counter |  |
| +2.5 Volts monitor |  |
| +5 Volts monitor |  |
| _ROLL_ROT | 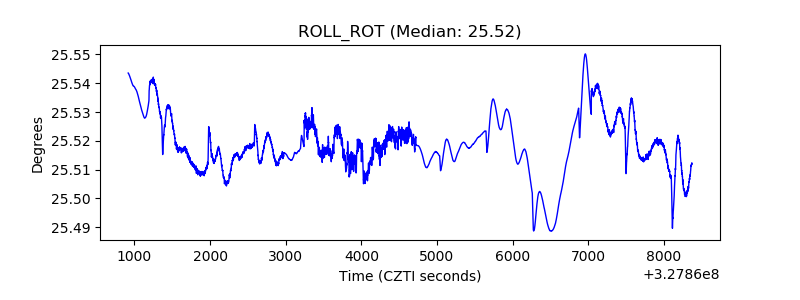 |
| _Roll_DEC |  |
| _Roll_RA |  |
| Veto Counter |  |