| Param | Original file | Final file |
|---|---|---|
| Filename | modeM0/AS1A07_018T07_9000003680_25143cztM0_level2.evt | modeM0/AS1A07_018T07_9000003680_25143cztM0_level2_quad_clean.evt |
| Size (bytes) | 487,434,240 | 99,213,120 |
| Size | 464.9 MB | 94.6 MB |
| Events in quadrant A | 3,332,774 | 647,669 |
| Events in quadrant B | 3,490,648 | 664,172 |
| Events in quadrant C | 3,450,043 | 643,905 |
| Events in quadrant D | 4,075,587 | 623,821 |
| Mode M0 | |||
|---|---|---|---|
| Quadrant | BADHDUFLAG | Total packets | Discarded packets |
| A | 0 | 13790 | 0 |
| B | 0 | 14355 | 0 |
| C | 0 | 14299 | 0 |
| D | 0 | 16447 | 0 |
| Mode M9 | |||
|---|---|---|---|
| Quadrant | BADHDUFLAG | Total packets | Discarded packets |
| A | 0 | 14 | 0 |
| B | 0 | 14 | 0 |
| C | 0 | 14 | 0 |
| D | 0 | 14 | 0 |
| Quadrant | Total seconds | Saturated seconds | Saturation percentage |
|---|---|---|---|
| A | 6094 | 33 | 0.541516% |
| B | 6095 | 73 | 1.197703% |
| C | 6095 | 122 | 2.001641% |
| D | 6094 | 81 | 1.329176% |
Noise dominated data is calculated using 1-second bins in cleaned event files. If a bin has >2000 counts, and if more than 50% of those come from <1% of pixels, then it is considered to be noise-dominated and hence unusable.
| Quadrant | # 1 sec bins | Bins with >0 counts | Bins with >2000 counts | High rate bins dominated by noise | Noise dominated (total time) | Noise dominated (detector-on time) | Marked lightcurve |
|---|---|---|---|---|---|---|---|
| A | 7464 | 6095 | 0 | 0 | 0.00% | 0.00% | 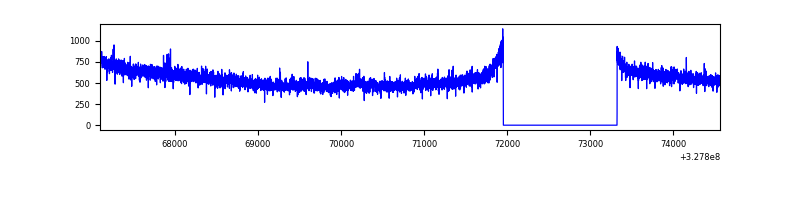 |
| B | 7465 | 6096 | 11 | 11 | 0.15% | 0.18% | 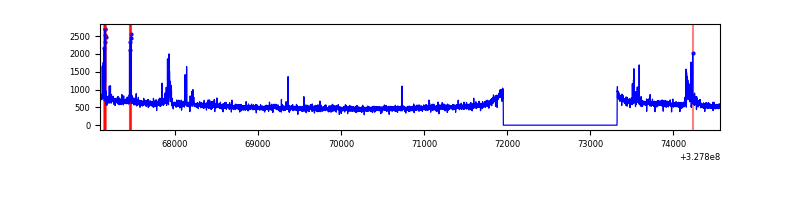 |
| C | 7465 | 6096 | 3 | 3 | 0.04% | 0.05% | 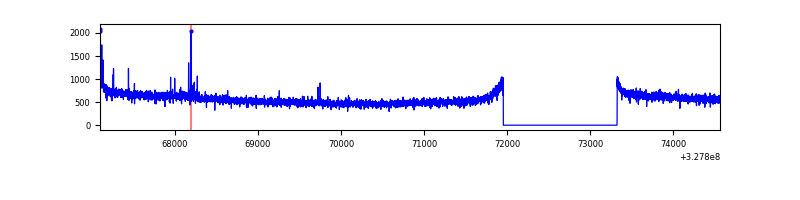 |
| D | 7464 | 6095 | 44 | 44 | 0.59% | 0.72% | 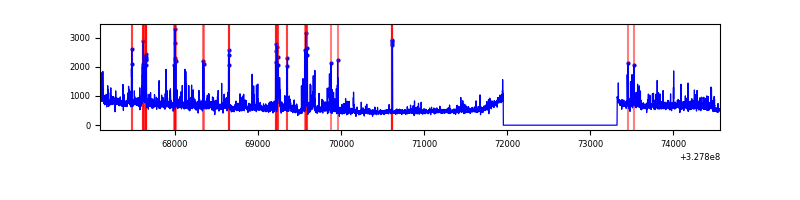 |
Top three noisy pixels from each quadrant. If the there are fewer than three noisy pixels in the level2.evt file, extra rows are filled as -1
| Pixel properties | Quadrant properties | ||||||
|---|---|---|---|---|---|---|---|
| Quadrant | DetID | PixID | Counts | Sigma | Mean | Median | Sigma |
| A | 8 | 205 | 47678 | 276.21 | 852 | 837 | 169.6 |
| A | 13 | 254 | 10592 | 57.52 | 852 | 837 | 169.6 |
| A | 3 | 137 | 7129 | 37.1 | 852 | 837 | 169.6 |
| B | 0 | 229 | 98016 | 614.99 | 852 | 834 | 158.0 |
| B | 3 | 64 | 49315 | 306.8 | 852 | 834 | 158.0 |
| B | 12 | 111 | 18573 | 112.26 | 852 | 834 | 158.0 |
| C | 14 | 238 | 137006 | 702.1 | 838 | 847 | 193.9 |
| C | 2 | 16 | 16000 | 78.14 | 838 | 847 | 193.9 |
| C | 0 | 239 | 15336 | 74.71 | 838 | 847 | 193.9 |
| D | 1 | 52 | 491175 | 2415.81 | 843 | 820 | 203.0 |
| D | 8 | 195 | 229816 | 1128.19 | 843 | 820 | 203.0 |
| D | 12 | 235 | 143178 | 701.35 | 843 | 820 | 203.0 |
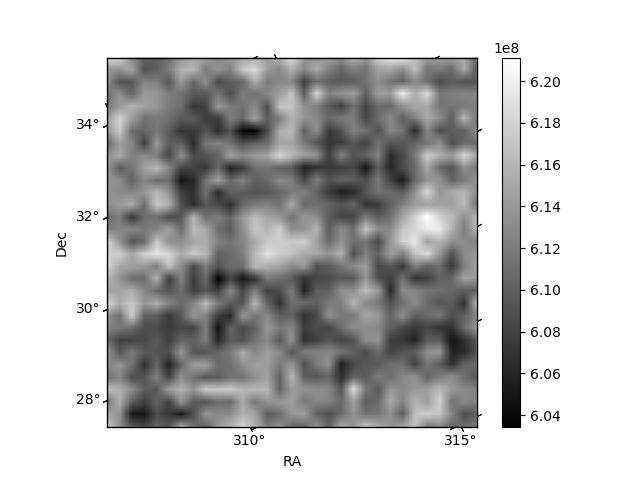
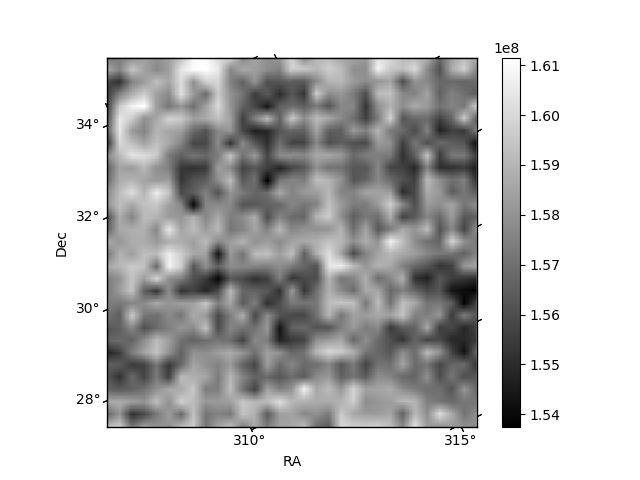
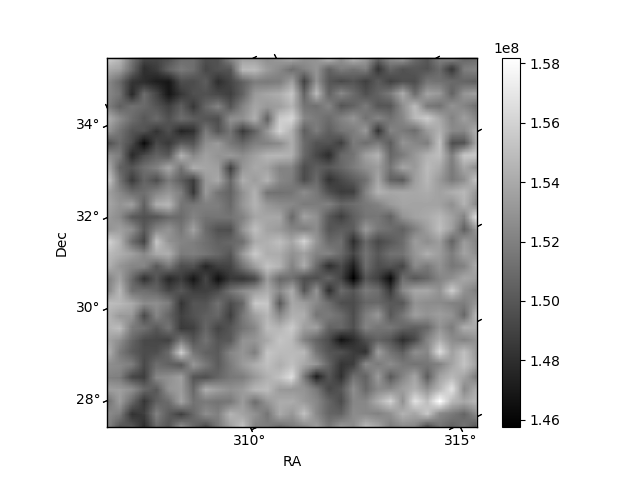
Histogram calculated using DETX and DETY for each event in the final _common_clean file
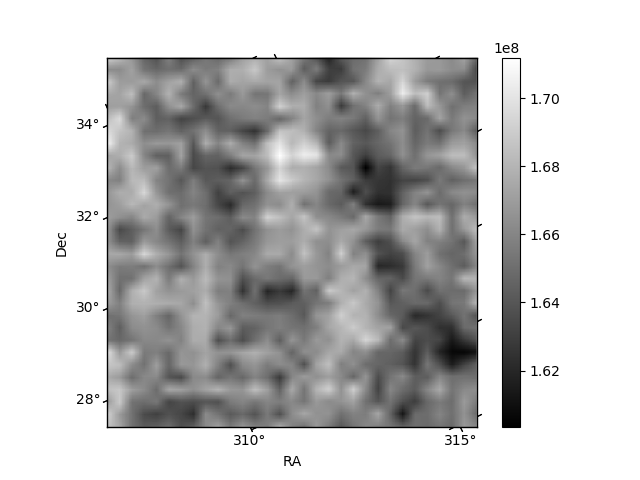
| Quadrant A | 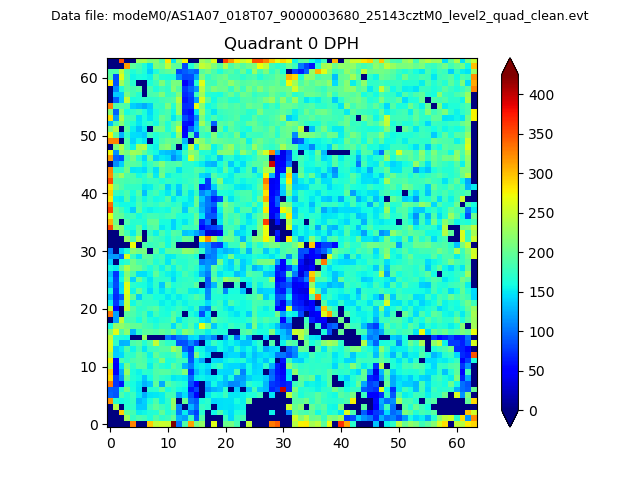 |
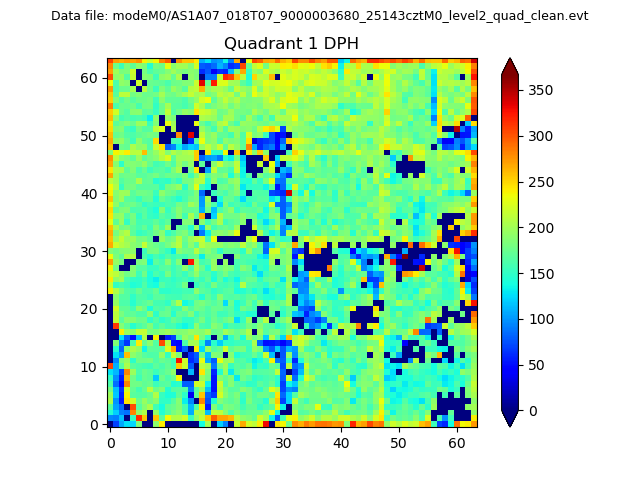 |
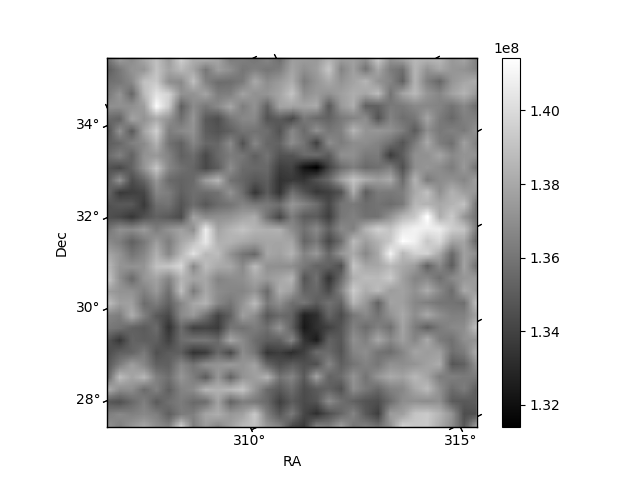
Quadrant B |
|---|---|---|---|
| Quadrant D | 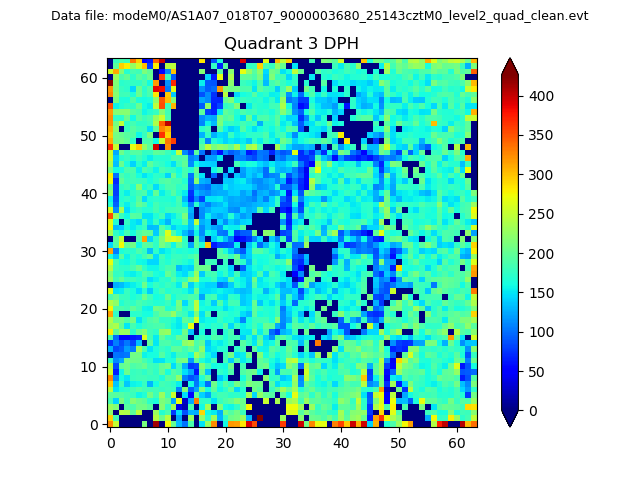 |
 |
Quadrant C |
| Plot type | Count rate plots | Images |
|---|---|---|
| Comparison with Poisson distribution Blue bars denote a histogram of data divided into 1 sec bins. Red curve is a Poisson curve with rate = median count rate of data. |
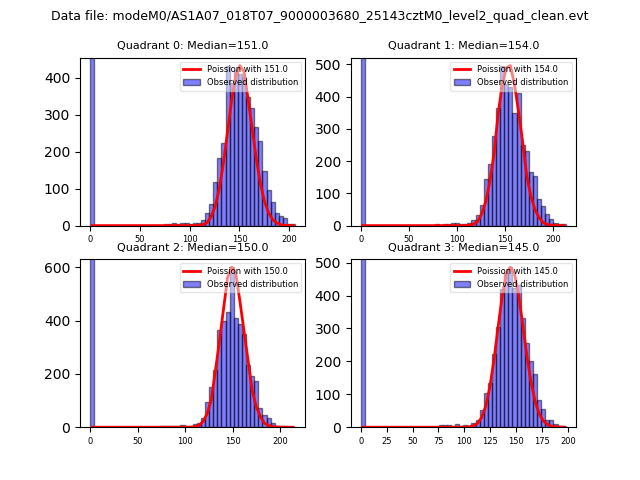 |
 |
| Quadrant-wise count rates Data is divided into 100 sec bins |
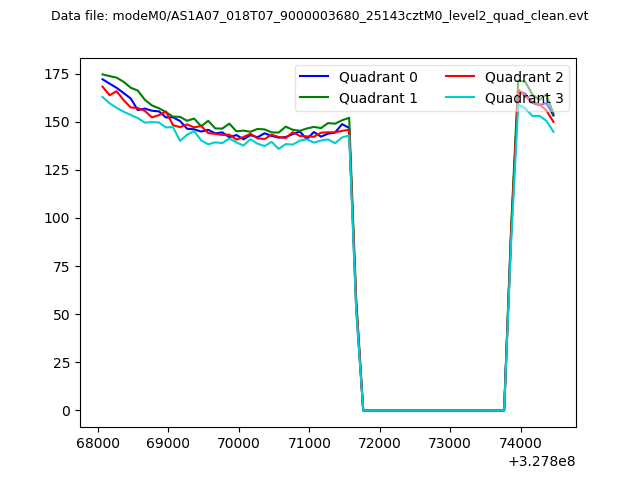 |
|
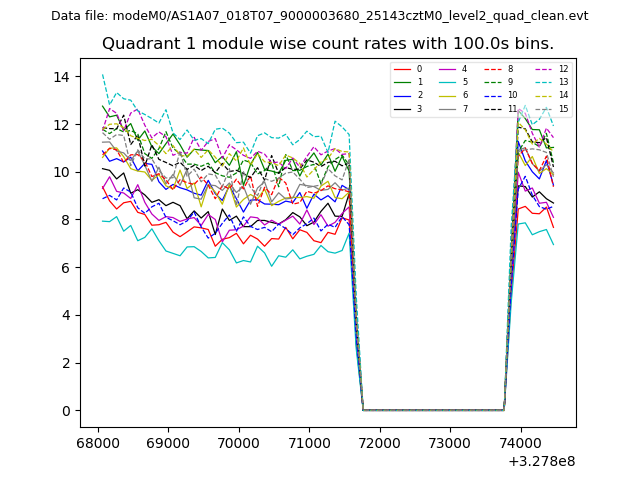
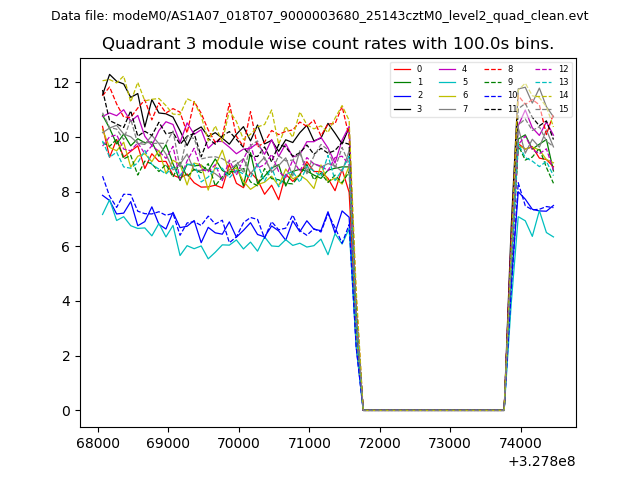
| Module-wise count rates for Quadrant A Data is divided into 100 sec bins |
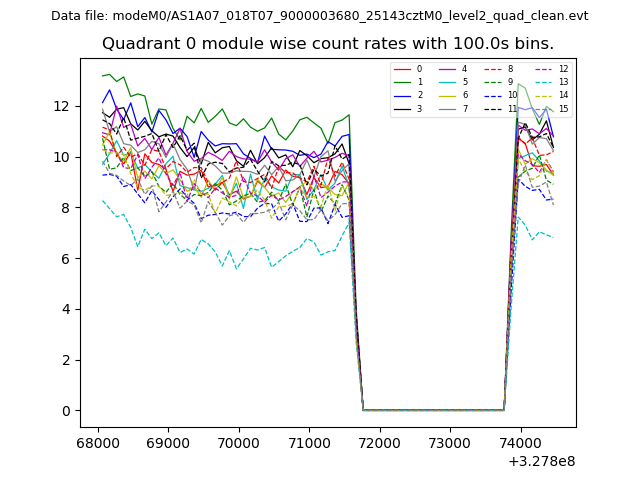 |
 |
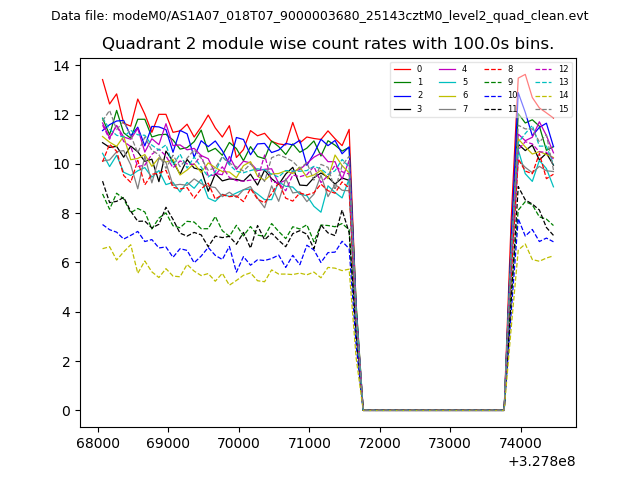
| Module-wise count rates for Quadrant B Data is divided into 100 sec bins |
 |
 |
| Module-wise count rates for Quadrant C Data is divided into 100 sec bins |
 |
 |
| Module-wise count rates for Quadrant D Data is divided into 100 sec bins |
 |
 |
| Parameter | Plot |
|---|---|
| CZT HV Monitor | 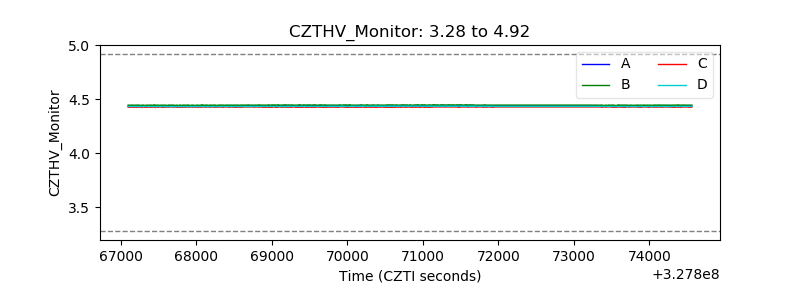 |
| D_VDD | 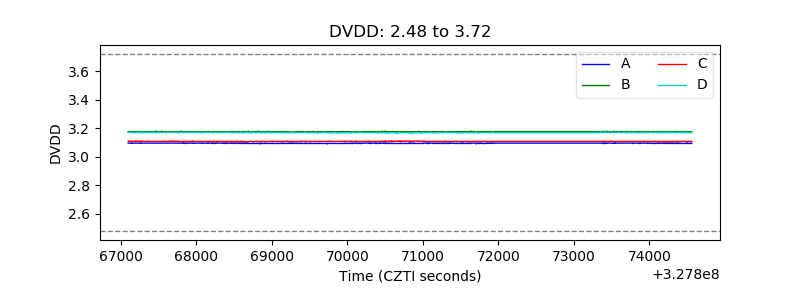 |
| Temperature 1 | 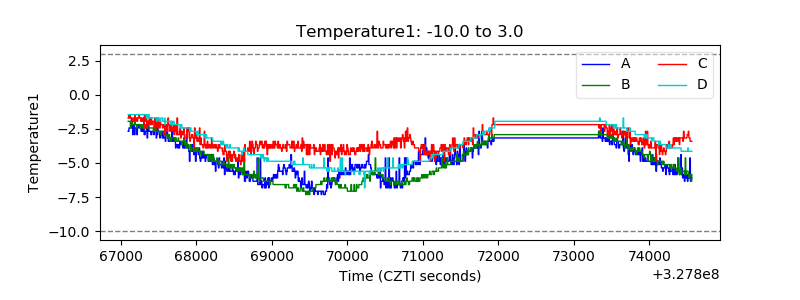 |
| Veto HV Monitor | 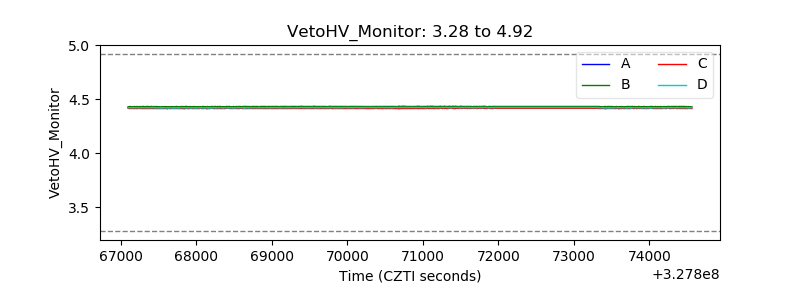 |
| Veto LLD | 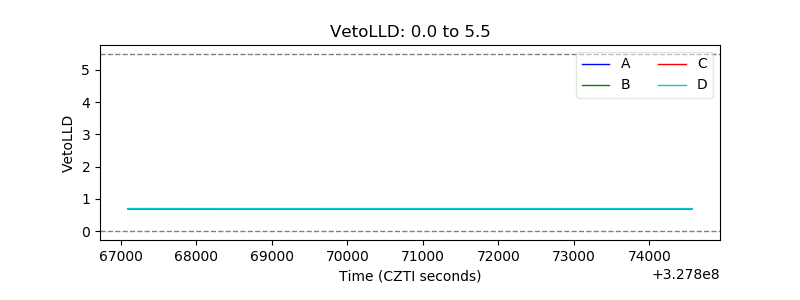 |
| Alpha Counter | 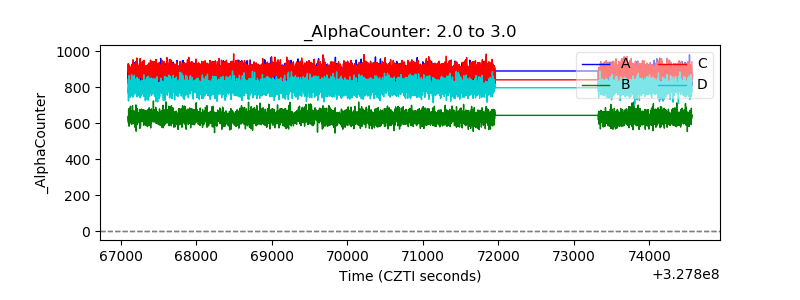 |
| _CPM_Rate | 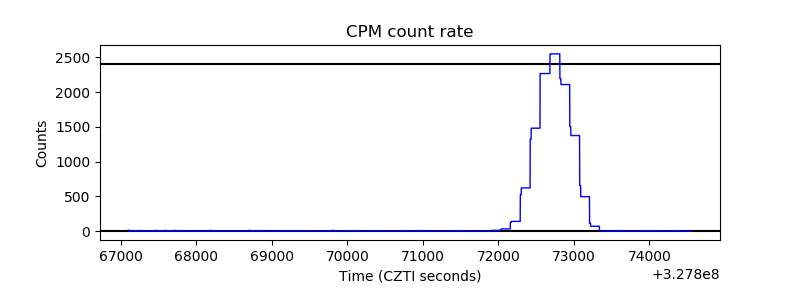 |
| CZT Counter | 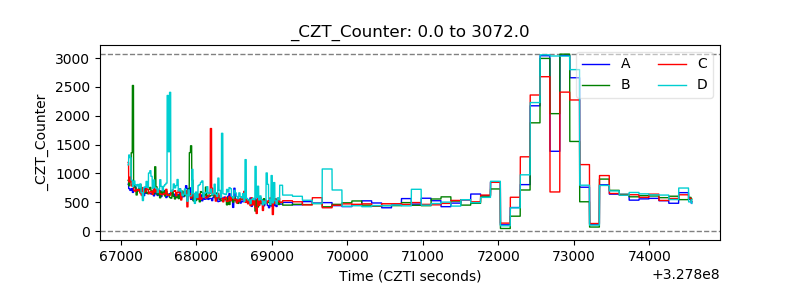 |
| +2.5 Volts monitor |  |
| +5 Volts monitor | 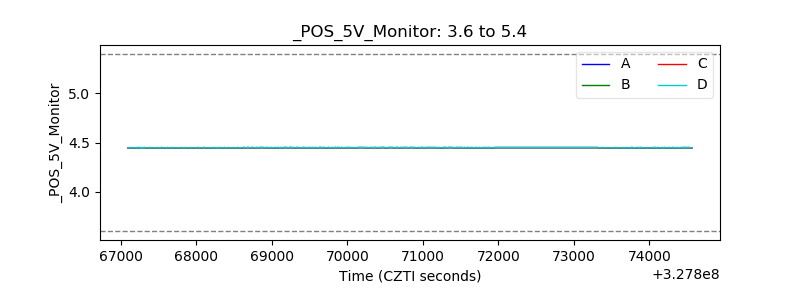 |
| _ROLL_ROT | 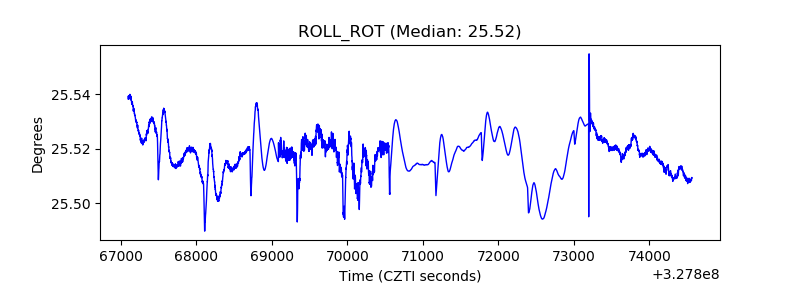 |
| _Roll_DEC | 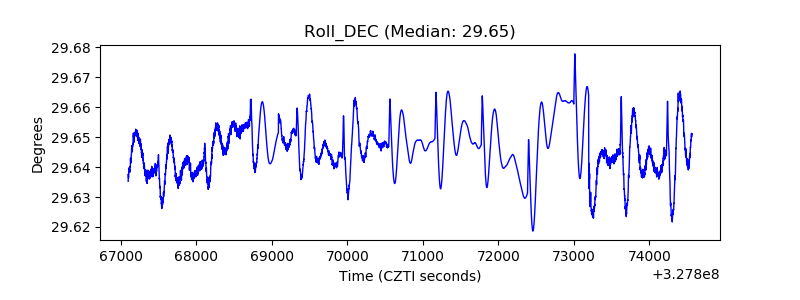 |
| _Roll_RA | 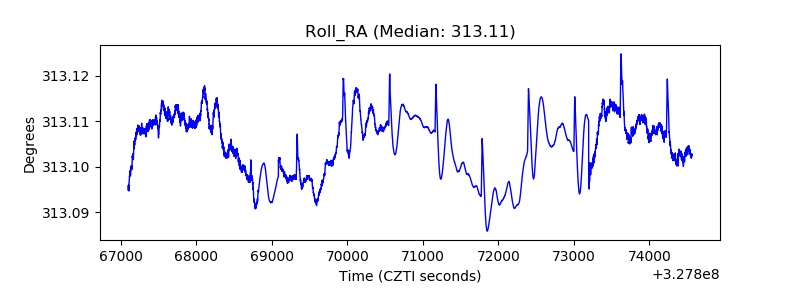 |
| Veto Counter | 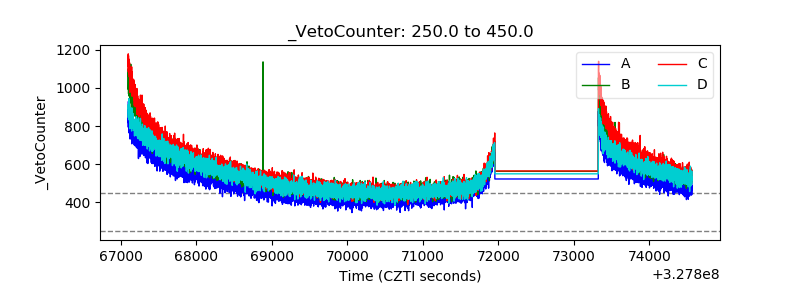 |