| Param | Original file | Final file |
|---|---|---|
| Filename | modeM0/AS1A07_018T07_9000003680_25145cztM0_level2.evt | modeM0/AS1A07_018T07_9000003680_25145cztM0_level2_quad_clean.evt |
| Size (bytes) | 476,032,320 | 104,912,640 |
| Size | 454.0 MB | 100.1 MB |
| Events in quadrant A | 3,230,986 | 685,864 |
| Events in quadrant B | 3,404,865 | 700,873 |
| Events in quadrant C | 3,570,065 | 673,731 |
| Events in quadrant D | 3,761,084 | 655,398 |
| Mode M0 | |||
|---|---|---|---|
| Quadrant | BADHDUFLAG | Total packets | Discarded packets |
| A | 0 | 13822 | 0 |
| B | 0 | 14327 | 0 |
| C | 0 | 14669 | 0 |
| D | 0 | 15454 | 0 |
| Mode M9 | |||
|---|---|---|---|
| Quadrant | BADHDUFLAG | Total packets | Discarded packets |
| A | 0 | 14 | 0 |
| B | 0 | 15 | 0 |
| C | 0 | 15 | 0 |
| D | 0 | 15 | 0 |
| Quadrant | Total seconds | Saturated seconds | Saturation percentage |
|---|---|---|---|
| A | 6622 | 40 | 0.604047% |
| B | 6622 | 81 | 1.223195% |
| C | 6622 | 129 | 1.948052% |
| D | 6622 | 116 | 1.751737% |
Noise dominated data is calculated using 1-second bins in cleaned event files. If a bin has >2000 counts, and if more than 50% of those come from <1% of pixels, then it is considered to be noise-dominated and hence unusable.
| Quadrant | # 1 sec bins | Bins with >0 counts | Bins with >2000 counts | High rate bins dominated by noise | Noise dominated (total time) | Noise dominated (detector-on time) | Marked lightcurve |
|---|---|---|---|---|---|---|---|
| A | 7573 | 6623 | 0 | 0 | 0.00% | 0.00% | 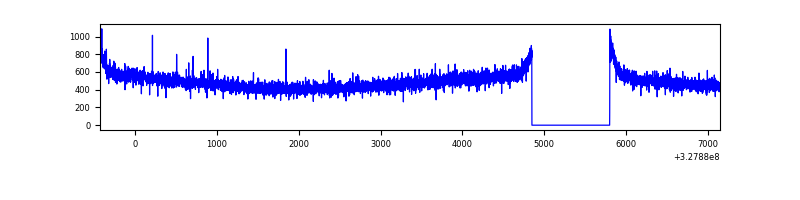 |
| B | 7573 | 6622 | 6 | 6 | 0.08% | 0.09% | 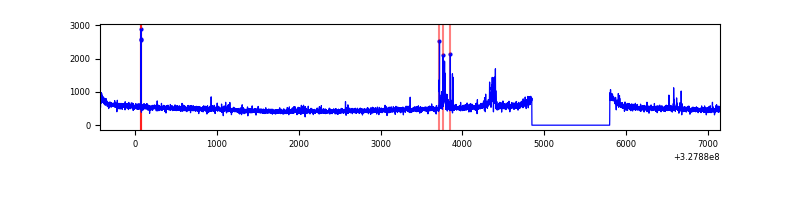 |
| C | 7573 | 6623 | 1 | 1 | 0.01% | 0.02% | 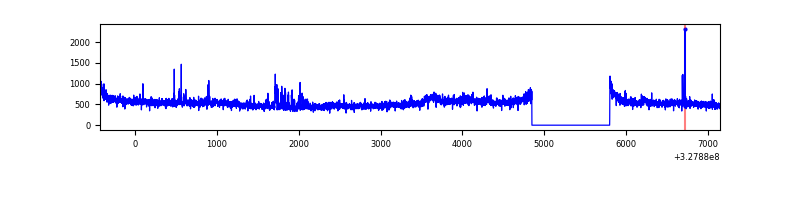 |
| D | 7573 | 6623 | 51 | 51 | 0.67% | 0.77% | 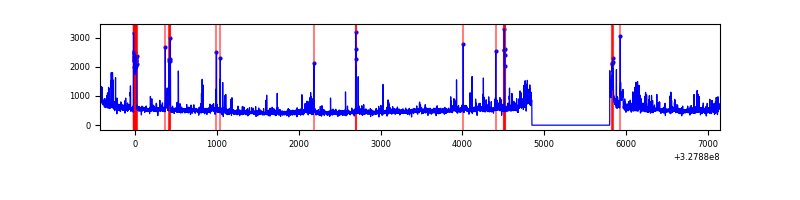 |
Top three noisy pixels from each quadrant. If the there are fewer than three noisy pixels in the level2.evt file, extra rows are filled as -1
| Pixel properties | Quadrant properties | ||||||
|---|---|---|---|---|---|---|---|
| Quadrant | DetID | PixID | Counts | Sigma | Mean | Median | Sigma |
| A | 13 | 254 | 10306 | 56.58 | 838 | 820 | 167.7 |
| A | 3 | 137 | 7782 | 41.52 | 838 | 820 | 167.7 |
| A | 0 | 226 | 7114 | 37.54 | 838 | 820 | 167.7 |
| B | 0 | 229 | 72443 | 445.75 | 840 | 818 | 160.7 |
| B | 3 | 64 | 33484 | 203.29 | 840 | 818 | 160.7 |
| B | 12 | 111 | 19437 | 115.87 | 840 | 818 | 160.7 |
| C | 7 | 247 | 222829 | 1152.19 | 816 | 822 | 192.7 |
| C | 14 | 238 | 131869 | 680.12 | 816 | 822 | 192.7 |
| C | 2 | 16 | 20274 | 100.95 | 816 | 822 | 192.7 |
| D | 1 | 52 | 215339 | 1080.86 | 819 | 795 | 198.5 |
| D | 2 | 244 | 150781 | 755.62 | 819 | 795 | 198.5 |
| D | 8 | 195 | 135488 | 678.57 | 819 | 795 | 198.5 |
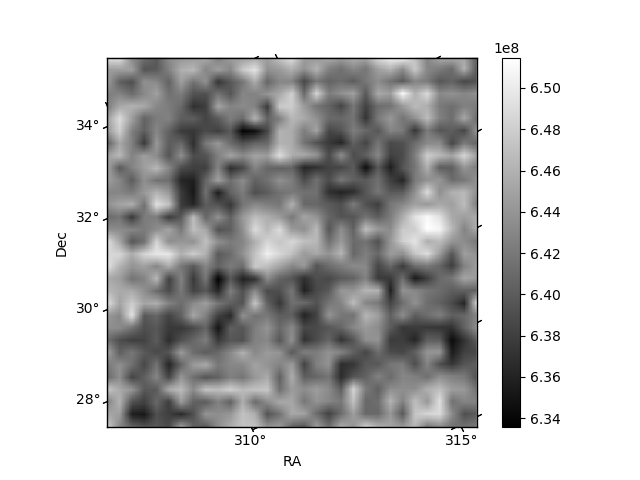
Histogram calculated using DETX and DETY for each event in the final _common_clean file
| Quadrant A | 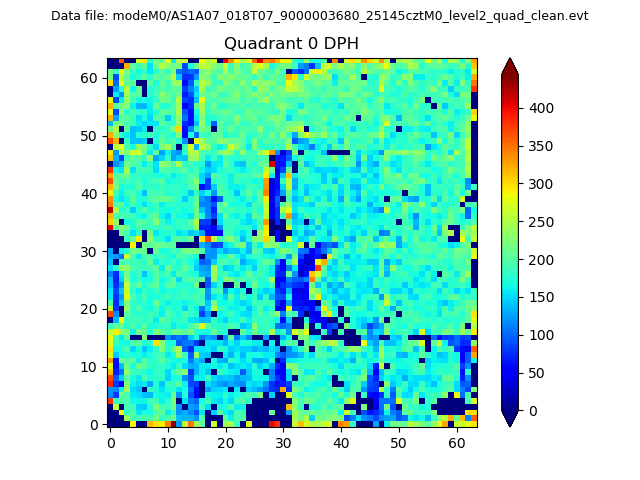 |
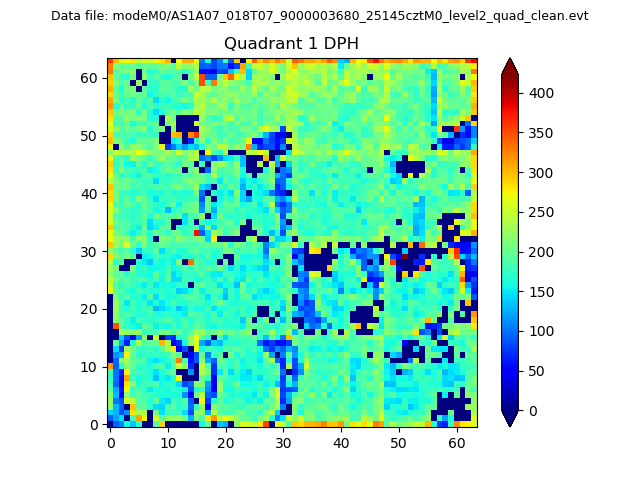 |
Quadrant B |
|---|---|---|---|
| Quadrant D | 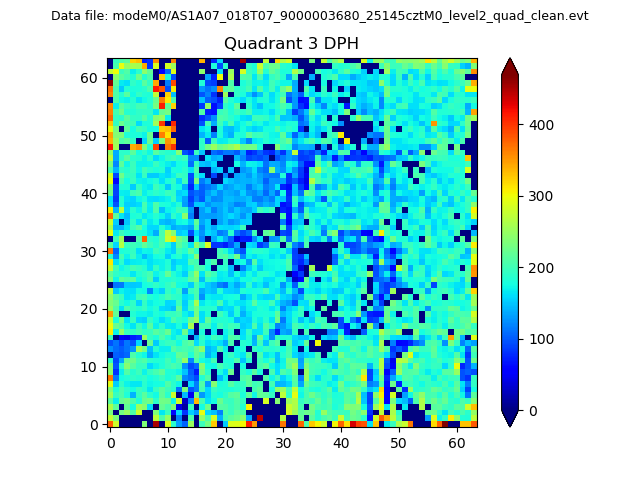 |
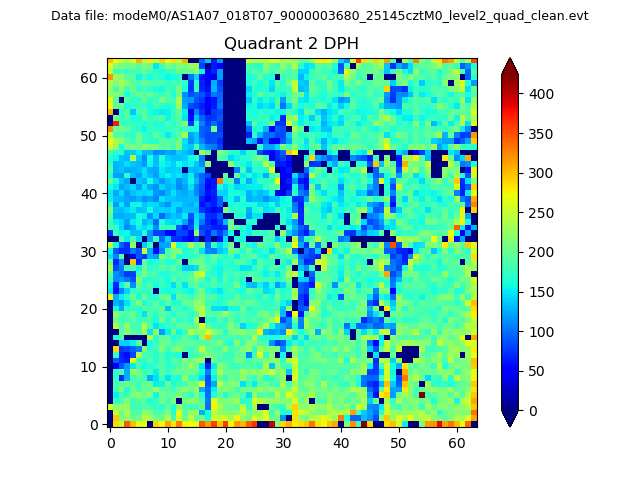 |
Quadrant C |
| Plot type | Count rate plots | Images |
|---|---|---|
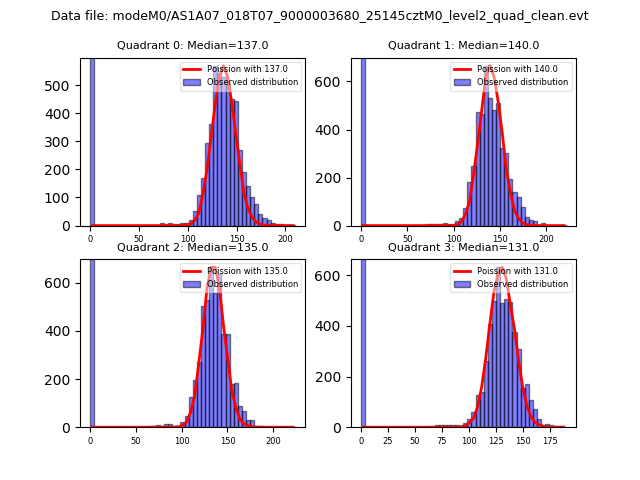
| Comparison with Poisson distribution Blue bars denote a histogram of data divided into 1 sec bins. Red curve is a Poisson curve with rate = median count rate of data. |
 |
 |
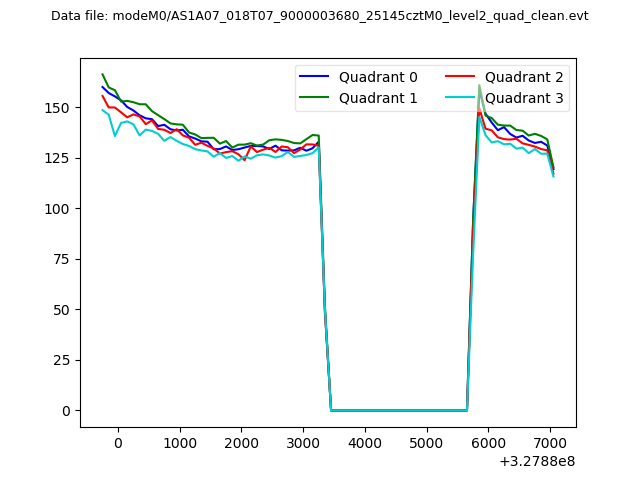
| Quadrant-wise count rates Data is divided into 100 sec bins |
 |
|
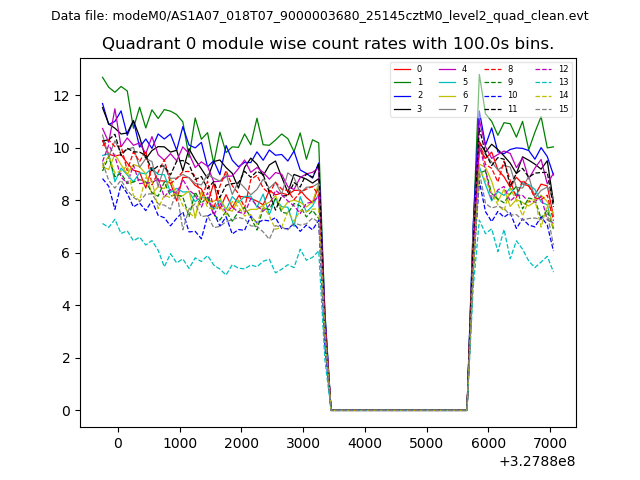
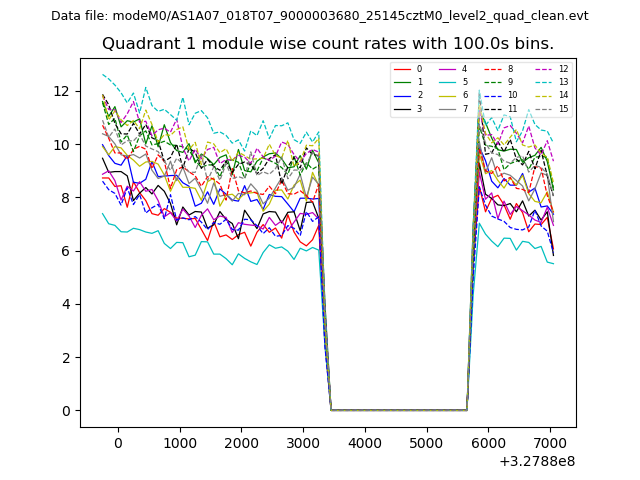
| Module-wise count rates for Quadrant A Data is divided into 100 sec bins |
 |
 |
| Module-wise count rates for Quadrant B Data is divided into 100 sec bins |
 |
 |
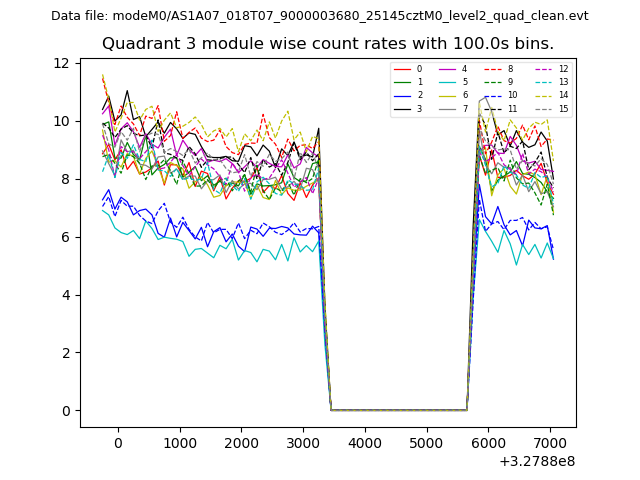
| Module-wise count rates for Quadrant C Data is divided into 100 sec bins |
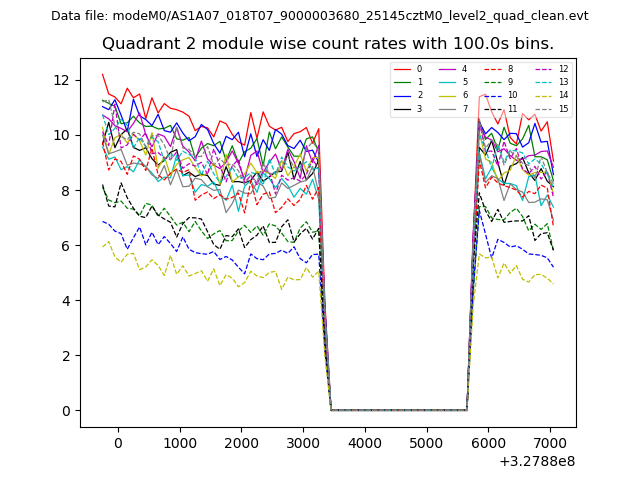 |
 |
| Module-wise count rates for Quadrant D Data is divided into 100 sec bins |
 |
 |
| Parameter | Plot |
|---|---|
| CZT HV Monitor | 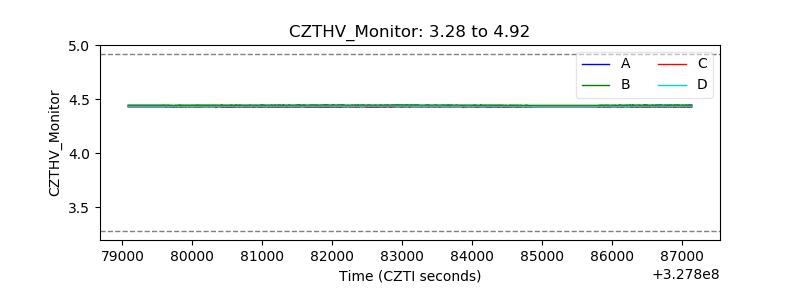 |
| D_VDD | 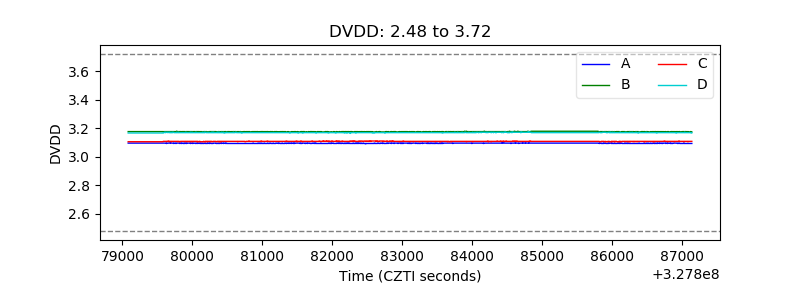 |
| Temperature 1 | 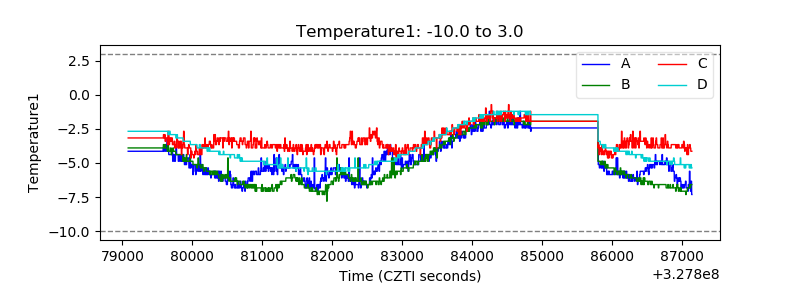 |
| Veto HV Monitor | 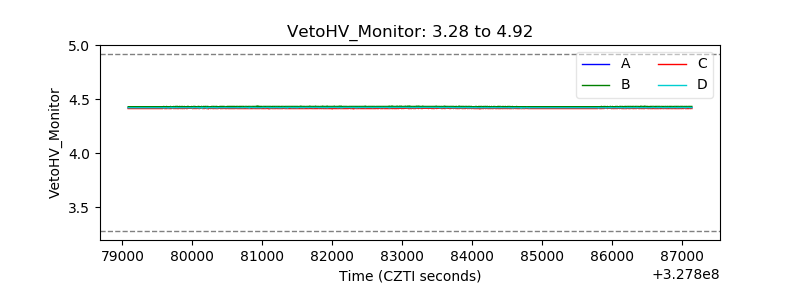 |
| Veto LLD | 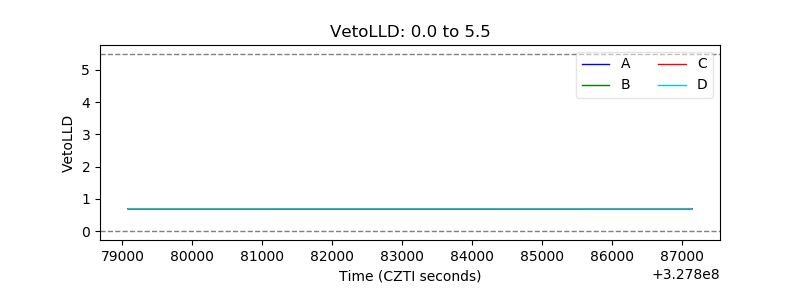 |
| Alpha Counter | 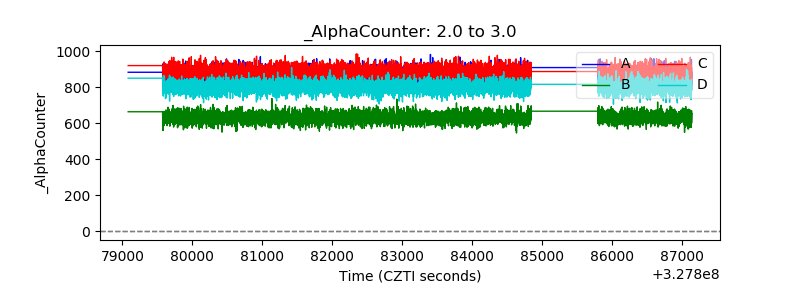 |
| _CPM_Rate | 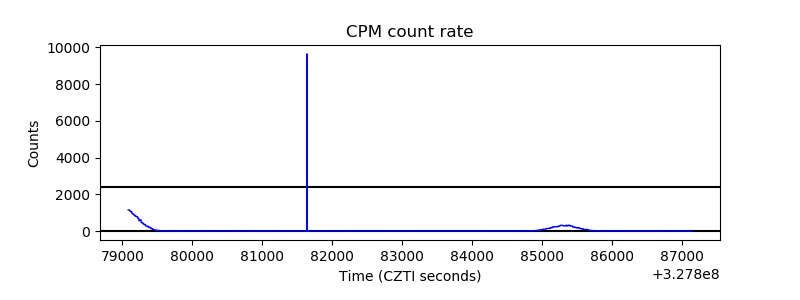 |
| CZT Counter | 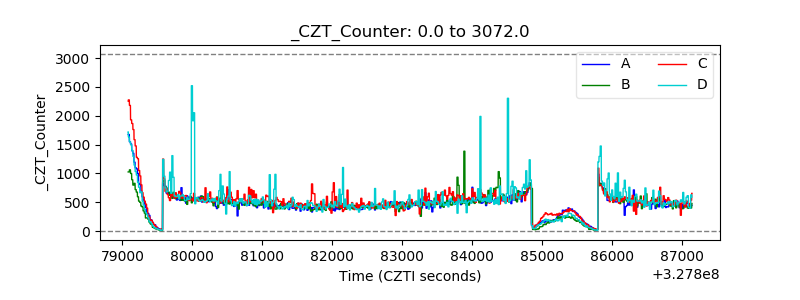 |
| +2.5 Volts monitor | 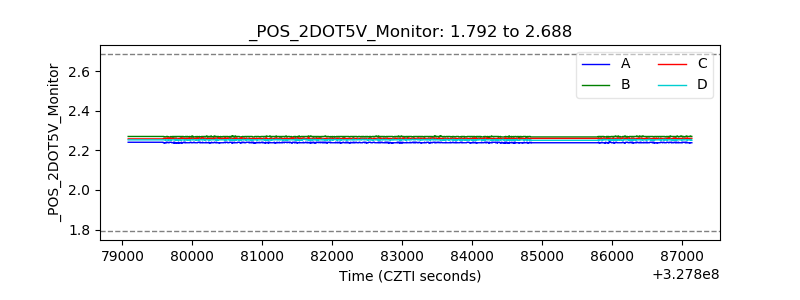 |
| +5 Volts monitor |  |
| _ROLL_ROT | 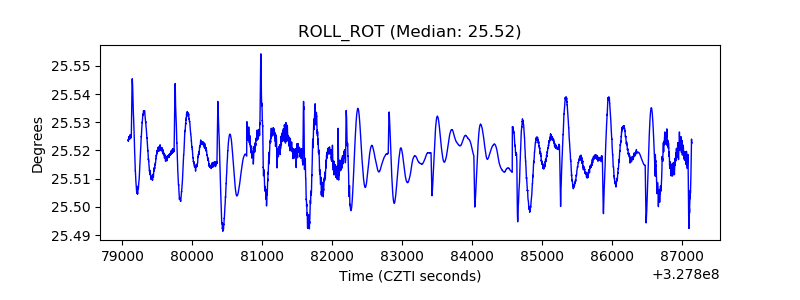 |
| _Roll_DEC | 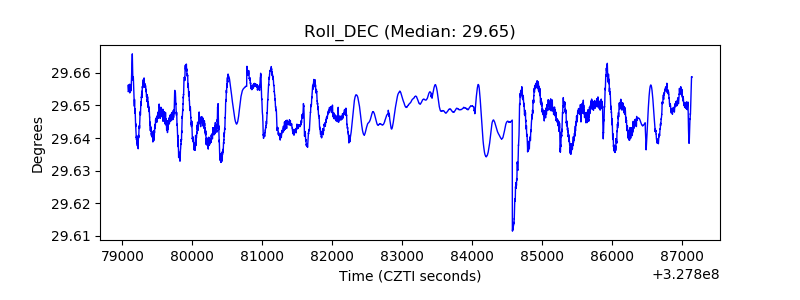 |
| _Roll_RA | 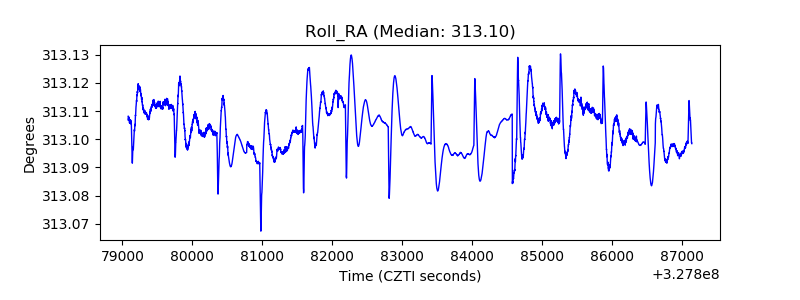 |
| Veto Counter |  |