| Param | Original file | Final file |
|---|---|---|
| Filename | modeM0/AS1A07_018T07_9000003680_25146cztM0_level2.evt | modeM0/AS1A07_018T07_9000003680_25146cztM0_level2_quad_clean.evt |
| Size (bytes) | 556,200,000 | 101,272,320 |
| Size | 530.4 MB | 96.6 MB |
| Events in quadrant A | 3,679,768 | 650,355 |
| Events in quadrant B | 3,558,073 | 661,224 |
| Events in quadrant C | 3,718,038 | 635,653 |
| Events in quadrant D | 5,398,885 | 617,325 |
| Mode M0 | |||
|---|---|---|---|
| Quadrant | BADHDUFLAG | Total packets | Discarded packets |
| A | 0 | 15727 | 0 |
| B | 0 | 15230 | 0 |
| C | 0 | 15644 | 0 |
| D | 0 | 21038 | 0 |
| Mode M9 | |||
|---|---|---|---|
| Quadrant | BADHDUFLAG | Total packets | Discarded packets |
| A | 0 | 16 | 0 |
| B | 0 | 16 | 0 |
| C | 0 | 16 | 0 |
| D | 0 | 16 | 0 |
| Quadrant | Total seconds | Saturated seconds | Saturation percentage |
|---|---|---|---|
| A | 7226 | 161 | 2.228065% |
| B | 7227 | 121 | 1.674277% |
| C | 7227 | 186 | 2.573682% |
| D | 7227 | 394 | 5.451778% |
Noise dominated data is calculated using 1-second bins in cleaned event files. If a bin has >2000 counts, and if more than 50% of those come from <1% of pixels, then it is considered to be noise-dominated and hence unusable.
| Quadrant | # 1 sec bins | Bins with >0 counts | Bins with >2000 counts | High rate bins dominated by noise | Noise dominated (total time) | Noise dominated (detector-on time) | Marked lightcurve |
|---|---|---|---|---|---|---|---|
| A | 8737 | 7227 | 83 | 83 | 0.95% | 1.15% | 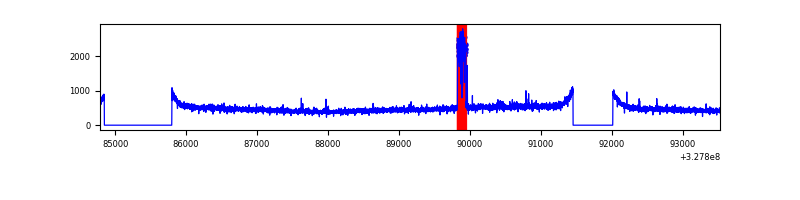 |
| B | 8738 | 7227 | 0 | 0 | 0.00% | 0.00% | 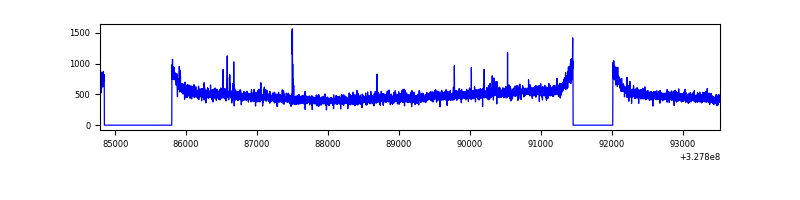 |
| C | 8738 | 7229 | 1 | 1 | 0.01% | 0.01% | 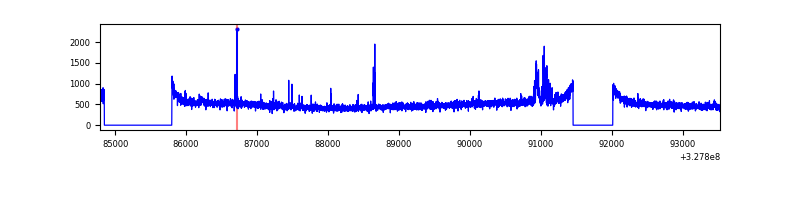 |
| D | 8738 | 7228 | 262 | 262 | 3.00% | 3.62% | 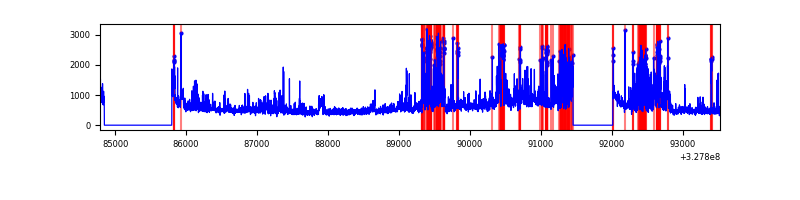 |
Top three noisy pixels from each quadrant. If the there are fewer than three noisy pixels in the level2.evt file, extra rows are filled as -1
| Pixel properties | Quadrant properties | ||||||
|---|---|---|---|---|---|---|---|
| Quadrant | DetID | PixID | Counts | Sigma | Mean | Median | Sigma |
| A | 15 | 174 | 213604 | 1172.89 | 897 | 879 | 181.4 |
| A | 13 | 254 | 10840 | 54.92 | 897 | 879 | 181.4 |
| A | 3 | 137 | 8314 | 40.99 | 897 | 879 | 181.4 |
| B | 12 | 111 | 21773 | 118.87 | 903 | 877 | 175.8 |
| B | 11 | 111 | 18998 | 103.08 | 903 | 877 | 175.8 |
| B | 3 | 64 | 18159 | 98.31 | 903 | 877 | 175.8 |
| C | 14 | 238 | 138991 | 668.34 | 872 | 879 | 206.6 |
| C | 7 | 247 | 76882 | 367.79 | 872 | 879 | 206.6 |
| C | 9 | 54 | 76139 | 364.19 | 872 | 879 | 206.6 |
| D | 1 | 52 | 1633291 | 7719.85 | 863 | 840 | 211.5 |
| D | 8 | 195 | 293396 | 1383.5 | 863 | 840 | 211.5 |
| D | 2 | 244 | 101912 | 477.97 | 863 | 840 | 211.5 |
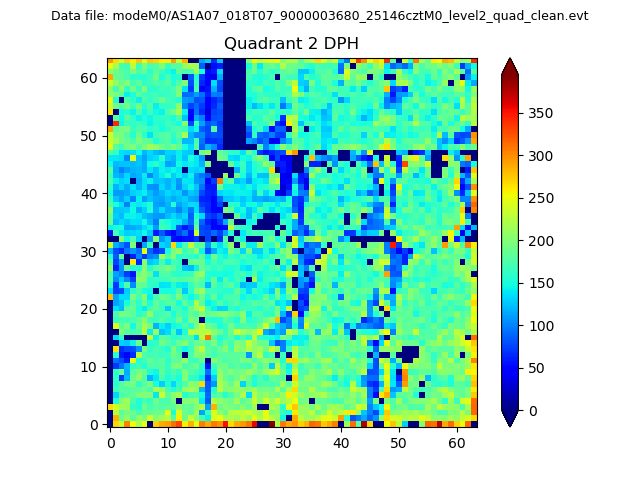
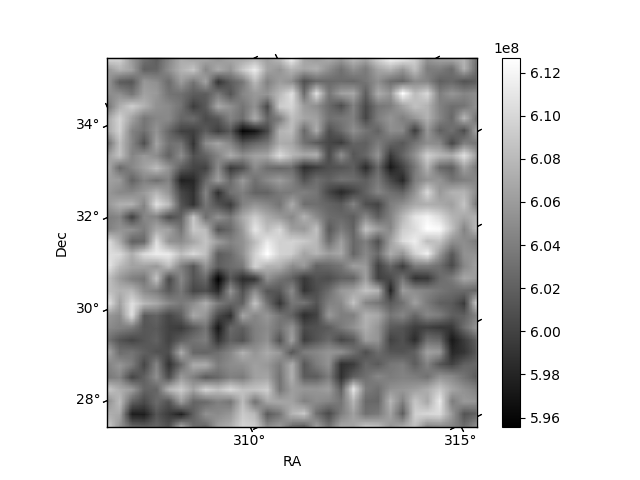
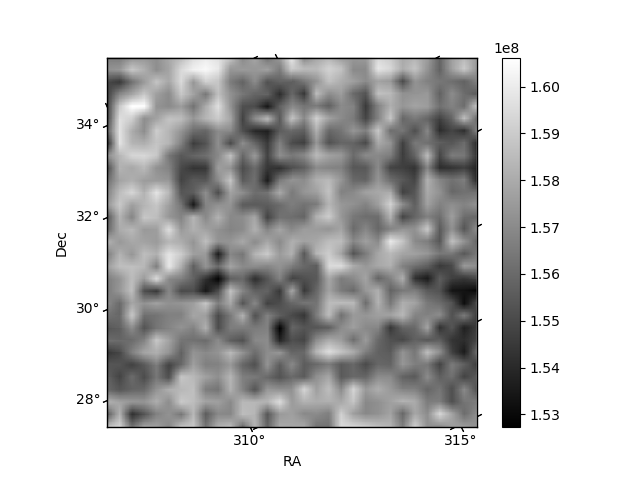
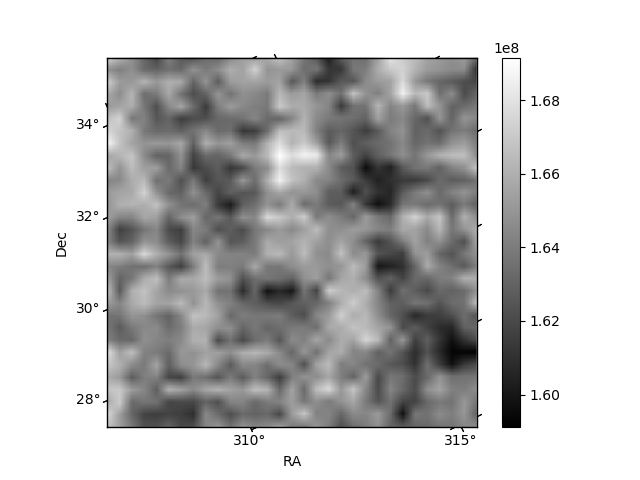
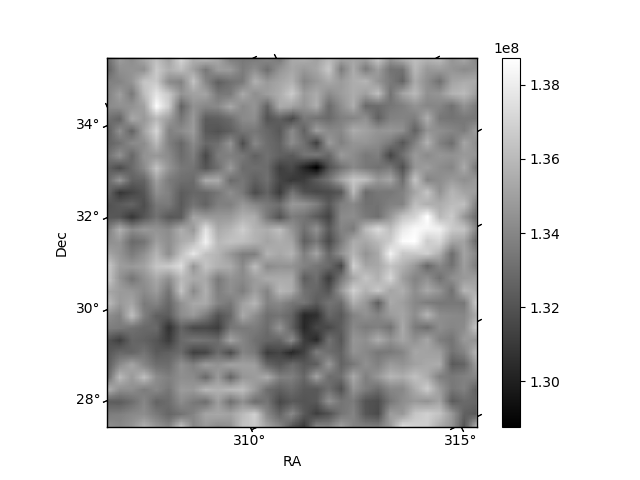
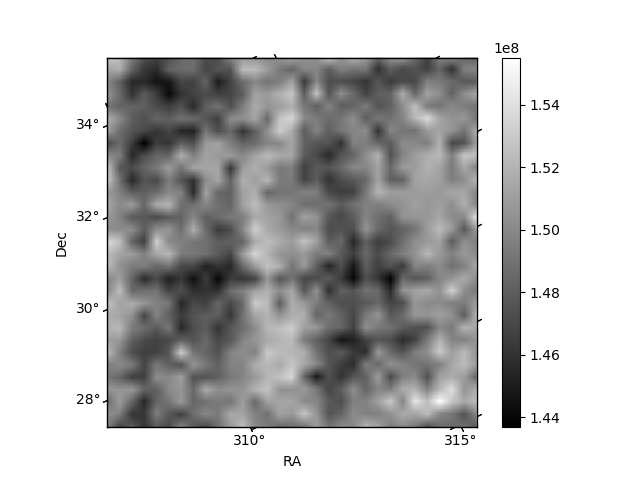
Histogram calculated using DETX and DETY for each event in the final _common_clean file
| Quadrant A | 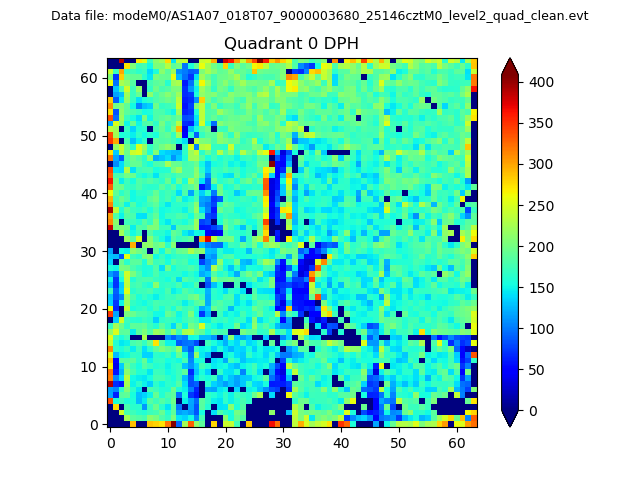 |
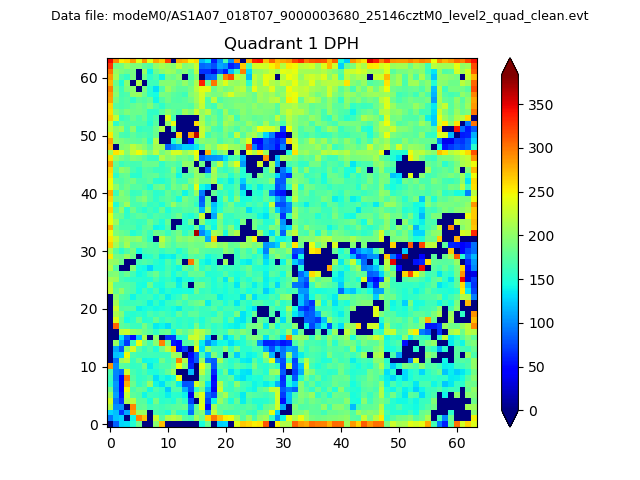 |
Quadrant B |
|---|---|---|---|
| Quadrant D | 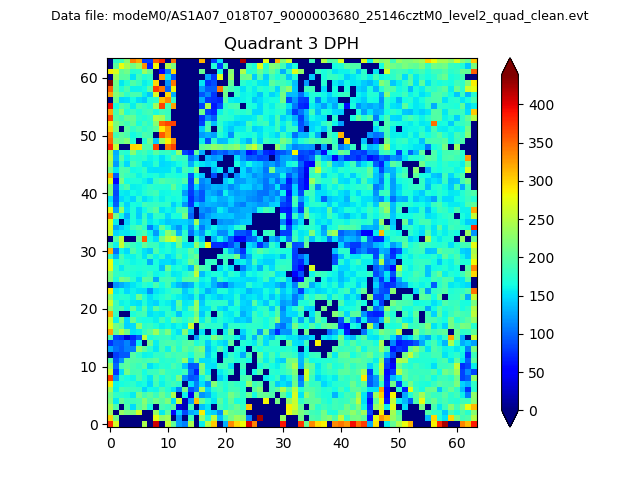 |
 |
Quadrant C |
| Plot type | Count rate plots | Images |
|---|---|---|
| Comparison with Poisson distribution Blue bars denote a histogram of data divided into 1 sec bins. Red curve is a Poisson curve with rate = median count rate of data. |
 |
 |
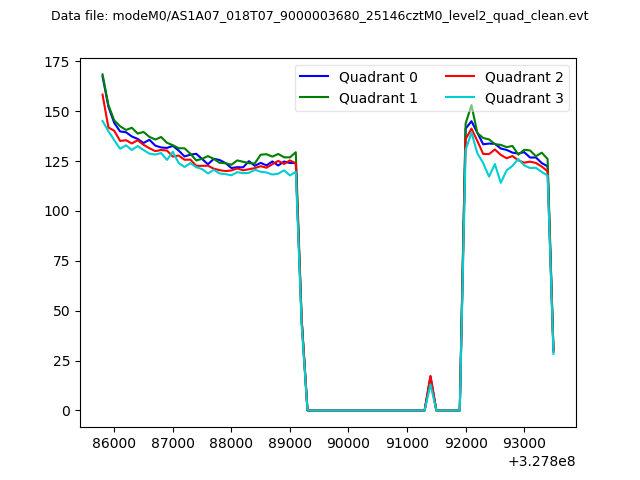
| Quadrant-wise count rates Data is divided into 100 sec bins |
 |
|
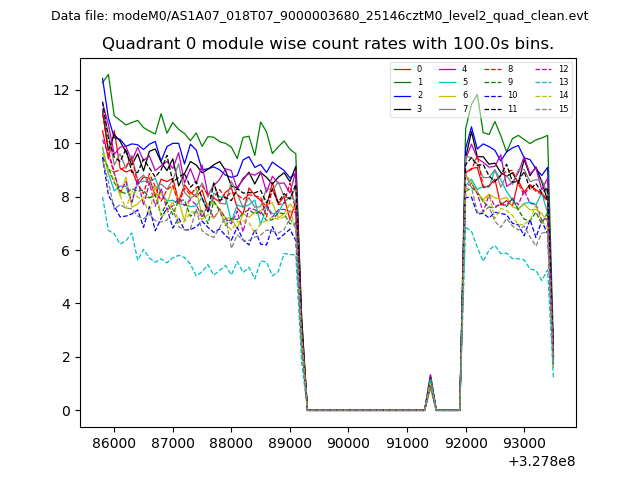
| Module-wise count rates for Quadrant A Data is divided into 100 sec bins |
 |
 |
| Module-wise count rates for Quadrant B Data is divided into 100 sec bins |
 |
 |
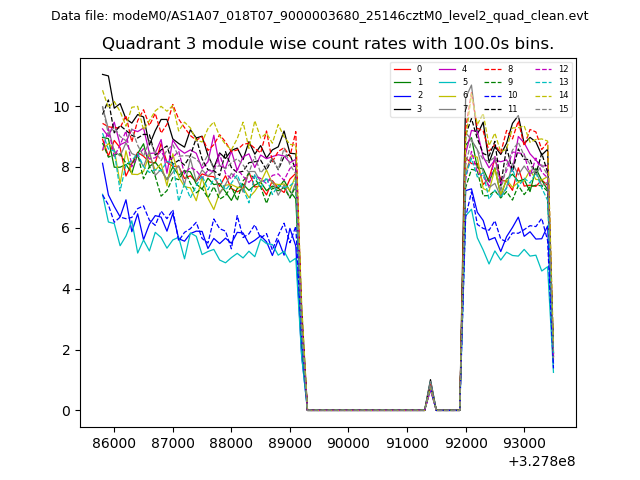
| Module-wise count rates for Quadrant C Data is divided into 100 sec bins |
 |
 |
| Module-wise count rates for Quadrant D Data is divided into 100 sec bins |
 |
 |
| Parameter | Plot |
|---|---|
| CZT HV Monitor |  |
| D_VDD | 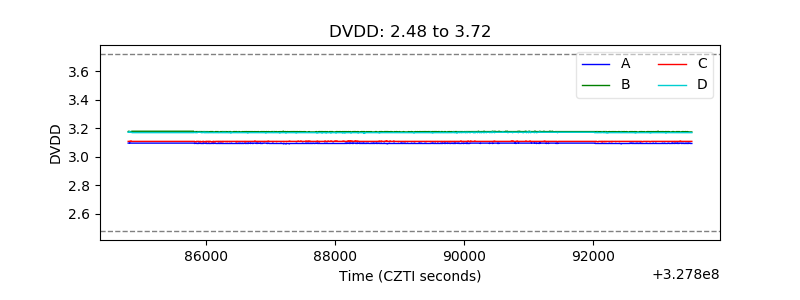 |
| Temperature 1 | 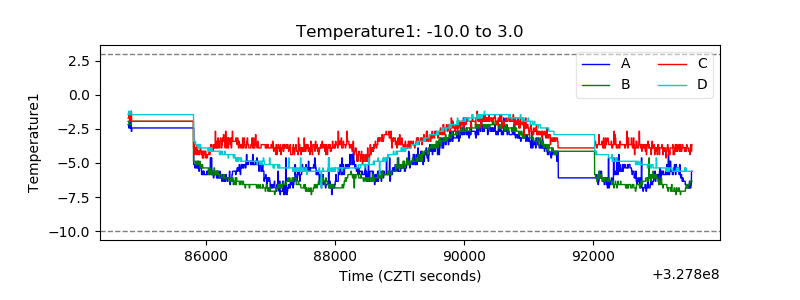 |
| Veto HV Monitor | 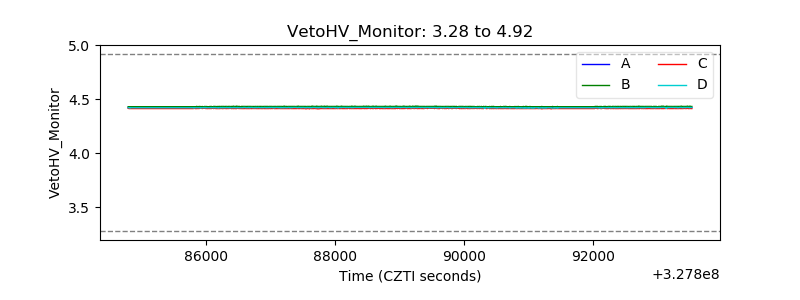 |
| Veto LLD | 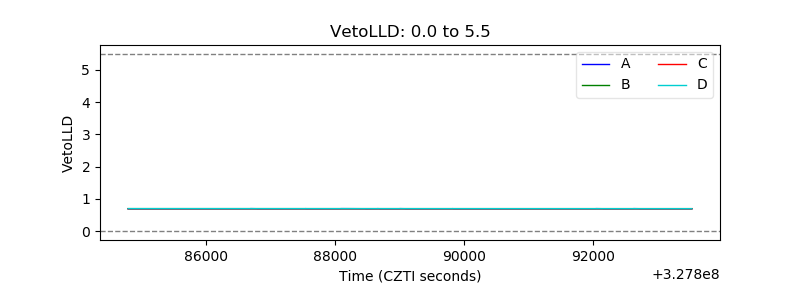 |
| Alpha Counter | 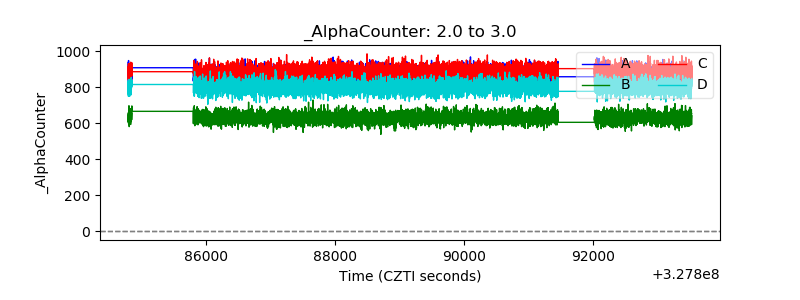 |
| _CPM_Rate | 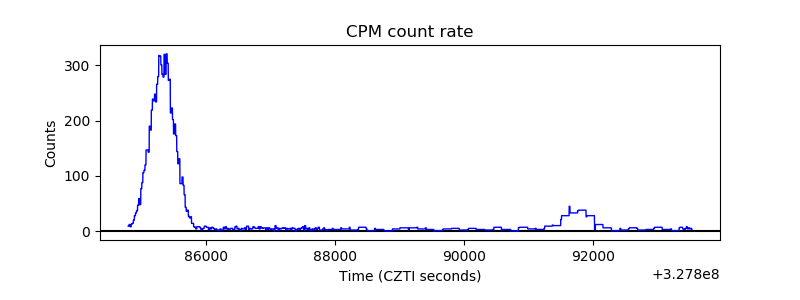 |
| CZT Counter | 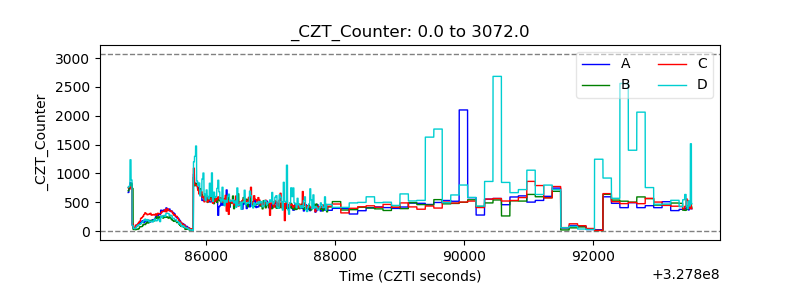 |
| +2.5 Volts monitor |  |
| +5 Volts monitor |  |
| _ROLL_ROT |  |
| _Roll_DEC | 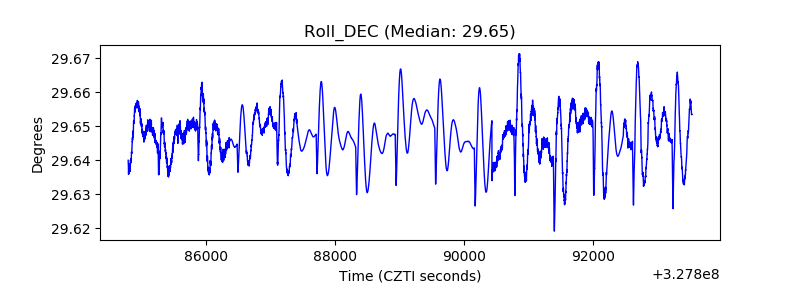 |
| _Roll_RA | 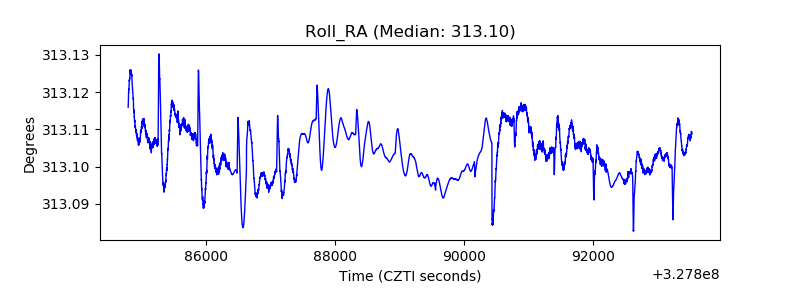 |
| Veto Counter | 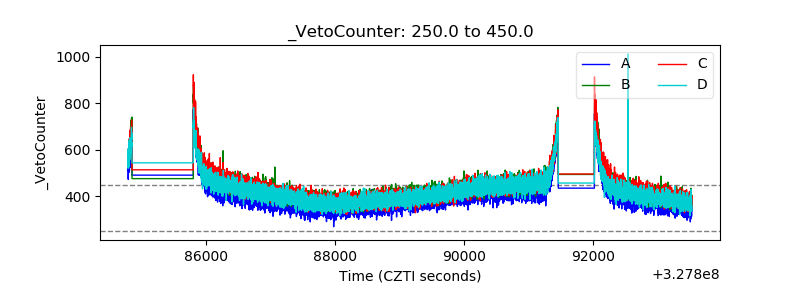 |