| Param | Original file | Final file |
|---|---|---|
| Filename | modeM0/AS1A07_018T07_9000003680_25147cztM0_level2.evt | modeM0/AS1A07_018T07_9000003680_25147cztM0_level2_quad_clean.evt |
| Size (bytes) | 564,050,880 | 106,611,840 |
| Size | 537.9 MB | 101.7 MB |
| Events in quadrant A | 3,597,936 | 686,227 |
| Events in quadrant B | 3,691,607 | 699,446 |
| Events in quadrant C | 3,870,269 | 669,951 |
| Events in quadrant D | 5,410,954 | 648,065 |
| Mode M0 | |||
|---|---|---|---|
| Quadrant | BADHDUFLAG | Total packets | Discarded packets |
| A | 0 | 15738 | 0 |
| B | 0 | 15877 | 0 |
| C | 0 | 16333 | 0 |
| D | 0 | 21324 | 0 |
| Mode M9 | |||
|---|---|---|---|
| Quadrant | BADHDUFLAG | Total packets | Discarded packets |
| A | 0 | 5 | 0 |
| B | 0 | 6 | 0 |
| C | 0 | 6 | 0 |
| D | 0 | 6 | 0 |
| Quadrant | Total seconds | Saturated seconds | Saturation percentage |
|---|---|---|---|
| A | 7546 | 88 | 1.166181% |
| B | 7546 | 142 | 1.881792% |
| C | 7546 | 178 | 2.358866% |
| D | 7546 | 255 | 3.379274% |
Noise dominated data is calculated using 1-second bins in cleaned event files. If a bin has >2000 counts, and if more than 50% of those come from <1% of pixels, then it is considered to be noise-dominated and hence unusable.
| Quadrant | # 1 sec bins | Bins with >0 counts | Bins with >2000 counts | High rate bins dominated by noise | Noise dominated (total time) | Noise dominated (detector-on time) | Marked lightcurve |
|---|---|---|---|---|---|---|---|
| A | 7806 | 7547 | 0 | 0 | 0.00% | 0.00% | 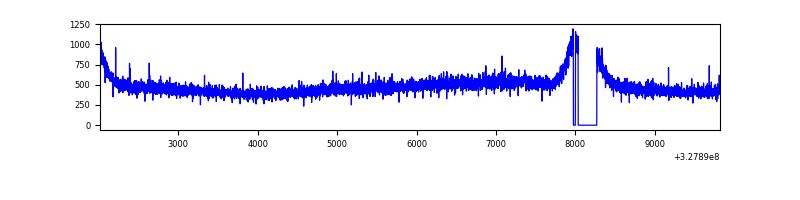 |
| B | 7806 | 7546 | 1 | 1 | 0.01% | 0.01% | 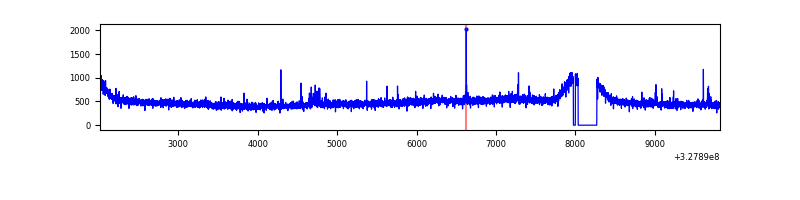 |
| C | 7806 | 7547 | 1 | 1 | 0.01% | 0.01% | 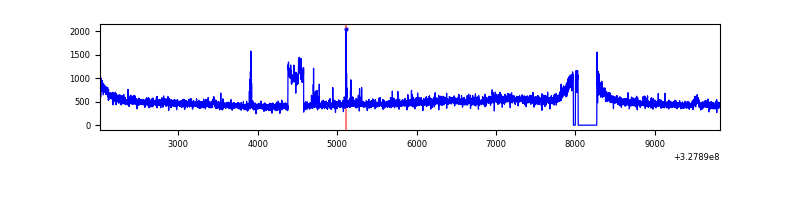 |
| D | 7806 | 7548 | 185 | 185 | 2.37% | 2.45% | 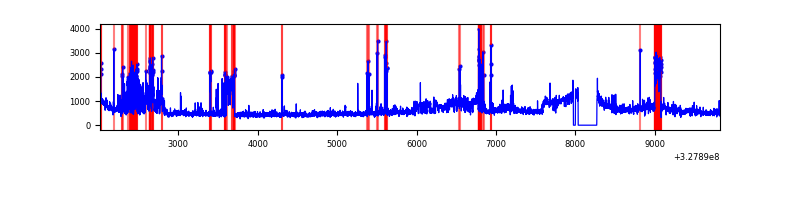 |
Top three noisy pixels from each quadrant. If the there are fewer than three noisy pixels in the level2.evt file, extra rows are filled as -1
| Pixel properties | Quadrant properties | ||||||
|---|---|---|---|---|---|---|---|
| Quadrant | DetID | PixID | Counts | Sigma | Mean | Median | Sigma |
| A | 13 | 254 | 11071 | 53.93 | 931 | 910 | 188.4 |
| A | 3 | 137 | 9076 | 43.34 | 931 | 910 | 188.4 |
| A | 0 | 226 | 8037 | 37.83 | 931 | 910 | 188.4 |
| B | 12 | 111 | 23096 | 121.67 | 932 | 906 | 182.4 |
| B | 11 | 111 | 19788 | 103.53 | 932 | 906 | 182.4 |
| B | 14 | 111 | 18222 | 94.94 | 932 | 906 | 182.4 |
| C | 7 | 247 | 176972 | 828.04 | 898 | 902 | 212.6 |
| C | 14 | 238 | 141869 | 662.95 | 898 | 902 | 212.6 |
| C | 0 | 207 | 21982 | 99.14 | 898 | 902 | 212.6 |
| D | 1 | 52 | 1324303 | 6022.94 | 898 | 872 | 219.7 |
| D | 8 | 195 | 397956 | 1807.13 | 898 | 872 | 219.7 |
| D | 2 | 244 | 216940 | 983.32 | 898 | 872 | 219.7 |
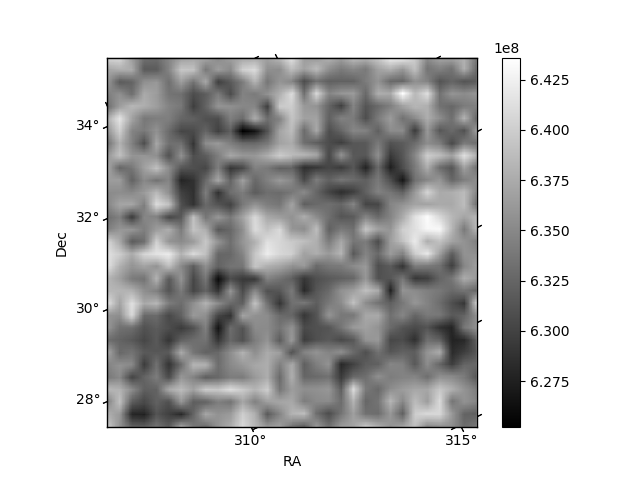
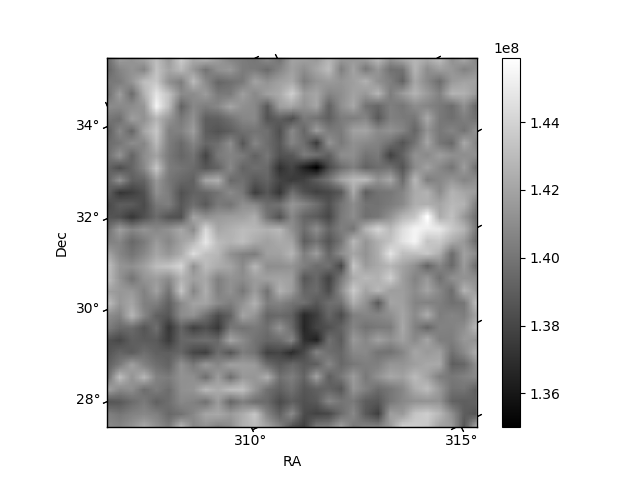
Histogram calculated using DETX and DETY for each event in the final _common_clean file
| Quadrant A | 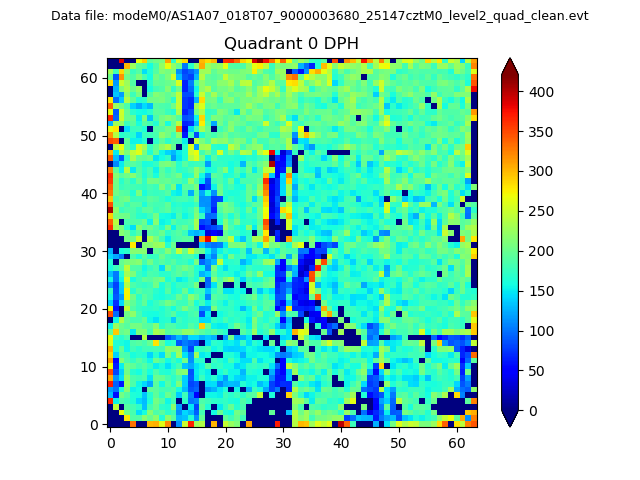 |
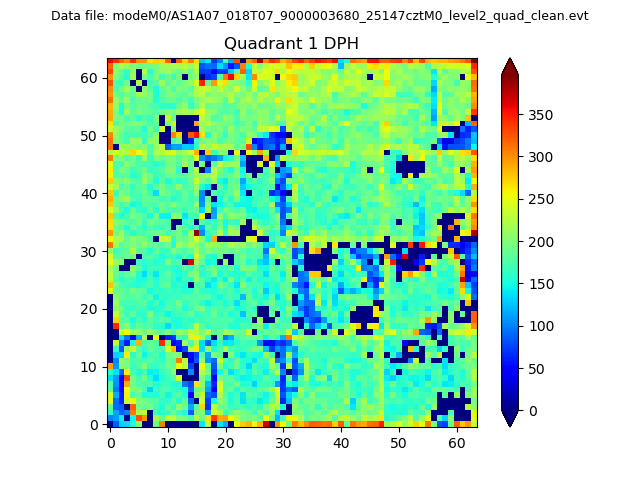 |
Quadrant B |
|---|---|---|---|
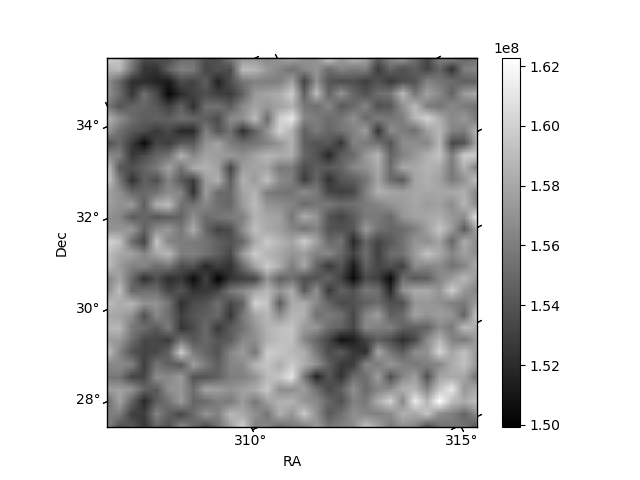
| Quadrant D | 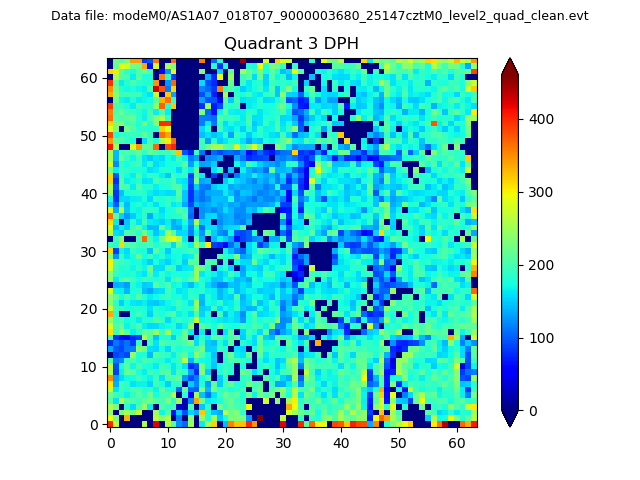 |
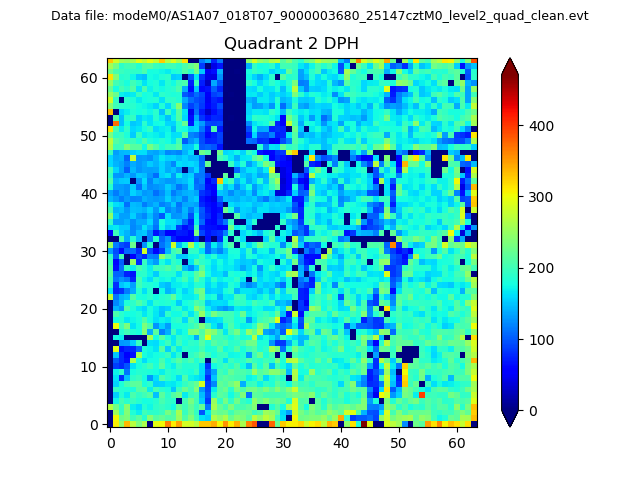 |
Quadrant C |
| Plot type | Count rate plots | Images |
|---|---|---|
| Comparison with Poisson distribution Blue bars denote a histogram of data divided into 1 sec bins. Red curve is a Poisson curve with rate = median count rate of data. |
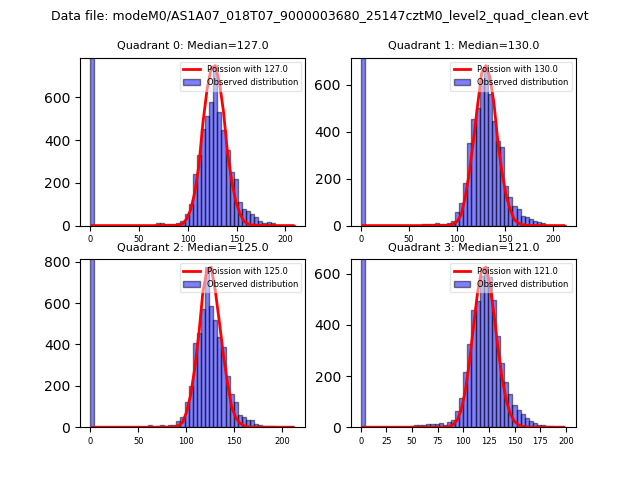 |
 |
| Quadrant-wise count rates Data is divided into 100 sec bins |
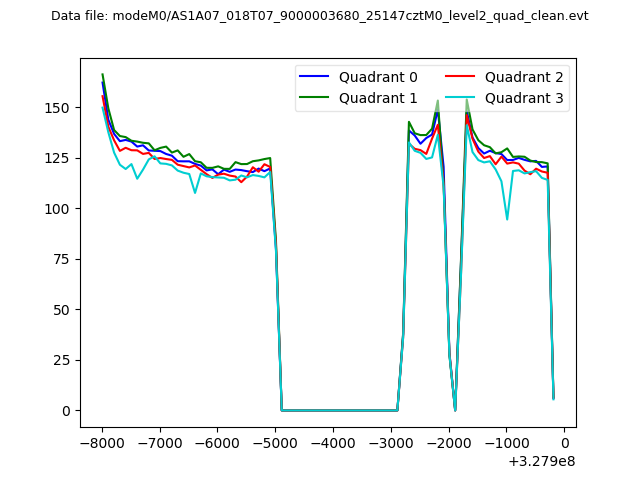 |
|
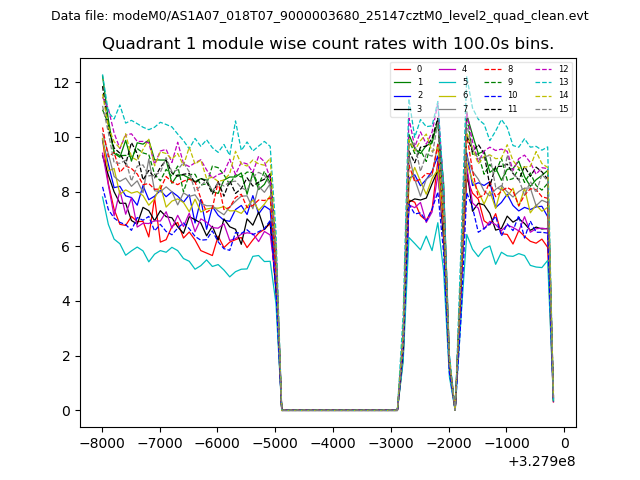
| Module-wise count rates for Quadrant A Data is divided into 100 sec bins |
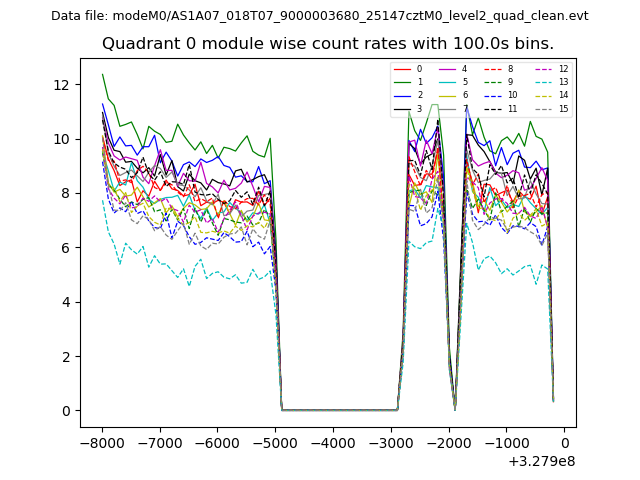 |
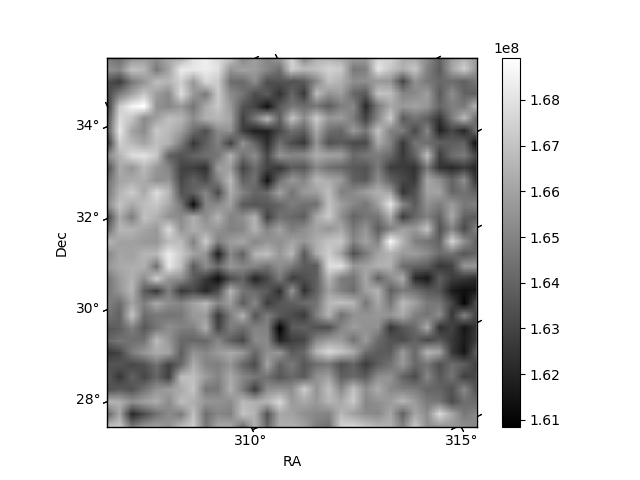 |
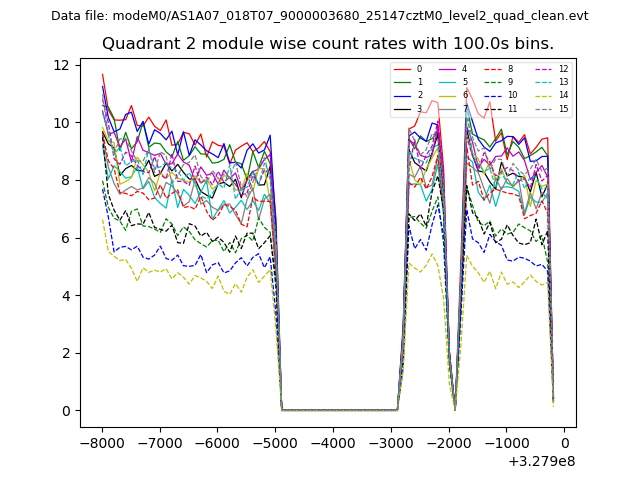
| Module-wise count rates for Quadrant B Data is divided into 100 sec bins |
 |
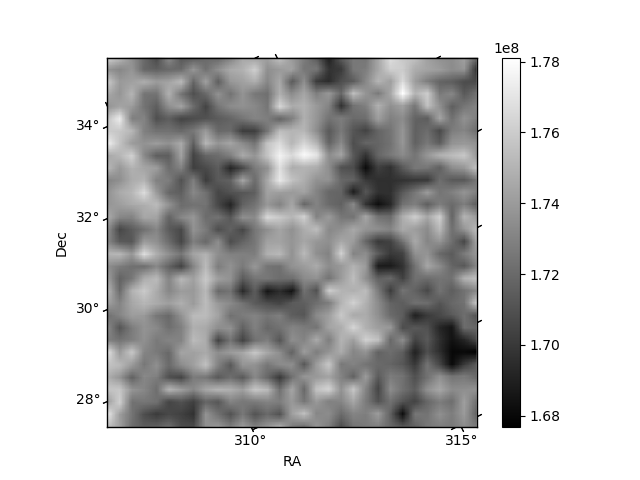 |
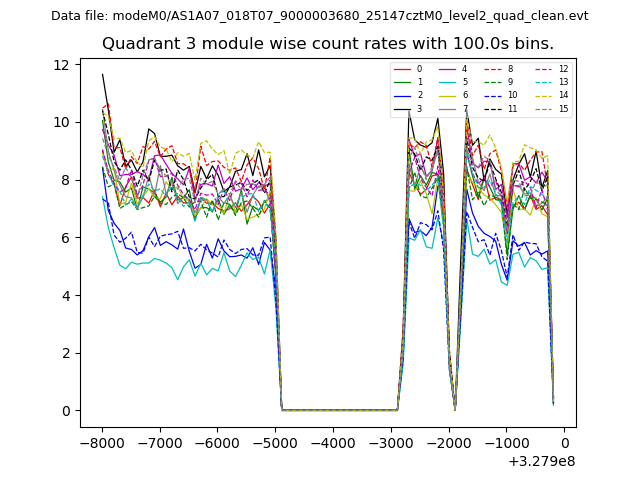
| Module-wise count rates for Quadrant C Data is divided into 100 sec bins |
 |
 |
| Module-wise count rates for Quadrant D Data is divided into 100 sec bins |
 |
 |
| Parameter | Plot |
|---|---|
| CZT HV Monitor | 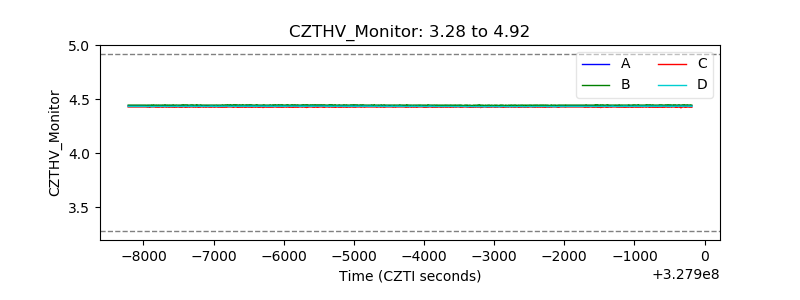 |
| D_VDD | 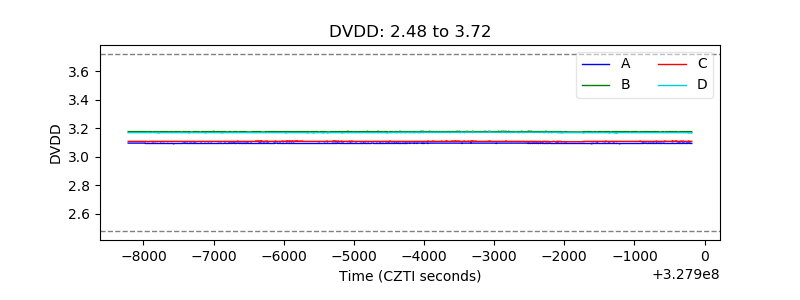 |
| Temperature 1 | 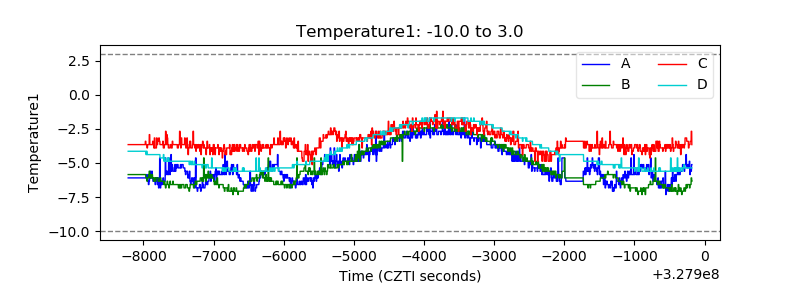 |
| Veto HV Monitor | 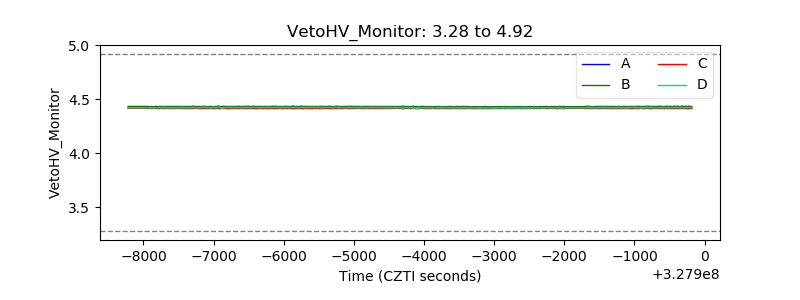 |
| Veto LLD | 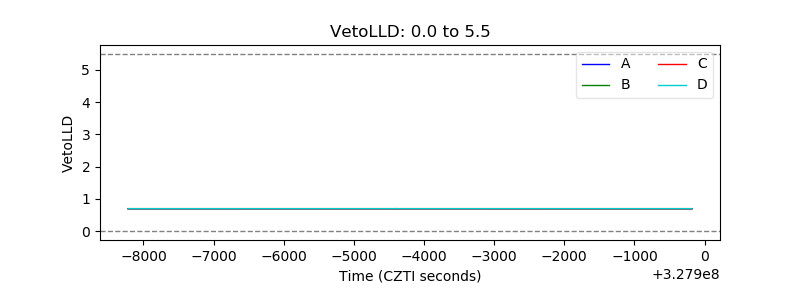 |
| Alpha Counter | 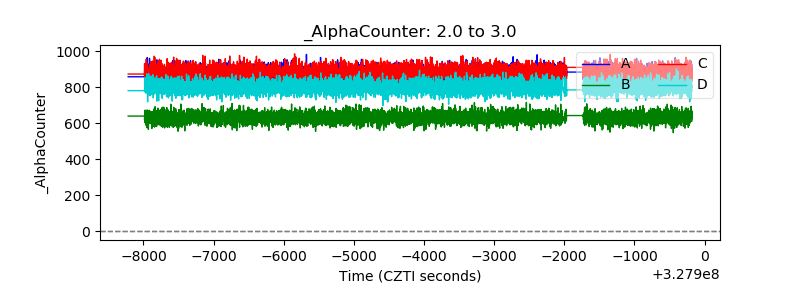 |
| _CPM_Rate | 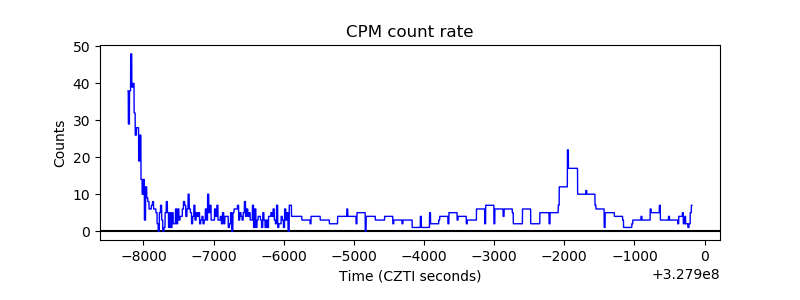 |
| CZT Counter | 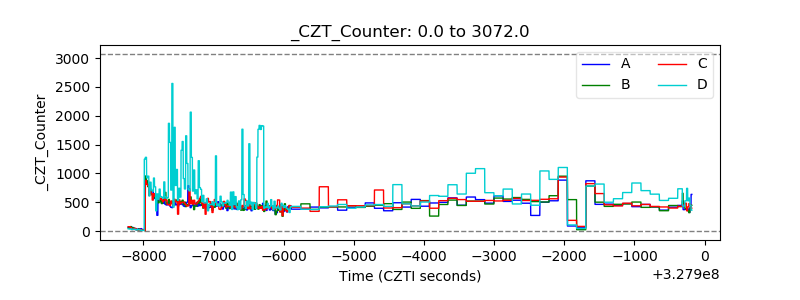 |
| +2.5 Volts monitor |  |
| +5 Volts monitor |  |
| _ROLL_ROT | 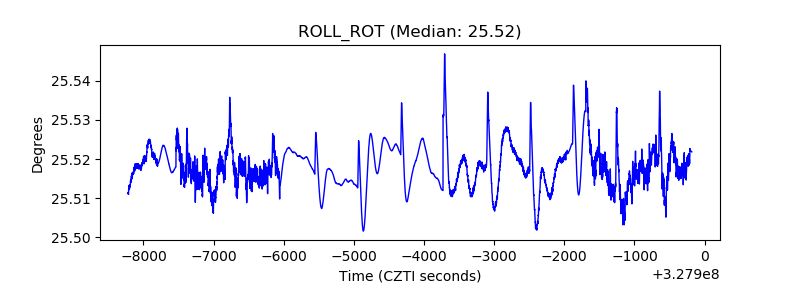 |
| _Roll_DEC | 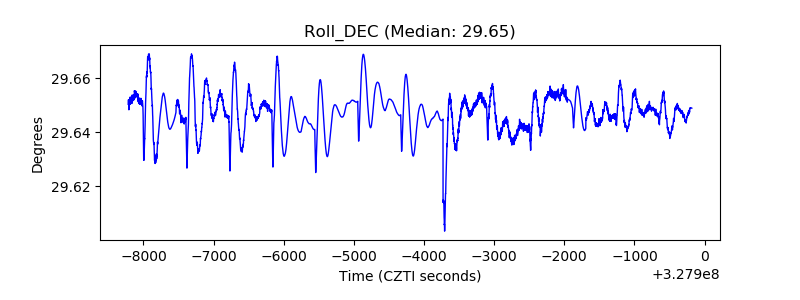 |
| _Roll_RA |  |
| Veto Counter | 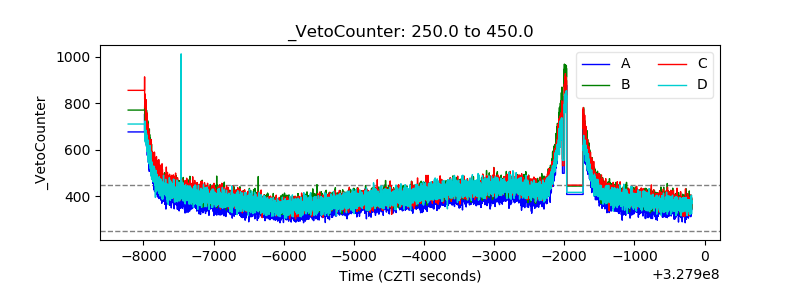 |