| Param | Original file | Final file |
|---|---|---|
| Filename | modeM0/AS1A07_018T02_9000003684_25159cztM0_level2.evt | modeM0/AS1A07_018T02_9000003684_25159cztM0_level2_quad_clean.evt |
| Size (bytes) | 321,497,280 | 58,141,440 |
| Size | 306.6 MB | 55.4 MB |
| Events in quadrant A | 1,954,949 | 386,371 |
| Events in quadrant B | 2,000,646 | 394,452 |
| Events in quadrant C | 2,192,806 | 381,322 |
| Events in quadrant D | 3,321,737 | 322,342 |
| Mode M9 | |||
|---|---|---|---|
| Quadrant | BADHDUFLAG | Total packets | Discarded packets |
| A | 0 | 11 | 0 |
| B | 0 | 11 | 0 |
| C | 0 | 11 | 0 |
| D | 0 | 11 | 0 |
| Mode M0 | |||
|---|---|---|---|
| Quadrant | BADHDUFLAG | Total packets | Discarded packets |
| A | 0 | 8279 | 0 |
| B | 0 | 8342 | 0 |
| C | 0 | 9037 | 0 |
| D | 0 | 12225 | 0 |
| Quadrant | Total seconds | Saturated seconds | Saturation percentage |
|---|---|---|---|
| A | 3904 | 51 | 1.306352% |
| B | 3904 | 68 | 1.741803% |
| C | 3904 | 99 | 2.535861% |
| D | 3904 | 563 | 14.421107% |
Noise dominated data is calculated using 1-second bins in cleaned event files. If a bin has >2000 counts, and if more than 50% of those come from <1% of pixels, then it is considered to be noise-dominated and hence unusable.
| Quadrant | # 1 sec bins | Bins with >0 counts | Bins with >2000 counts | High rate bins dominated by noise | Noise dominated (total time) | Noise dominated (detector-on time) | Marked lightcurve |
|---|---|---|---|---|---|---|---|
| A | 4999 | 3904 | 0 | 0 | 0.00% | 0.00% | 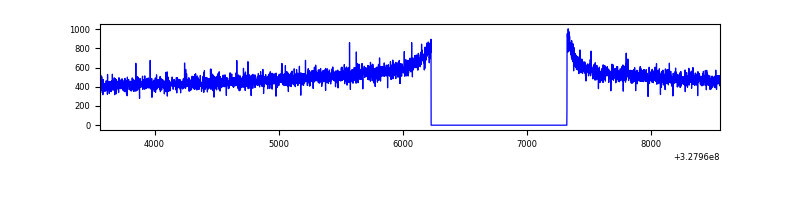 |
| B | 4999 | 3905 | 1 | 1 | 0.02% | 0.03% | 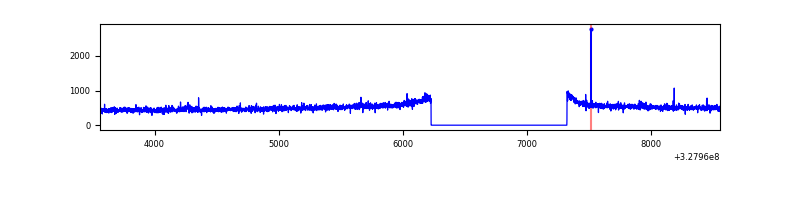 |
| C | 4999 | 3904 | 0 | 0 | 0.00% | 0.00% | 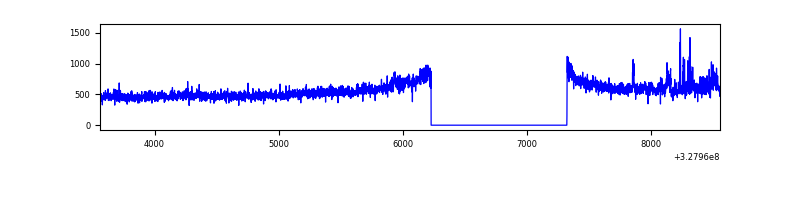 |
| D | 4999 | 3904 | 526 | 526 | 10.52% | 13.47% | 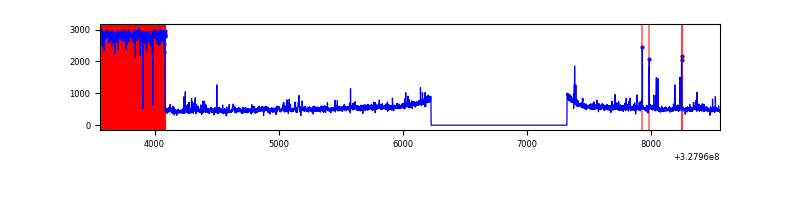 |
Top three noisy pixels from each quadrant. If the there are fewer than three noisy pixels in the level2.evt file, extra rows are filled as -1
| Pixel properties | Quadrant properties | ||||||
|---|---|---|---|---|---|---|---|
| Quadrant | DetID | PixID | Counts | Sigma | Mean | Median | Sigma |
| A | 13 | 254 | 6381 | 57.17 | 507 | 497 | 102.9 |
| A | 3 | 137 | 4611 | 39.98 | 507 | 497 | 102.9 |
| A | 0 | 226 | 4242 | 36.39 | 507 | 497 | 102.9 |
| B | 12 | 111 | 11635 | 113.05 | 504 | 492 | 98.6 |
| B | 11 | 111 | 10699 | 103.55 | 504 | 492 | 98.6 |
| B | 14 | 111 | 9643 | 92.84 | 504 | 492 | 98.6 |
| C | 7 | 247 | 162451 | 1408.84 | 489 | 492 | 115.0 |
| C | 14 | 238 | 78116 | 675.23 | 489 | 492 | 115.0 |
| C | 9 | 54 | 34674 | 297.34 | 489 | 492 | 115.0 |
| D | 1 | 52 | 1489485 | 13172.83 | 459 | 447 | 113.0 |
| D | 8 | 195 | 79370 | 698.2 | 459 | 447 | 113.0 |
| D | 12 | 235 | 15172 | 130.27 | 459 | 447 | 113.0 |
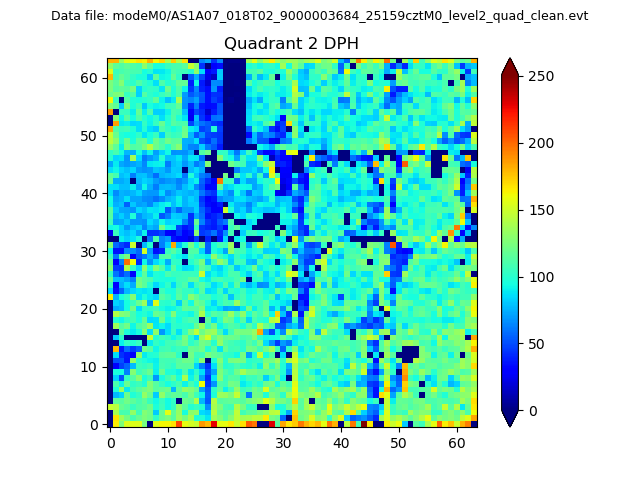
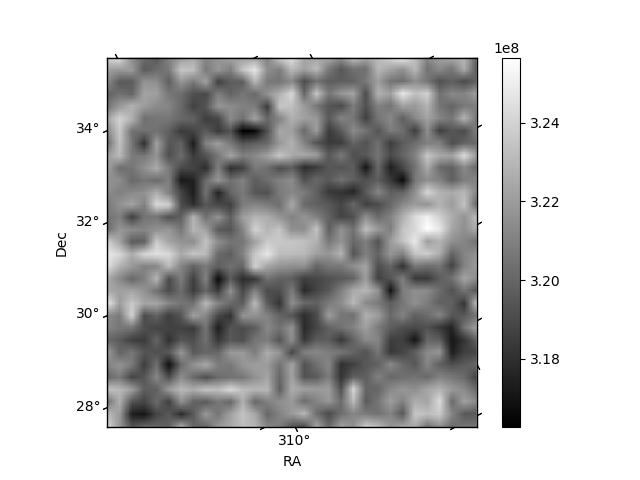
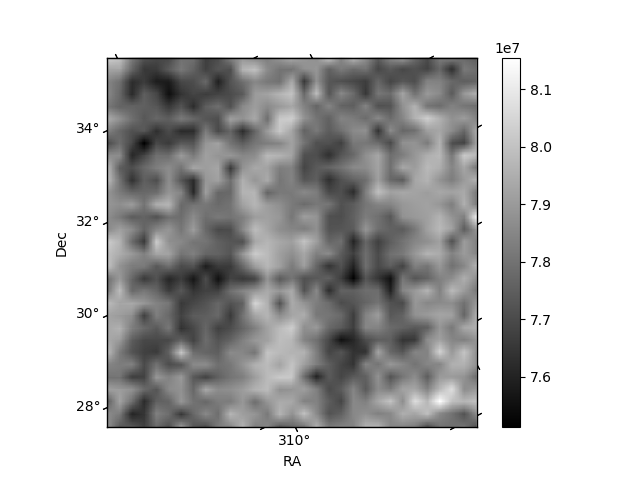
Histogram calculated using DETX and DETY for each event in the final _common_clean file
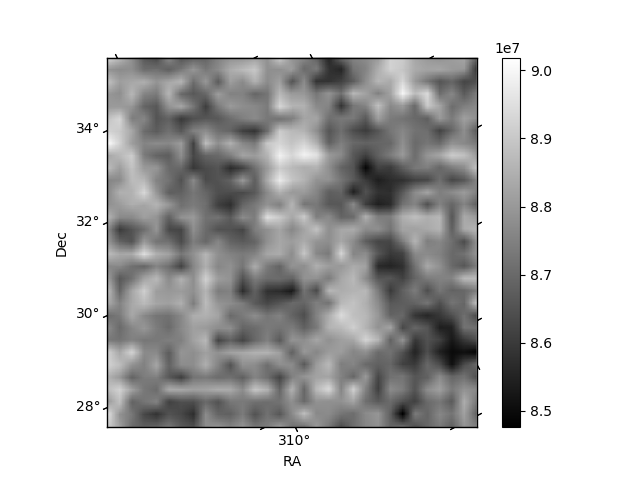
| Quadrant A | 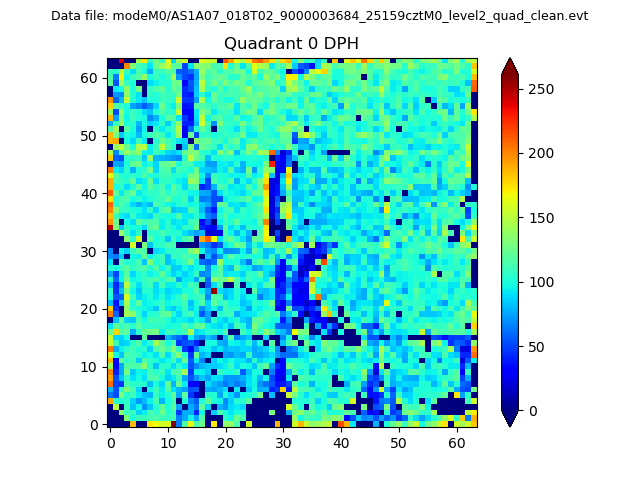 |
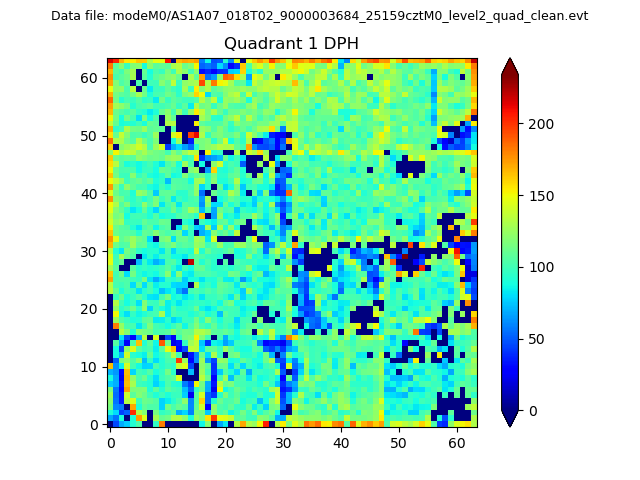 |
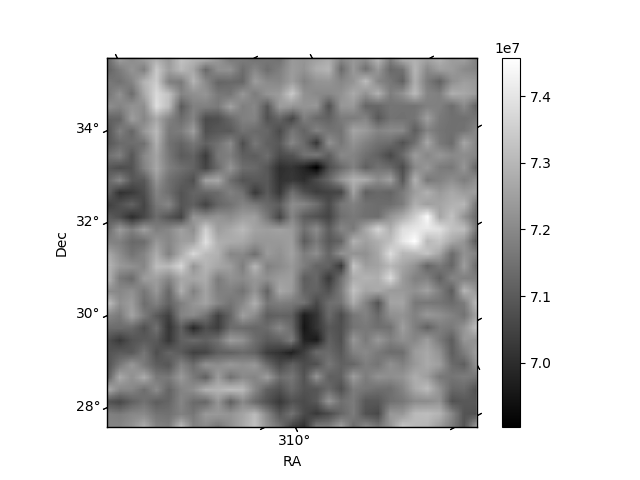
Quadrant B |
|---|---|---|---|
| Quadrant D | 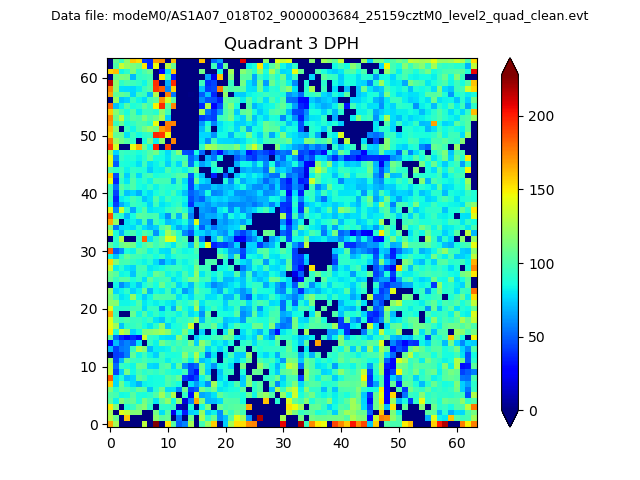 |
 |
Quadrant C |
| Plot type | Count rate plots | Images |
|---|---|---|
| Comparison with Poisson distribution Blue bars denote a histogram of data divided into 1 sec bins. Red curve is a Poisson curve with rate = median count rate of data. |
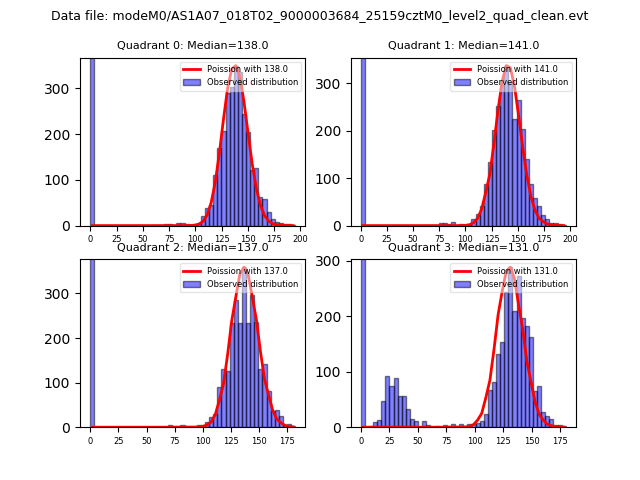 |
 |
| Quadrant-wise count rates Data is divided into 100 sec bins |
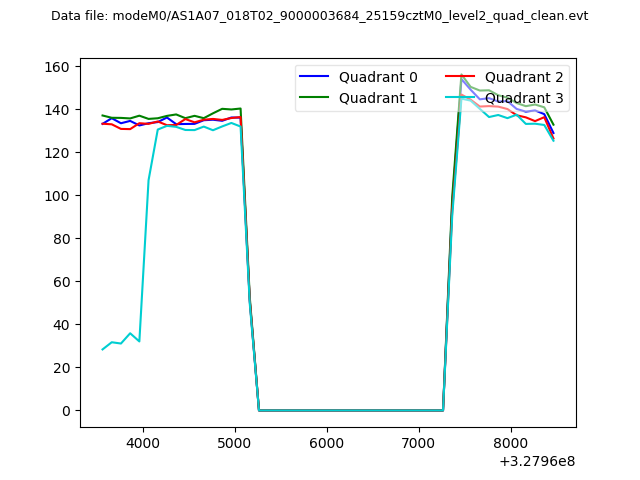 |
|
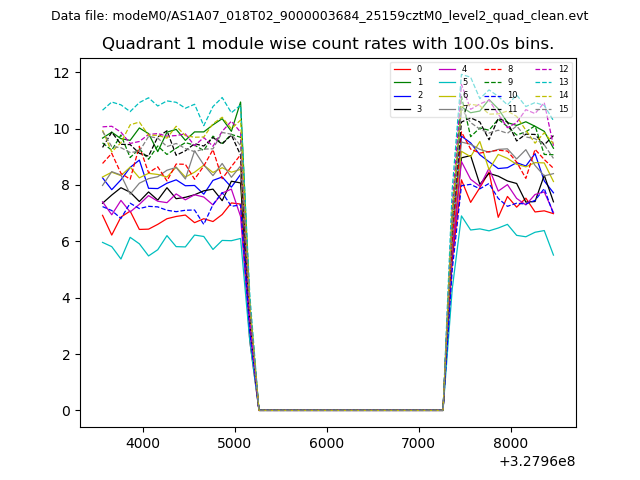
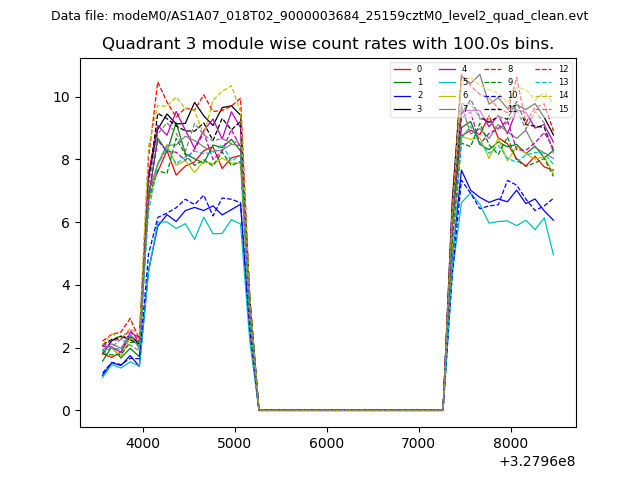
| Module-wise count rates for Quadrant A Data is divided into 100 sec bins |
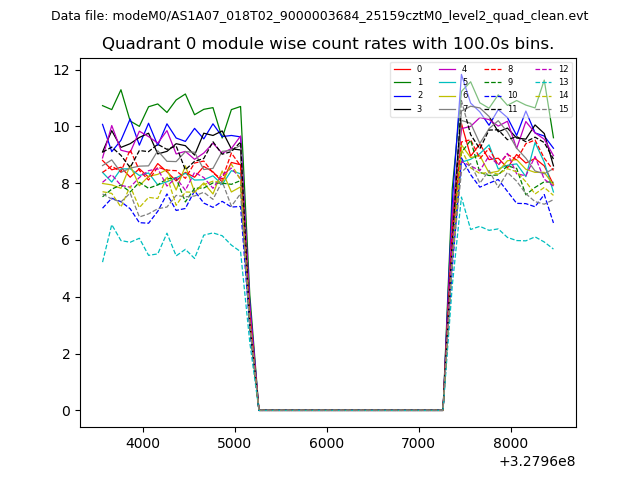 |
 |
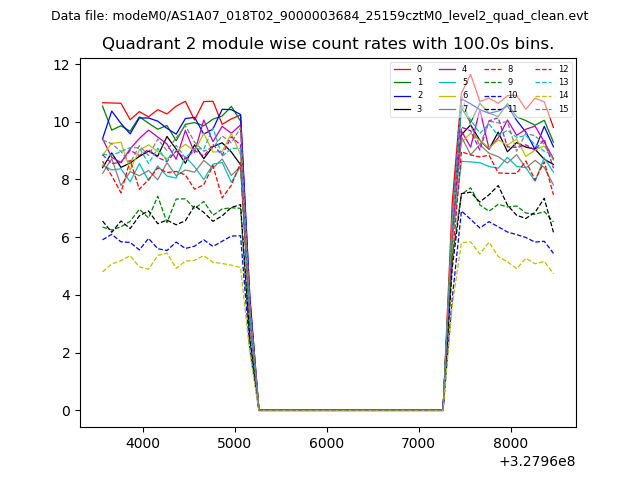
| Module-wise count rates for Quadrant B Data is divided into 100 sec bins |
 |
 |
| Module-wise count rates for Quadrant C Data is divided into 100 sec bins |
 |
 |
| Module-wise count rates for Quadrant D Data is divided into 100 sec bins |
 |
 |
| Parameter | Plot |
|---|---|
| CZT HV Monitor | 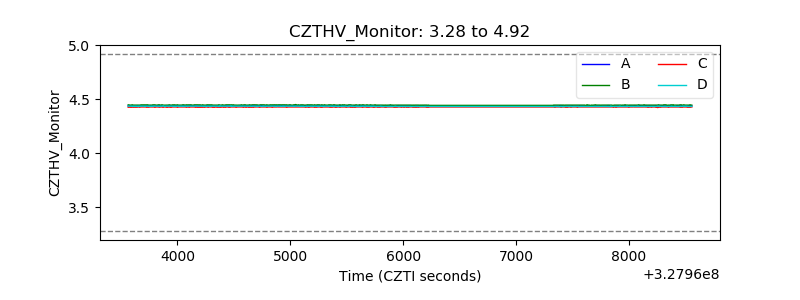 |
| D_VDD |  |
| Temperature 1 | 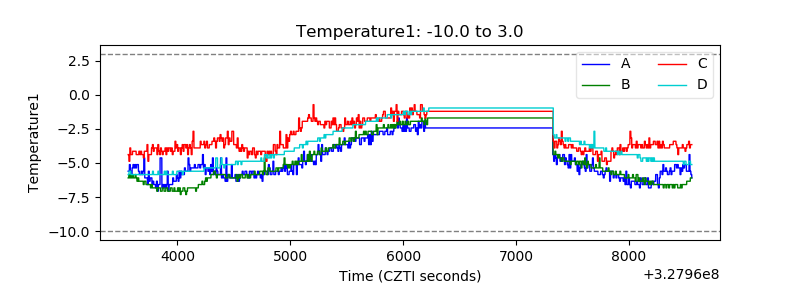 |
| Veto HV Monitor | 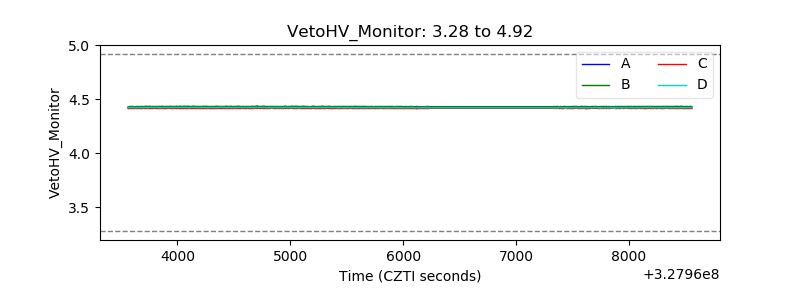 |
| Veto LLD | 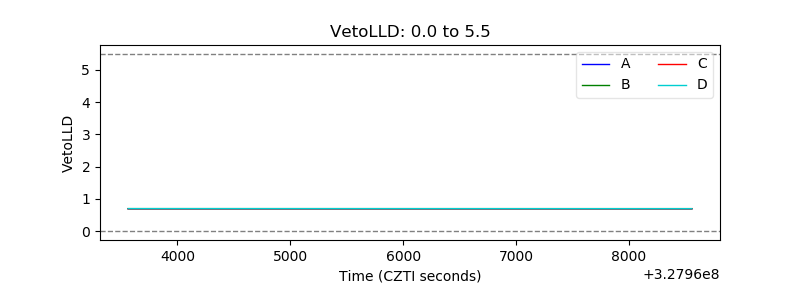 |
| Alpha Counter | 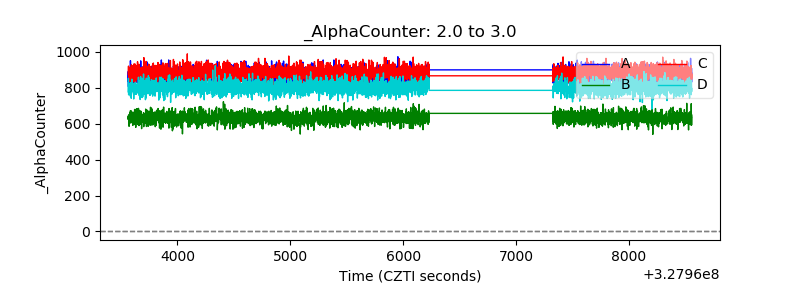 |
| _CPM_Rate | 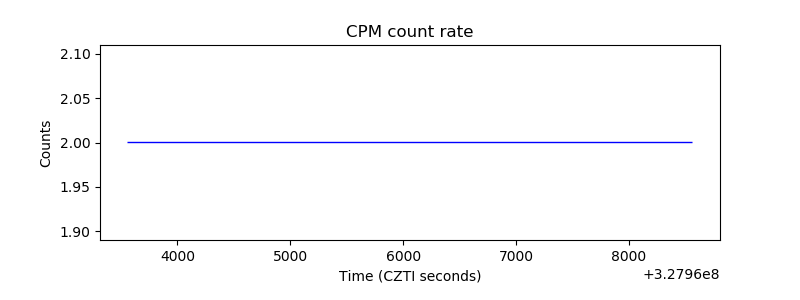 |
| CZT Counter | 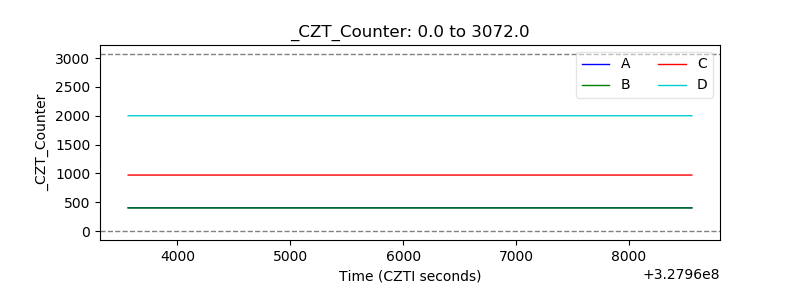 |
| +2.5 Volts monitor |  |
| +5 Volts monitor |  |
| _ROLL_ROT | 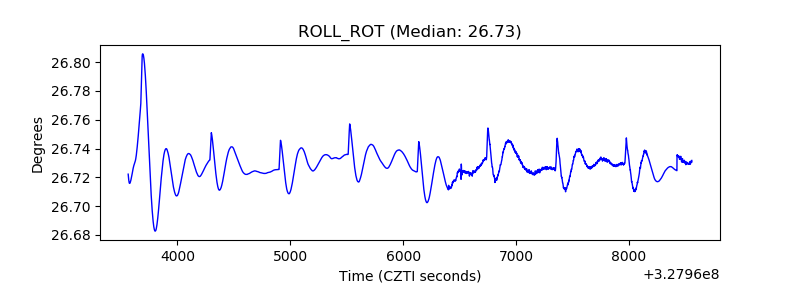 |
| _Roll_DEC | 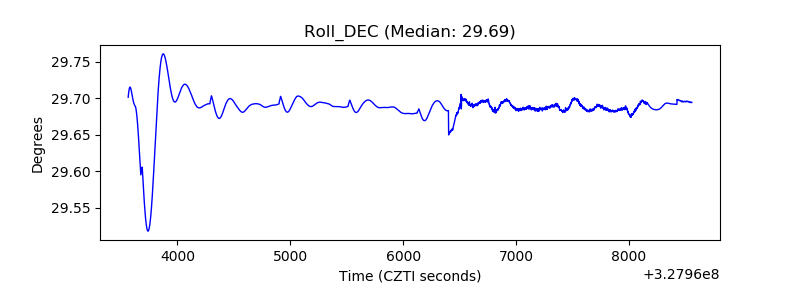 |
| _Roll_RA | 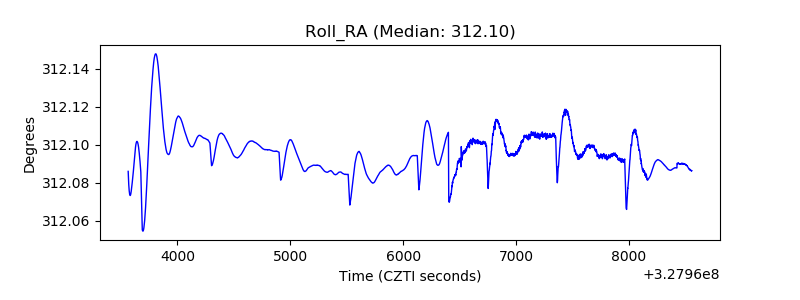 |
| Veto Counter | 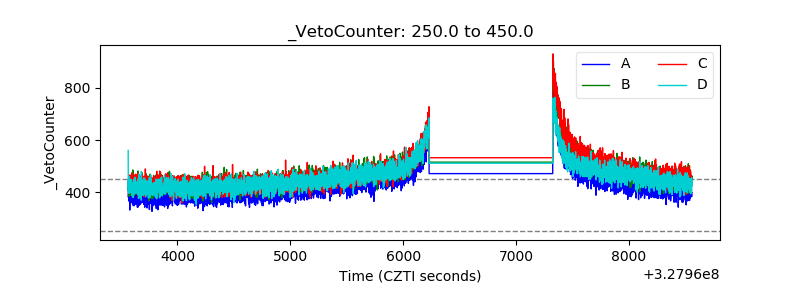 |