| Param | Original file | Final file |
|---|---|---|
| Filename | modeM0/AS1A07_018T02_9000003684_25160cztM0_level2.evt | modeM0/AS1A07_018T02_9000003684_25160cztM0_level2_quad_clean.evt |
| Size (bytes) | 496,247,040 | 102,150,720 |
| Size | 473.3 MB | 97.4 MB |
| Events in quadrant A | 3,277,322 | 660,642 |
| Events in quadrant B | 3,389,658 | 674,018 |
| Events in quadrant C | 4,324,450 | 647,894 |
| Events in quadrant D | 3,577,989 | 639,204 |
| Mode M9 | |||
|---|---|---|---|
| Quadrant | BADHDUFLAG | Total packets | Discarded packets |
| A | 0 | 10 | 0 |
| B | 0 | 11 | 0 |
| C | 0 | 11 | 0 |
| D | 0 | 11 | 0 |
| Mode M0 | |||
|---|---|---|---|
| Quadrant | BADHDUFLAG | Total packets | Discarded packets |
| A | 0 | 14085 | 0 |
| B | 0 | 14308 | 0 |
| C | 0 | 17622 | 0 |
| D | 0 | 15033 | 0 |
| Quadrant | Total seconds | Saturated seconds | Saturation percentage |
|---|---|---|---|
| A | 6769 | 41 | 0.605702% |
| B | 6769 | 85 | 1.255725% |
| C | 6769 | 150 | 2.215985% |
| D | 6769 | 34 | 0.502290% |
Noise dominated data is calculated using 1-second bins in cleaned event files. If a bin has >2000 counts, and if more than 50% of those come from <1% of pixels, then it is considered to be noise-dominated and hence unusable.
| Quadrant | # 1 sec bins | Bins with >0 counts | Bins with >2000 counts | High rate bins dominated by noise | Noise dominated (total time) | Noise dominated (detector-on time) | Marked lightcurve |
|---|---|---|---|---|---|---|---|
| A | 7534 | 6770 | 0 | 0 | 0.00% | 0.00% | 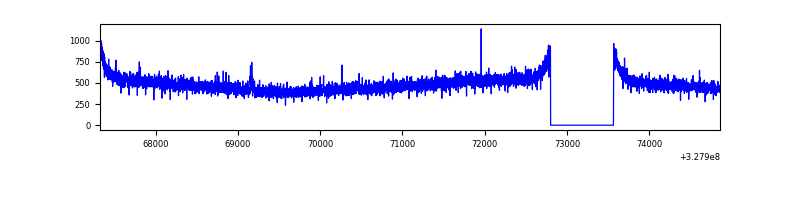 |
| B | 7534 | 6770 | 3 | 3 | 0.04% | 0.04% |  |
| C | 7534 | 6769 | 1 | 1 | 0.01% | 0.01% | 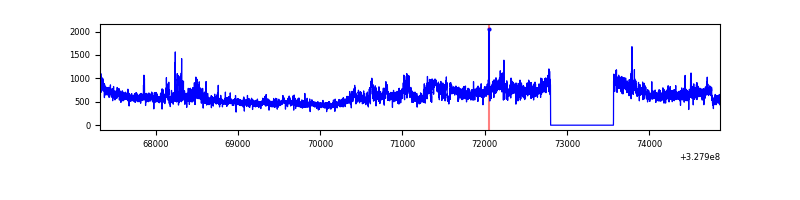 |
| D | 7534 | 6769 | 10 | 10 | 0.13% | 0.15% |  |
Top three noisy pixels from each quadrant. If the there are fewer than three noisy pixels in the level2.evt file, extra rows are filled as -1
| Pixel properties | Quadrant properties | ||||||
|---|---|---|---|---|---|---|---|
| Quadrant | DetID | PixID | Counts | Sigma | Mean | Median | Sigma |
| A | 13 | 254 | 10490 | 56.5 | 847 | 830 | 171.0 |
| A | 3 | 137 | 7779 | 40.64 | 847 | 830 | 171.0 |
| A | 0 | 226 | 7071 | 36.5 | 847 | 830 | 171.0 |
| B | 0 | 189 | 31340 | 185.44 | 848 | 826 | 164.5 |
| B | 12 | 111 | 20203 | 117.76 | 848 | 826 | 164.5 |
| B | 11 | 111 | 17851 | 103.47 | 848 | 826 | 164.5 |
| C | 7 | 247 | 925210 | 4763.99 | 823 | 828 | 194.0 |
| C | 14 | 238 | 129635 | 663.83 | 823 | 828 | 194.0 |
| C | 9 | 54 | 44239 | 223.73 | 823 | 828 | 194.0 |
| D | 1 | 52 | 292968 | 1442.02 | 831 | 807 | 202.6 |
| D | 8 | 195 | 117631 | 576.61 | 831 | 807 | 202.6 |
| D | 2 | 234 | 28640 | 137.38 | 831 | 807 | 202.6 |
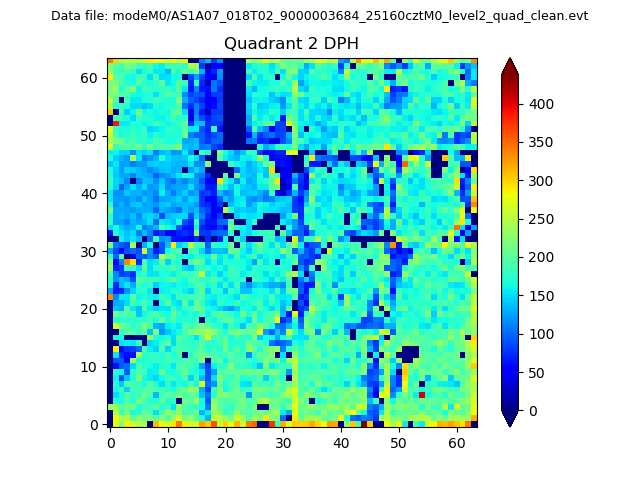
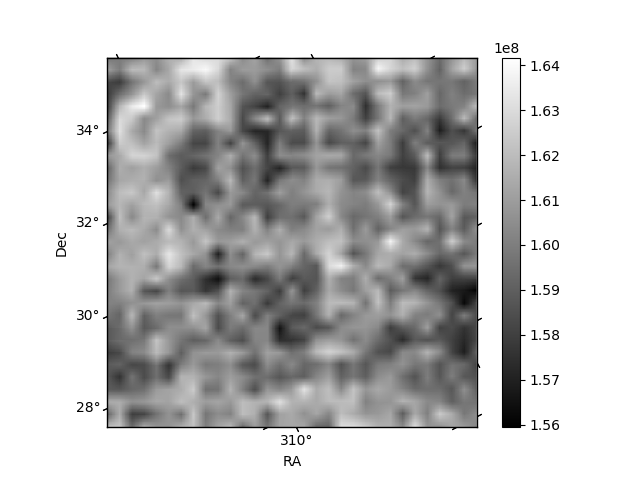
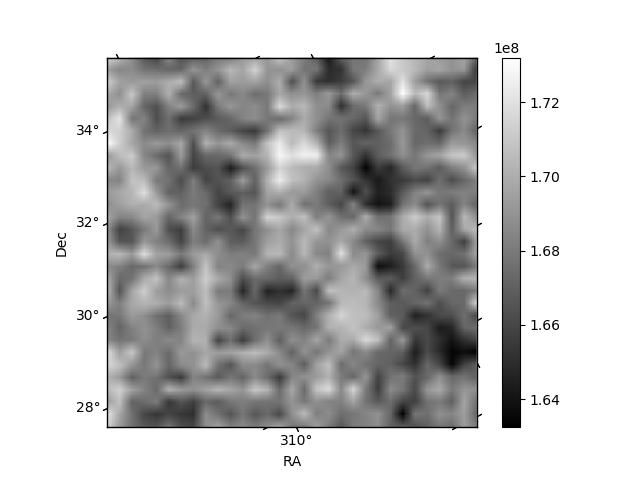
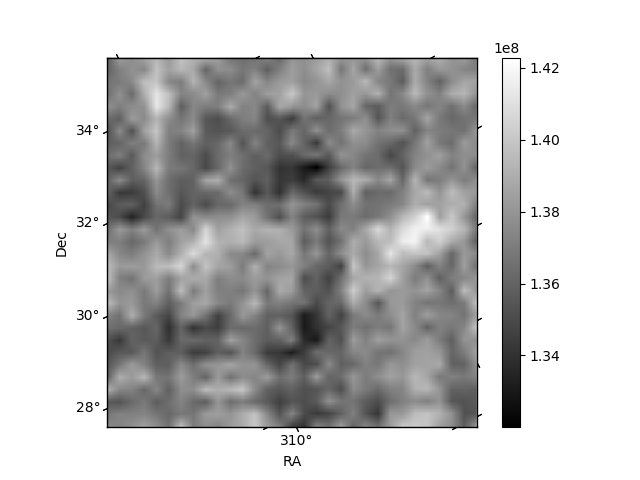
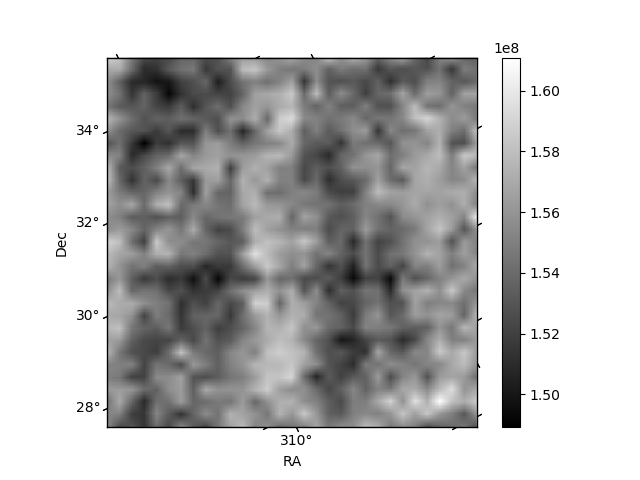
Histogram calculated using DETX and DETY for each event in the final _common_clean file
| Quadrant A | 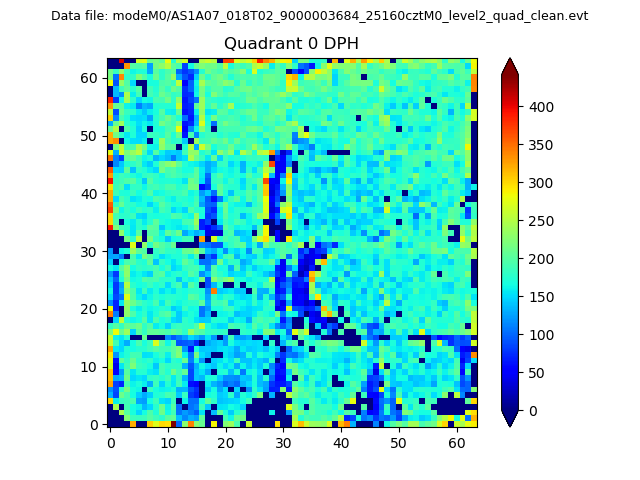 |
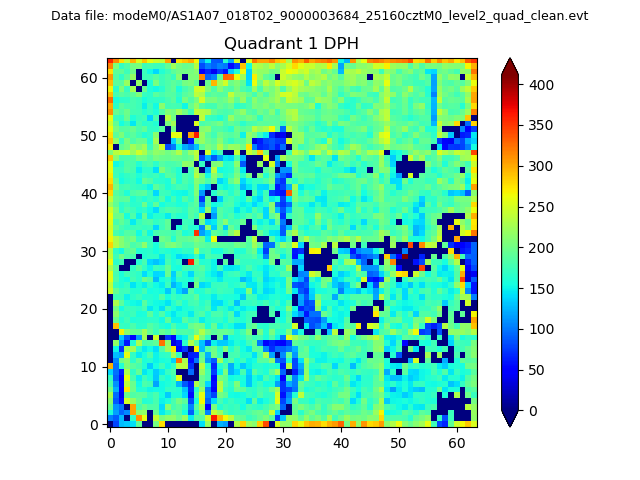 |
Quadrant B |
|---|---|---|---|
| Quadrant D | 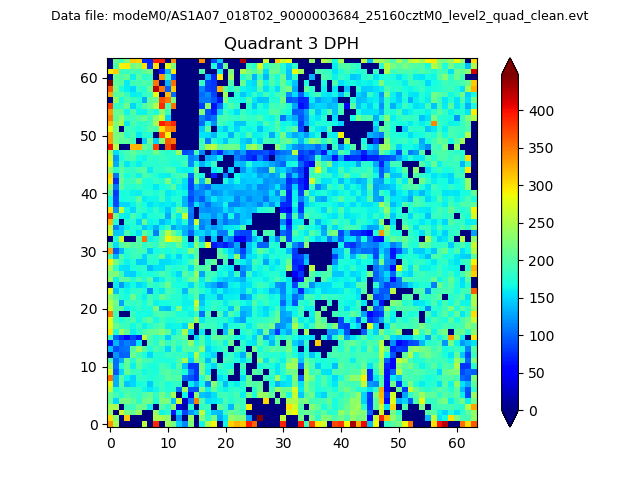 |
 |
Quadrant C |
| Plot type | Count rate plots | Images |
|---|---|---|
| Comparison with Poisson distribution Blue bars denote a histogram of data divided into 1 sec bins. Red curve is a Poisson curve with rate = median count rate of data. |
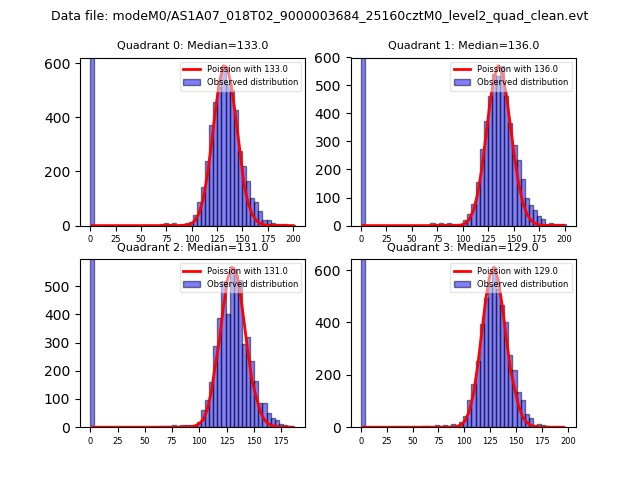 |
 |
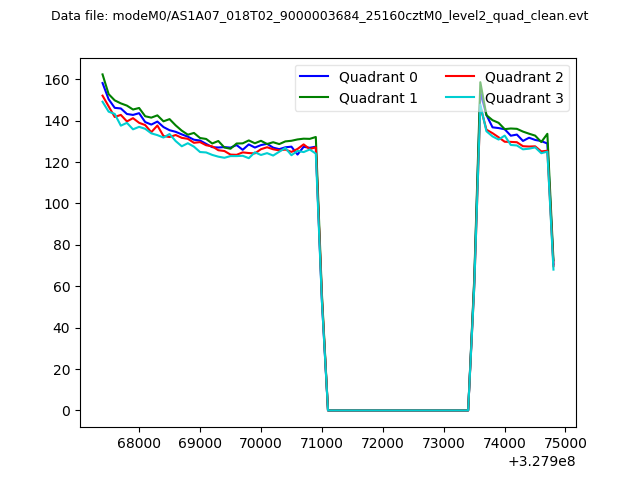
| Quadrant-wise count rates Data is divided into 100 sec bins |
 |
|
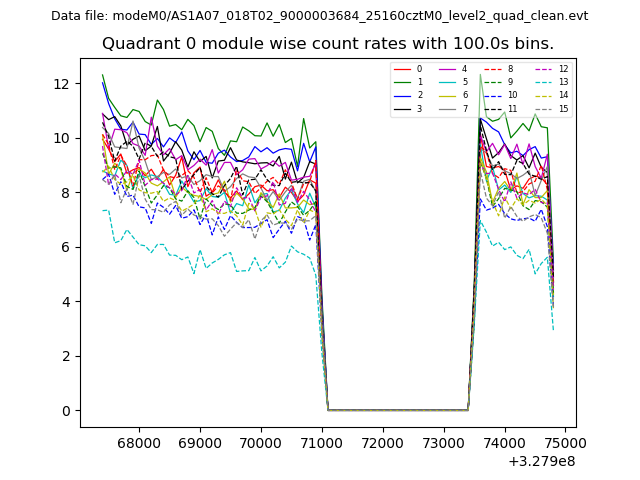
| Module-wise count rates for Quadrant A Data is divided into 100 sec bins |
 |
 |
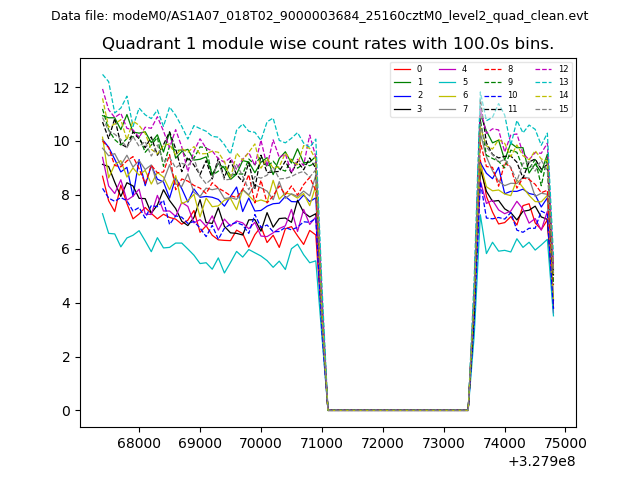
| Module-wise count rates for Quadrant B Data is divided into 100 sec bins |
 |
 |
| Module-wise count rates for Quadrant C Data is divided into 100 sec bins |
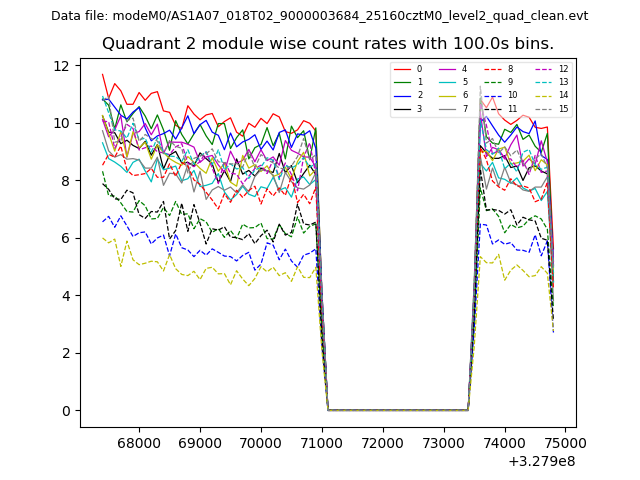 |
 |
| Module-wise count rates for Quadrant D Data is divided into 100 sec bins |
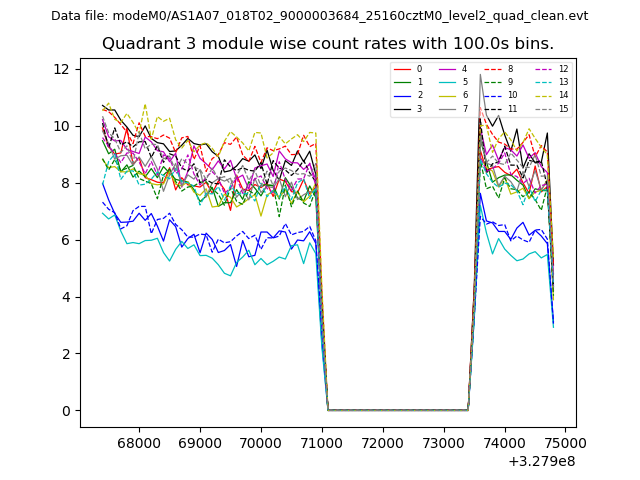 |
 |
| Parameter | Plot |
|---|---|
| CZT HV Monitor | 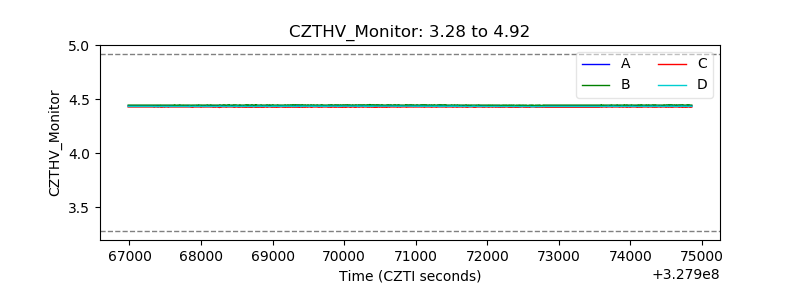 |
| D_VDD | 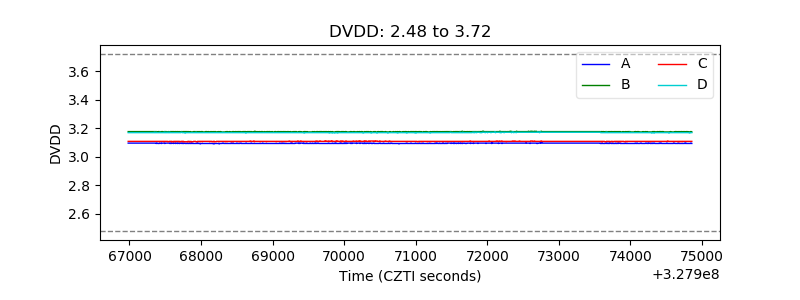 |
| Temperature 1 | 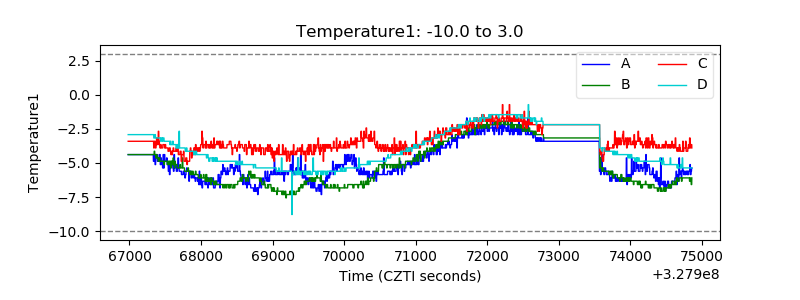 |
| Veto HV Monitor | 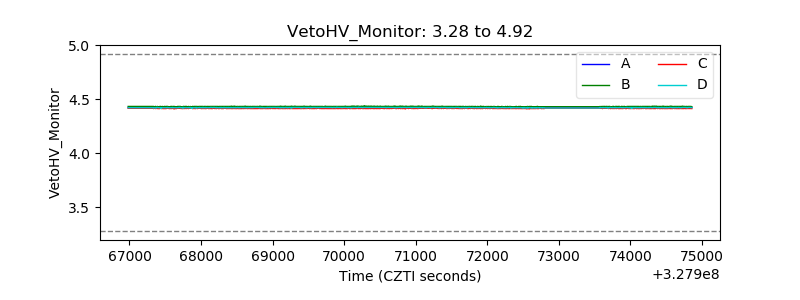 |
| Veto LLD | 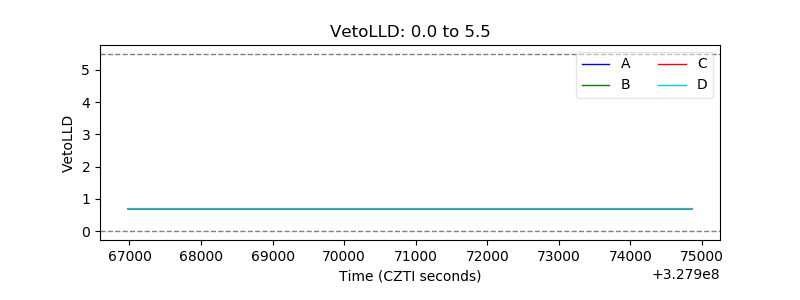 |
| Alpha Counter | 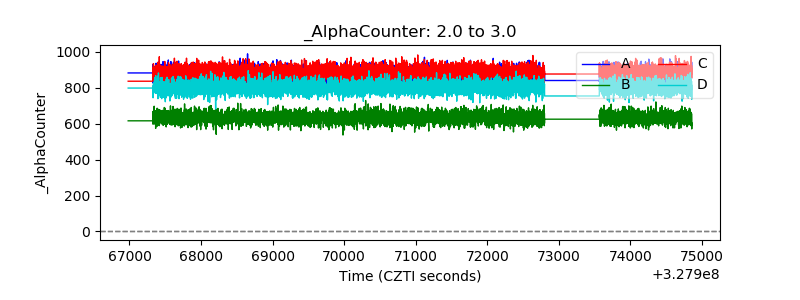 |
| _CPM_Rate | 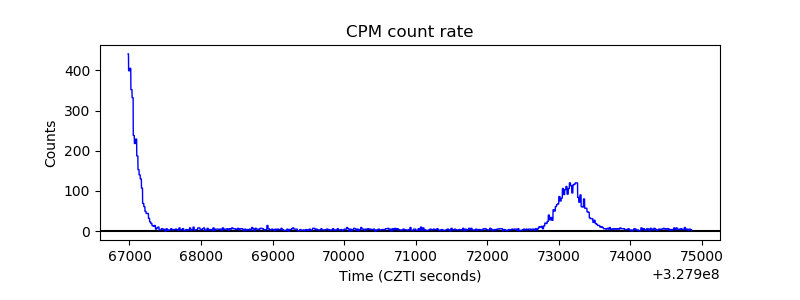 |
| CZT Counter | 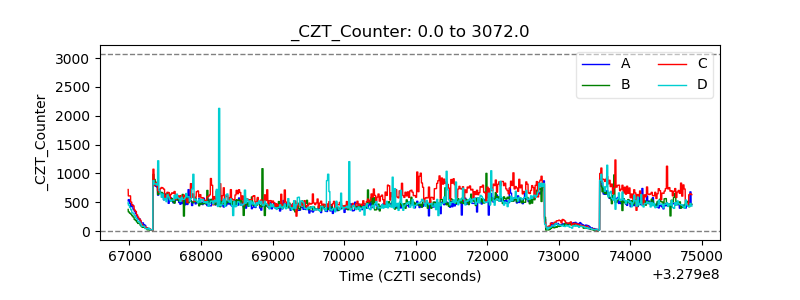 |
| +2.5 Volts monitor |  |
| +5 Volts monitor |  |
| _ROLL_ROT | 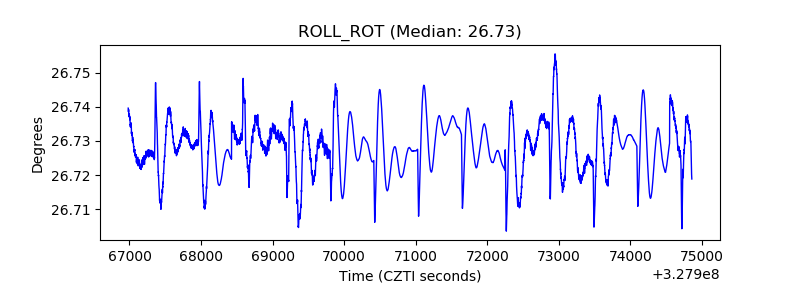 |
| _Roll_DEC | 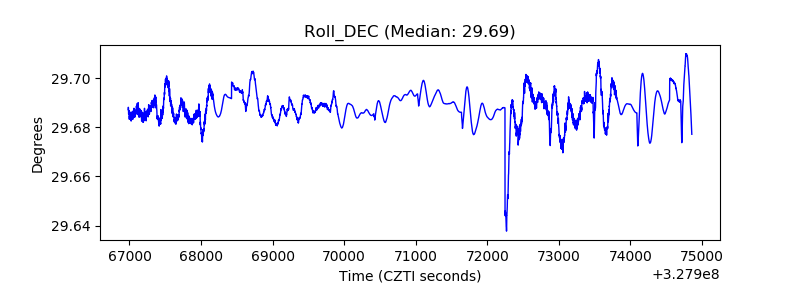 |
| _Roll_RA | 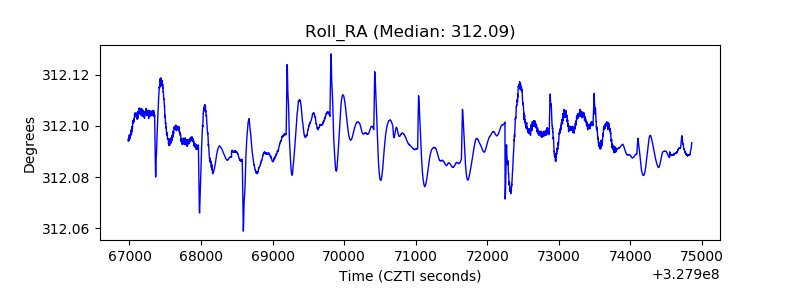 |
| Veto Counter | 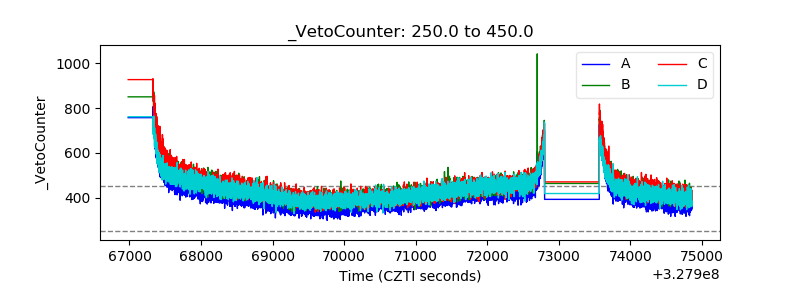 |