| Param | Original file | Final file |
|---|---|---|
| Filename | modeM0/AS1A07_018T02_9000003684_25161cztM0_level2.evt | modeM0/AS1A07_018T02_9000003684_25161cztM0_level2_quad_clean.evt |
| Size (bytes) | 554,892,480 | 104,434,560 |
| Size | 529.2 MB | 99.6 MB |
| Events in quadrant A | 3,621,011 | 669,338 |
| Events in quadrant B | 3,765,460 | 680,688 |
| Events in quadrant C | 4,690,598 | 652,570 |
| Events in quadrant D | 4,223,273 | 642,284 |
| Mode M9 | |||
|---|---|---|---|
| Quadrant | BADHDUFLAG | Total packets | Discarded packets |
| A | 0 | 10 | 0 |
| B | 0 | 10 | 0 |
| C | 0 | 10 | 0 |
| D | 0 | 10 | 0 |
| Mode M0 | |||
|---|---|---|---|
| Quadrant | BADHDUFLAG | Total packets | Discarded packets |
| A | 0 | 15711 | 0 |
| B | 0 | 15960 | 0 |
| C | 0 | 19261 | 0 |
| D | 0 | 17715 | 0 |
| Quadrant | Total seconds | Saturated seconds | Saturation percentage |
|---|---|---|---|
| A | 7436 | 118 | 1.586875% |
| B | 7437 | 170 | 2.285868% |
| C | 7437 | 253 | 3.401909% |
| D | 7437 | 99 | 1.331182% |
Noise dominated data is calculated using 1-second bins in cleaned event files. If a bin has >2000 counts, and if more than 50% of those come from <1% of pixels, then it is considered to be noise-dominated and hence unusable.
| Quadrant | # 1 sec bins | Bins with >0 counts | Bins with >2000 counts | High rate bins dominated by noise | Noise dominated (total time) | Noise dominated (detector-on time) | Marked lightcurve |
|---|---|---|---|---|---|---|---|
| A | 8531 | 7437 | 0 | 0 | 0.00% | 0.00% | 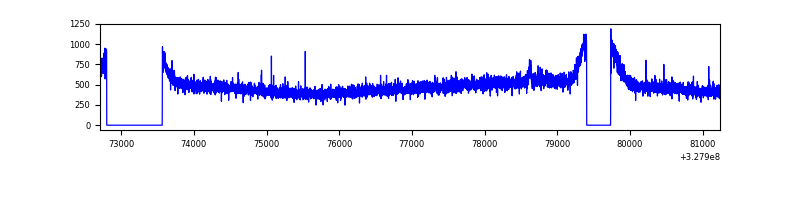 |
| B | 8532 | 7438 | 2 | 2 | 0.02% | 0.03% | 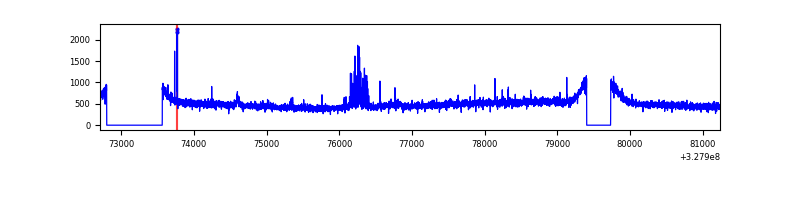 |
| C | 8532 | 7437 | 0 | 0 | 0.00% | 0.00% |  |
| D | 8532 | 7437 | 50 | 50 | 0.59% | 0.67% | 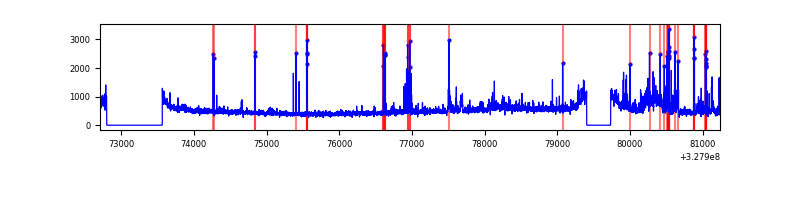 |
Top three noisy pixels from each quadrant. If the there are fewer than three noisy pixels in the level2.evt file, extra rows are filled as -1
| Pixel properties | Quadrant properties | ||||||
|---|---|---|---|---|---|---|---|
| Quadrant | DetID | PixID | Counts | Sigma | Mean | Median | Sigma |
| A | 11 | 208 | 14381 | 71.04 | 934 | 915 | 189.5 |
| A | 13 | 254 | 11275 | 54.66 | 934 | 915 | 189.5 |
| A | 3 | 137 | 8720 | 41.18 | 934 | 915 | 189.5 |
| B | 4 | 80 | 71631 | 390.94 | 931 | 905 | 180.9 |
| B | 0 | 189 | 27008 | 144.28 | 931 | 905 | 180.9 |
| B | 12 | 111 | 22959 | 121.9 | 931 | 905 | 180.9 |
| C | 7 | 247 | 998754 | 4640.01 | 904 | 910 | 215.1 |
| C | 14 | 238 | 142945 | 660.47 | 904 | 910 | 215.1 |
| C | 7 | 87 | 13220 | 57.24 | 904 | 910 | 215.1 |
| D | 1 | 52 | 551203 | 2494.17 | 911 | 887 | 220.6 |
| D | 8 | 195 | 190006 | 857.14 | 911 | 887 | 220.6 |
| D | 2 | 234 | 32273 | 142.25 | 911 | 887 | 220.6 |
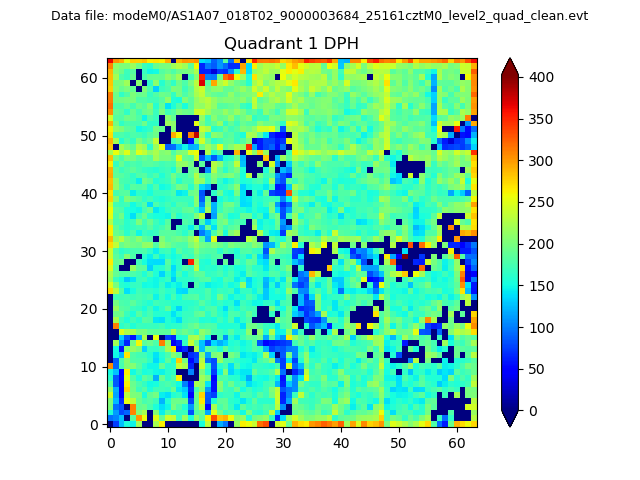
Histogram calculated using DETX and DETY for each event in the final _common_clean file
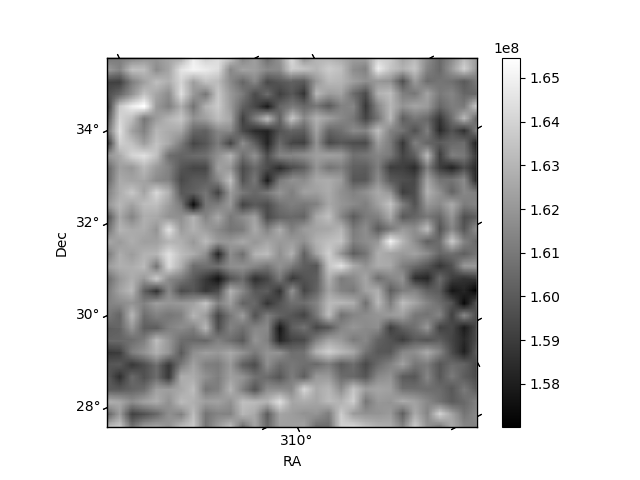
| Quadrant A | 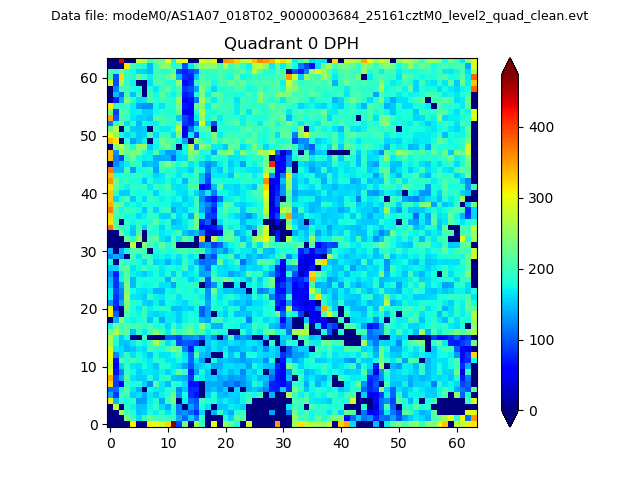 |
 |
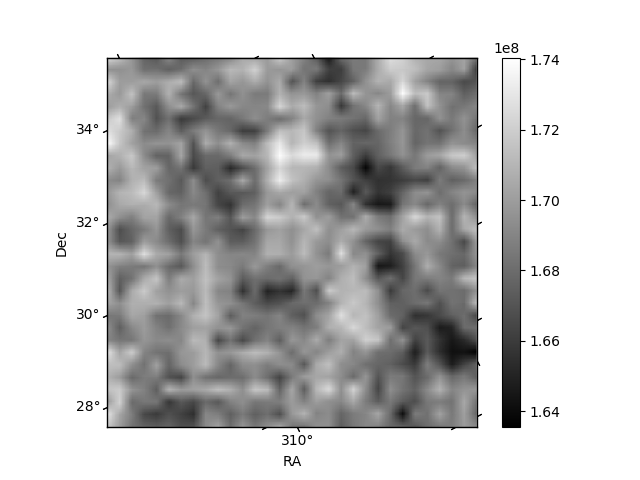
Quadrant B |
|---|---|---|---|
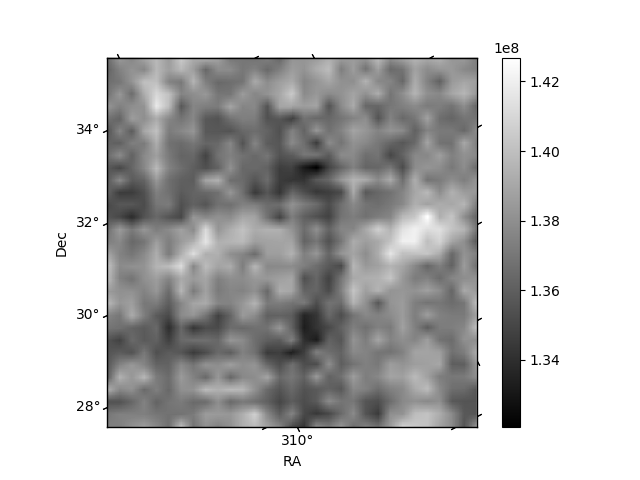
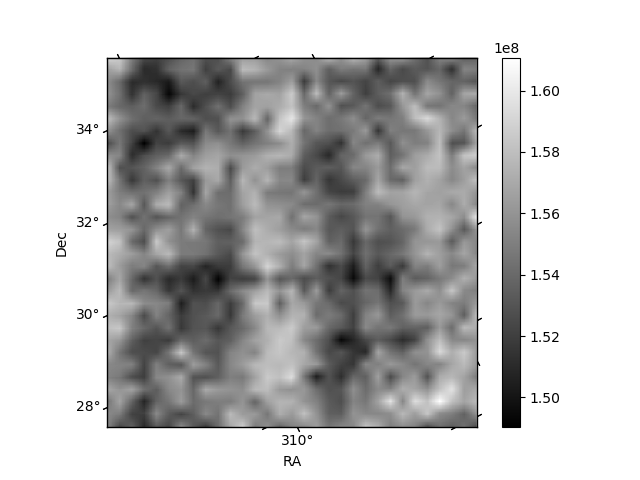
| Quadrant D | 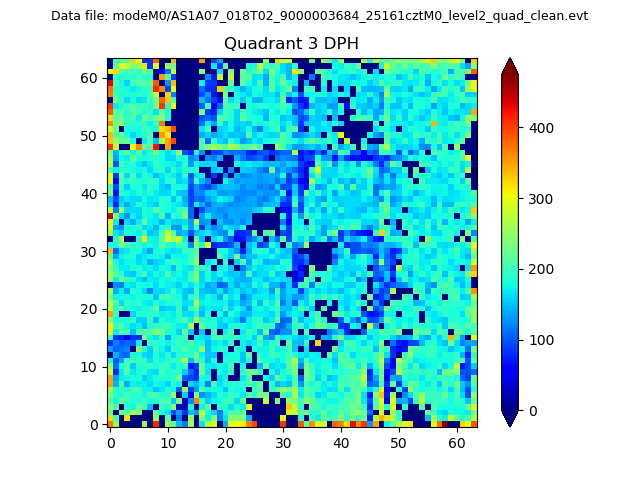 |
 |
Quadrant C |
| Plot type | Count rate plots | Images |
|---|---|---|
| Comparison with Poisson distribution Blue bars denote a histogram of data divided into 1 sec bins. Red curve is a Poisson curve with rate = median count rate of data. |
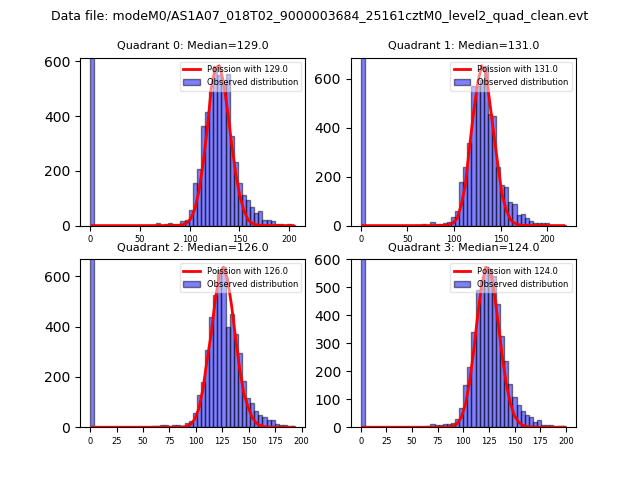 |
 |
| Quadrant-wise count rates Data is divided into 100 sec bins |
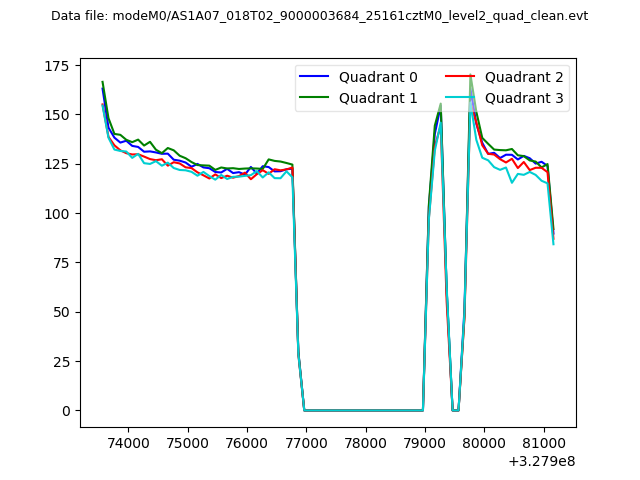 |
|
| Module-wise count rates for Quadrant A Data is divided into 100 sec bins |
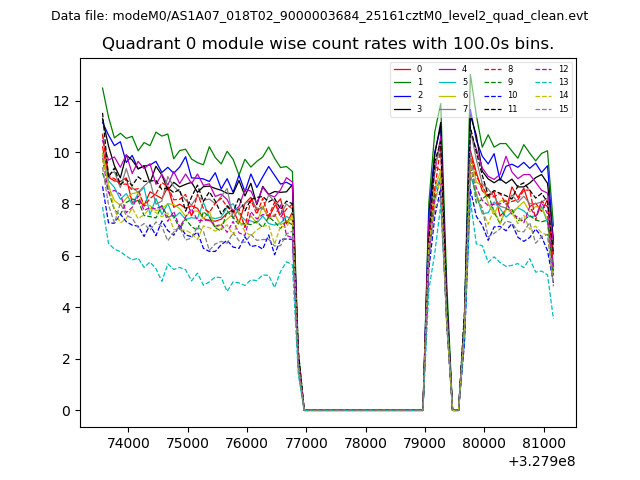 |
 |
| Module-wise count rates for Quadrant B Data is divided into 100 sec bins |
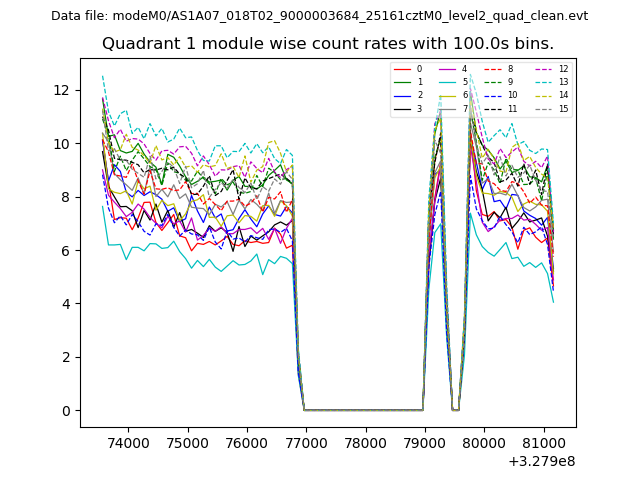 |
 |
| Module-wise count rates for Quadrant C Data is divided into 100 sec bins |
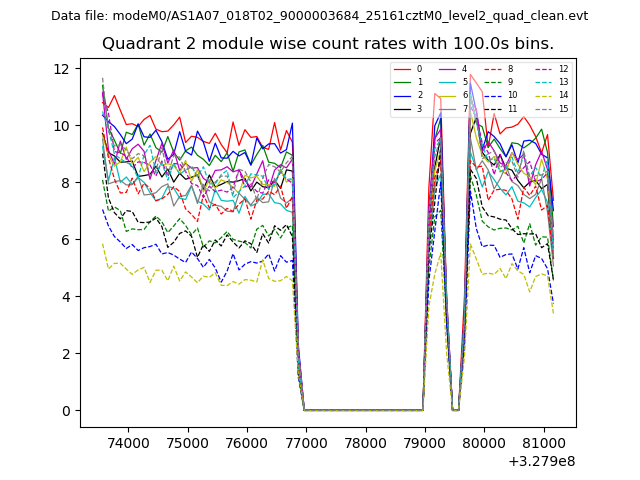 |
 |
| Module-wise count rates for Quadrant D Data is divided into 100 sec bins |
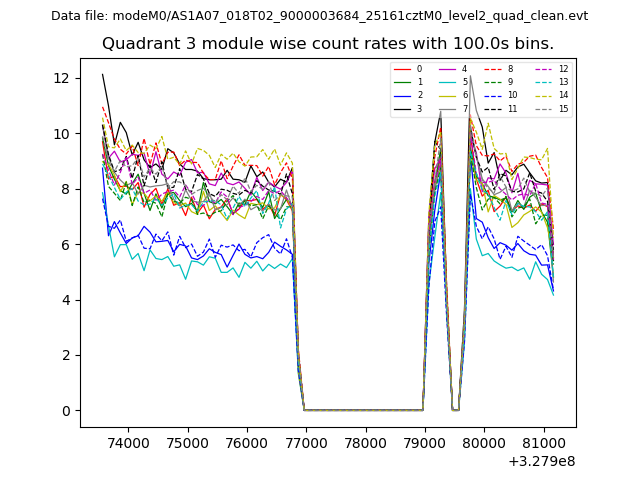 |
 |
| Parameter | Plot |
|---|---|
| CZT HV Monitor | 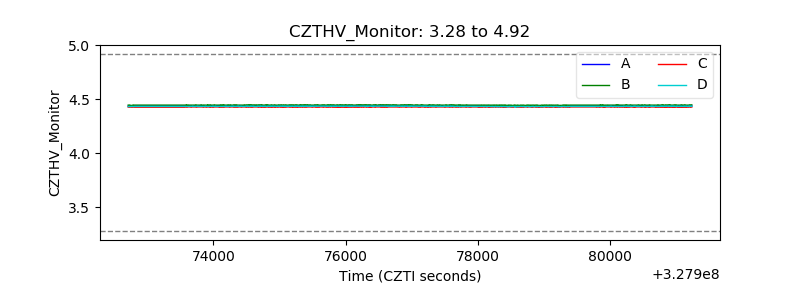 |
| D_VDD | 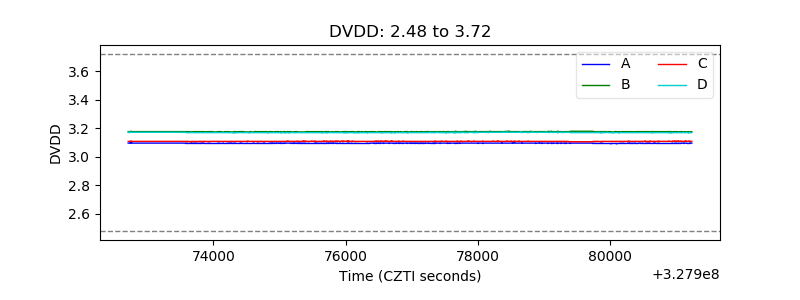 |
| Temperature 1 | 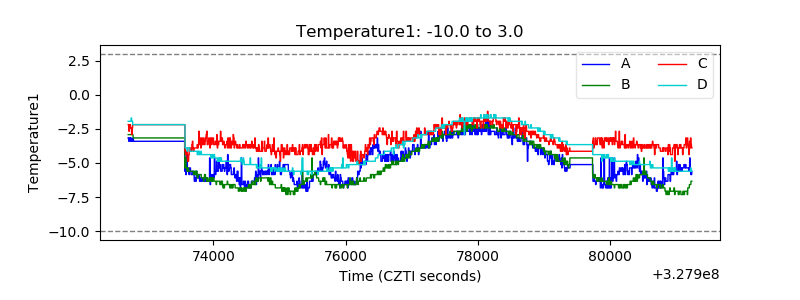 |
| Veto HV Monitor |  |
| Veto LLD | 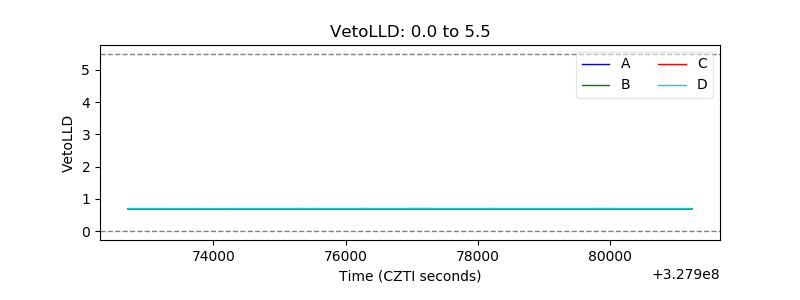 |
| Alpha Counter | 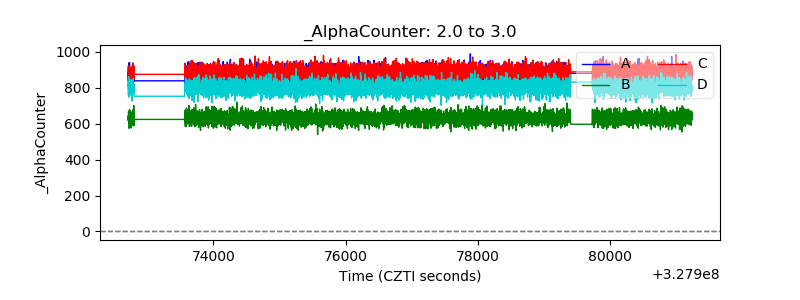 |
| _CPM_Rate | 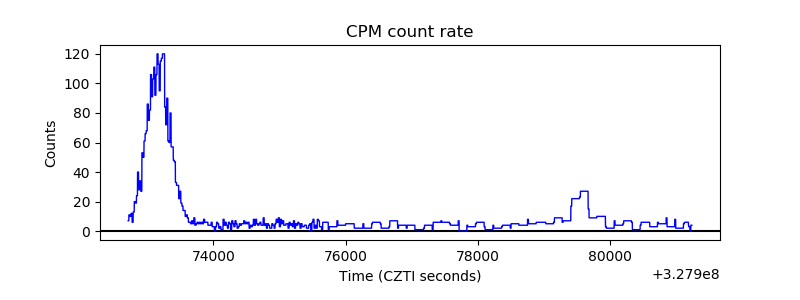 |
| CZT Counter |  |
| +2.5 Volts monitor |  |
| +5 Volts monitor |  |
| _ROLL_ROT | 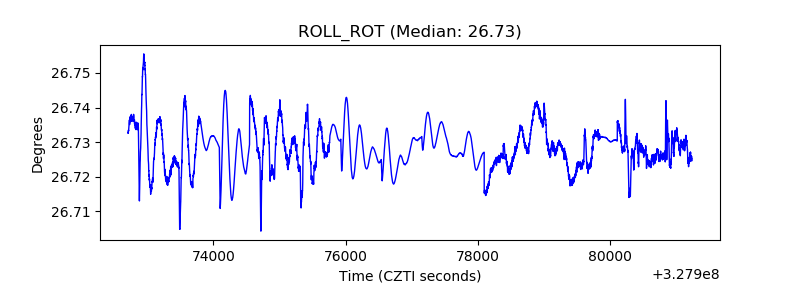 |
| _Roll_DEC | 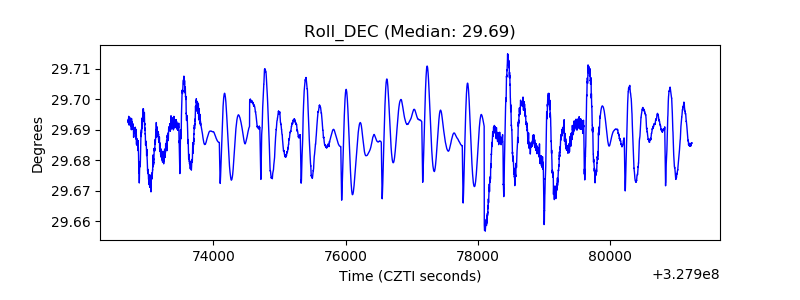 |
| _Roll_RA |  |
| Veto Counter | 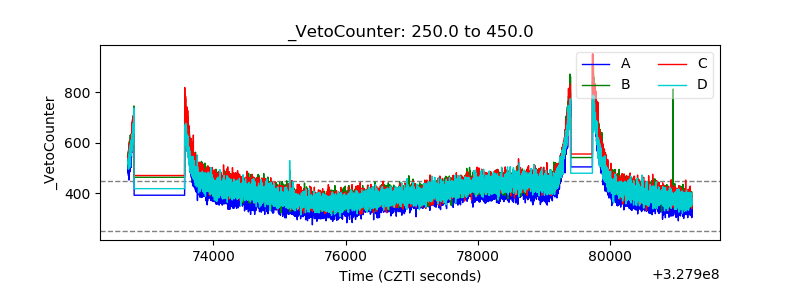 |