| Param | Original file | Final file |
|---|---|---|
| Filename | modeM0/AS1A07_018T02_9000003684_25163cztM0_level2.evt | modeM0/AS1A07_018T02_9000003684_25163cztM0_level2_quad_clean.evt |
| Size (bytes) | 536,472,000 | 110,862,720 |
| Size | 511.6 MB | 105.7 MB |
| Events in quadrant A | 3,670,422 | 712,896 |
| Events in quadrant B | 3,723,513 | 725,698 |
| Events in quadrant C | 3,838,401 | 695,682 |
| Events in quadrant D | 4,485,457 | 681,222 |
| Mode M9 | |||
|---|---|---|---|
| Quadrant | BADHDUFLAG | Total packets | Discarded packets |
| A | 0 | 8 | 0 |
| B | 0 | 8 | 0 |
| C | 0 | 8 | 0 |
| D | 0 | 8 | 0 |
| Mode M0 | |||
|---|---|---|---|
| Quadrant | BADHDUFLAG | Total packets | Discarded packets |
| A | 0 | 16112 | 0 |
| B | 0 | 16168 | 0 |
| C | 0 | 16518 | 0 |
| D | 0 | 18808 | 0 |
| Quadrant | Total seconds | Saturated seconds | Saturation percentage |
|---|---|---|---|
| A | 7796 | 75 | 0.962032% |
| B | 7796 | 114 | 1.462288% |
| C | 7796 | 131 | 1.680349% |
| D | 7796 | 220 | 2.821960% |
Noise dominated data is calculated using 1-second bins in cleaned event files. If a bin has >2000 counts, and if more than 50% of those come from <1% of pixels, then it is considered to be noise-dominated and hence unusable.
| Quadrant | # 1 sec bins | Bins with >0 counts | Bins with >2000 counts | High rate bins dominated by noise | Noise dominated (total time) | Noise dominated (detector-on time) | Marked lightcurve |
|---|---|---|---|---|---|---|---|
| A | 8571 | 7796 | 0 | 0 | 0.00% | 0.00% | 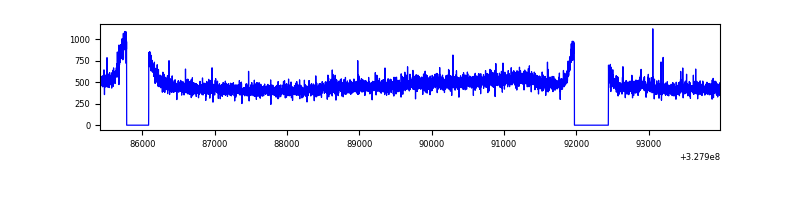 |
| B | 8571 | 7796 | 0 | 0 | 0.00% | 0.00% | 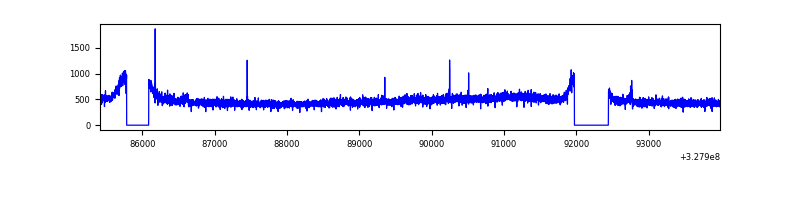 |
| C | 8571 | 7797 | 0 | 0 | 0.00% | 0.00% | 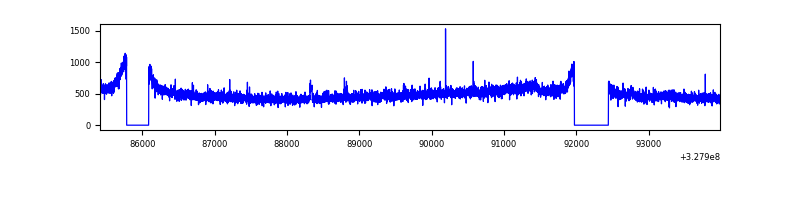 |
| D | 8571 | 7798 | 166 | 166 | 1.94% | 2.13% | 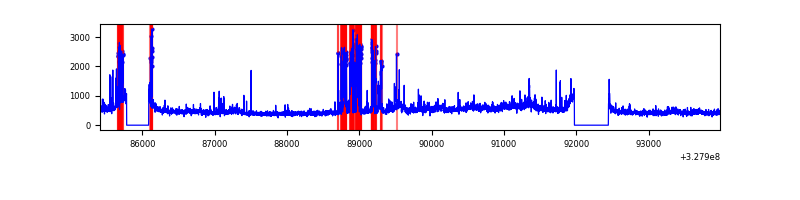 |
Top three noisy pixels from each quadrant. If the there are fewer than three noisy pixels in the level2.evt file, extra rows are filled as -1
| Pixel properties | Quadrant properties | ||||||
|---|---|---|---|---|---|---|---|
| Quadrant | DetID | PixID | Counts | Sigma | Mean | Median | Sigma |
| A | 13 | 254 | 11376 | 54.29 | 949 | 929 | 192.4 |
| A | 3 | 137 | 8997 | 41.93 | 949 | 929 | 192.4 |
| A | 5 | 203 | 8346 | 38.55 | 949 | 929 | 192.4 |
| B | 12 | 111 | 23146 | 121.14 | 945 | 919 | 183.5 |
| B | 11 | 111 | 20810 | 108.41 | 945 | 919 | 183.5 |
| B | 14 | 111 | 19046 | 98.8 | 945 | 919 | 183.5 |
| C | 14 | 238 | 143444 | 655.97 | 913 | 915 | 217.3 |
| C | 7 | 247 | 127244 | 581.41 | 913 | 915 | 217.3 |
| C | 13 | 61 | 6357 | 25.04 | 913 | 915 | 217.3 |
| D | 1 | 52 | 896811 | 3991.62 | 911 | 882 | 224.5 |
| D | 8 | 195 | 133485 | 590.78 | 911 | 882 | 224.5 |
| D | 2 | 234 | 34688 | 150.62 | 911 | 882 | 224.5 |
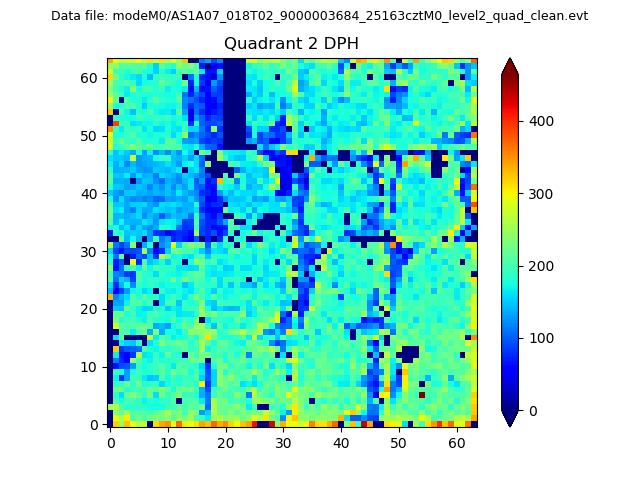
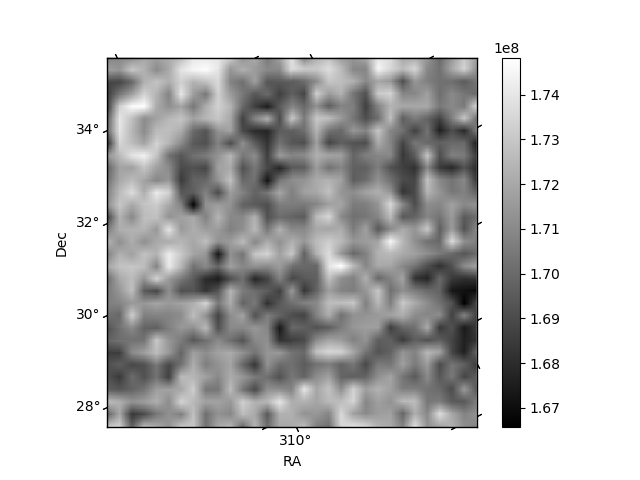
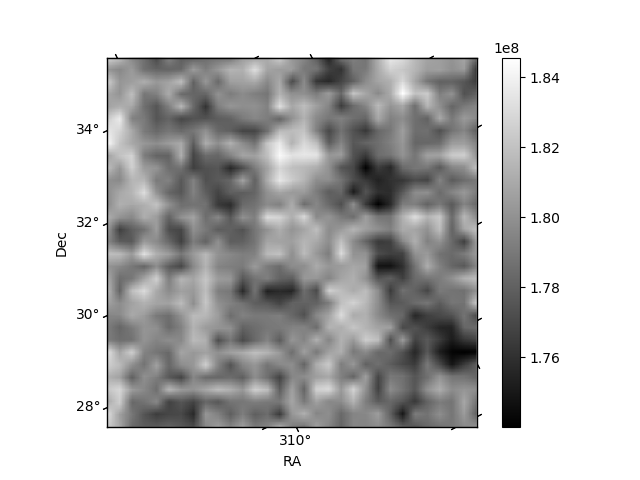
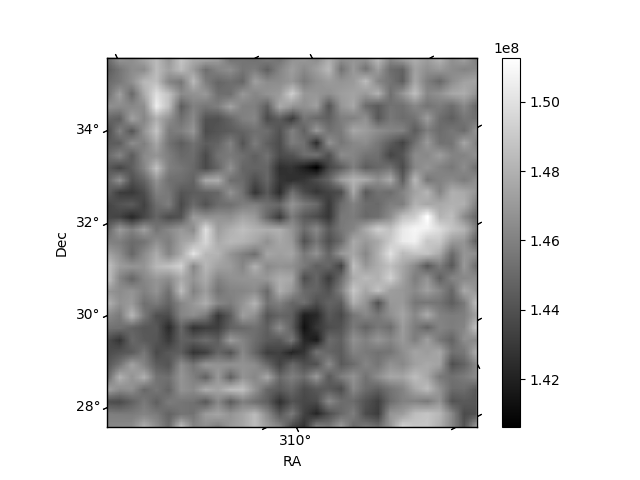
Histogram calculated using DETX and DETY for each event in the final _common_clean file
| Quadrant A | 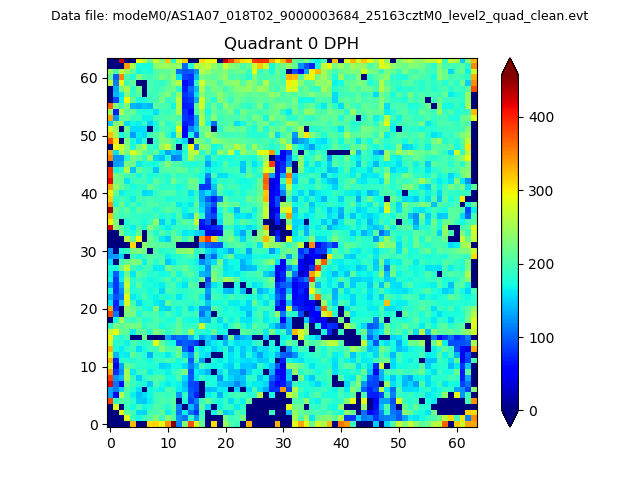 |
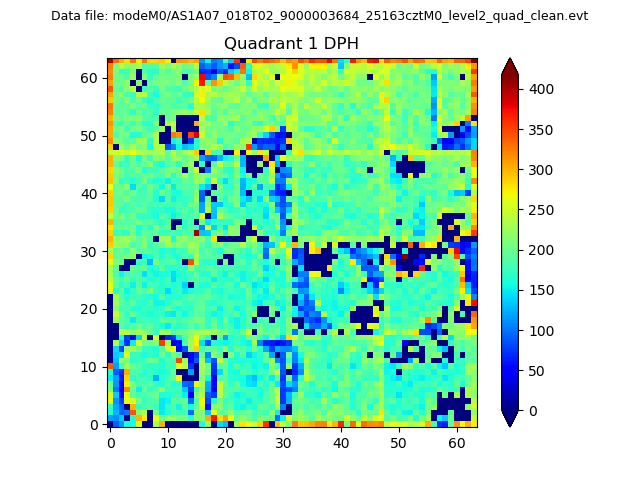 |
Quadrant B |
|---|---|---|---|
| Quadrant D | 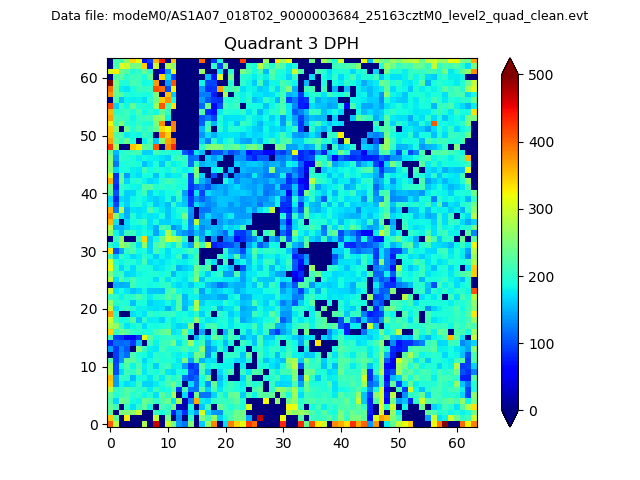 |
 |
Quadrant C |
| Plot type | Count rate plots | Images |
|---|---|---|
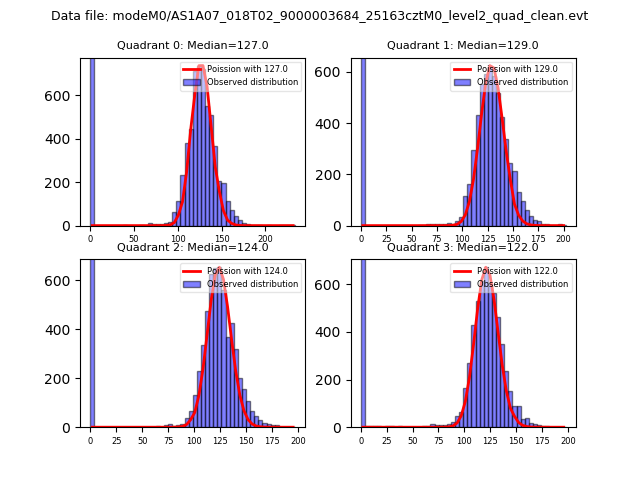
| Comparison with Poisson distribution Blue bars denote a histogram of data divided into 1 sec bins. Red curve is a Poisson curve with rate = median count rate of data. |
 |
 |
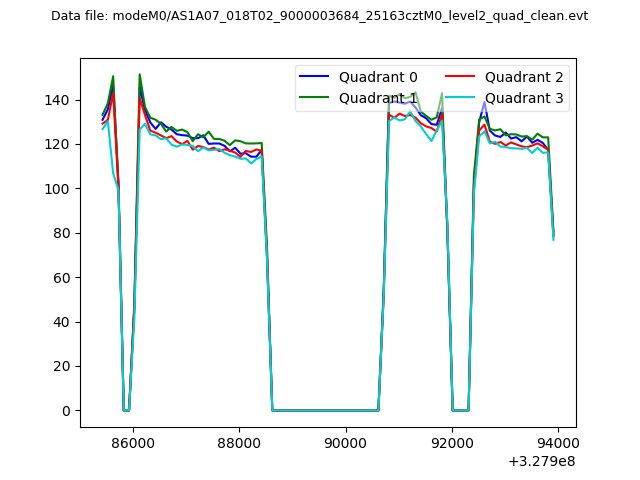
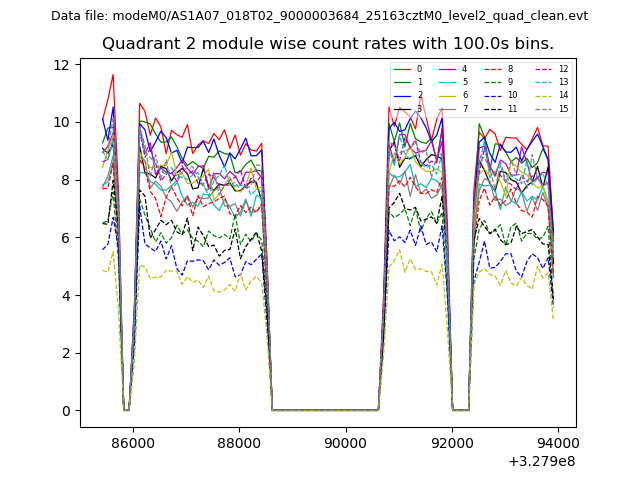
| Quadrant-wise count rates Data is divided into 100 sec bins |
 |
|
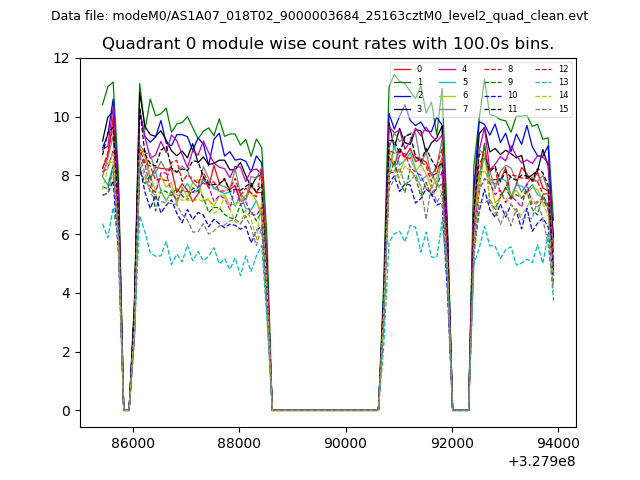
| Module-wise count rates for Quadrant A Data is divided into 100 sec bins |
 |
 |
| Module-wise count rates for Quadrant B Data is divided into 100 sec bins |
 |
 |
| Module-wise count rates for Quadrant C Data is divided into 100 sec bins |
 |
 |
| Module-wise count rates for Quadrant D Data is divided into 100 sec bins |
 |
 |
| Parameter | Plot |
|---|---|
| CZT HV Monitor | 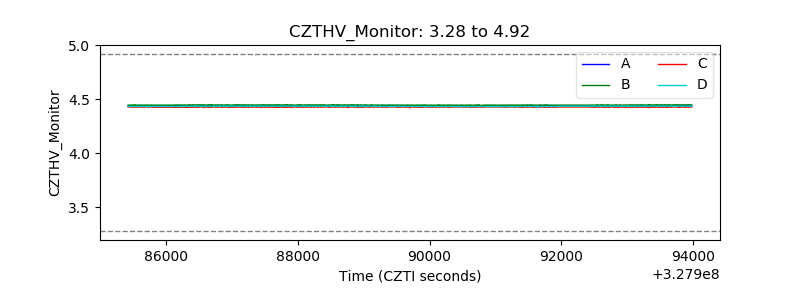 |
| D_VDD | 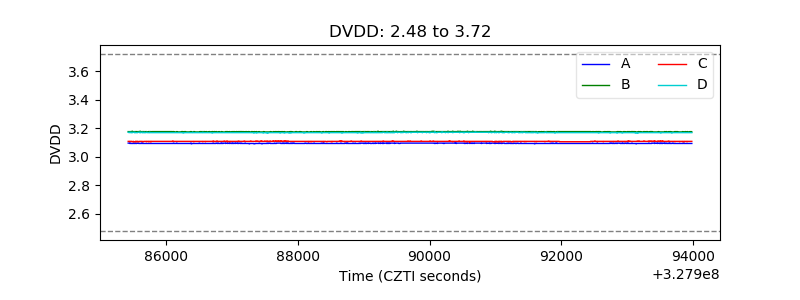 |
| Temperature 1 | 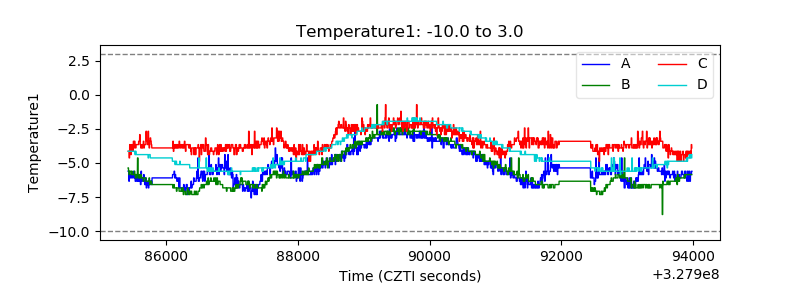 |
| Veto HV Monitor | 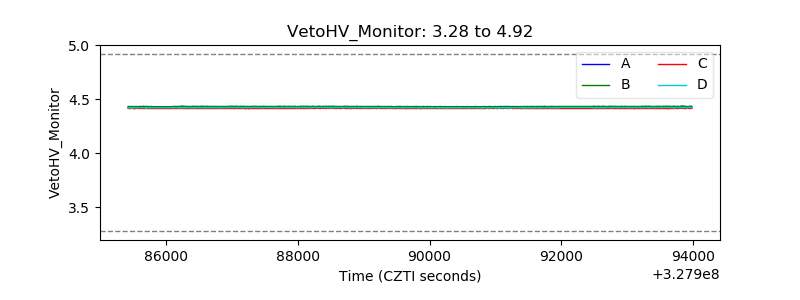 |
| Veto LLD | 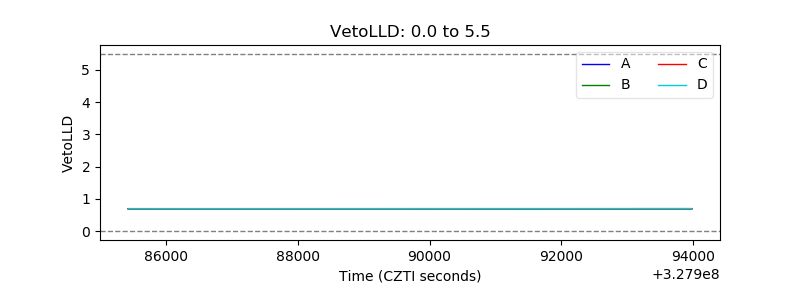 |
| Alpha Counter | 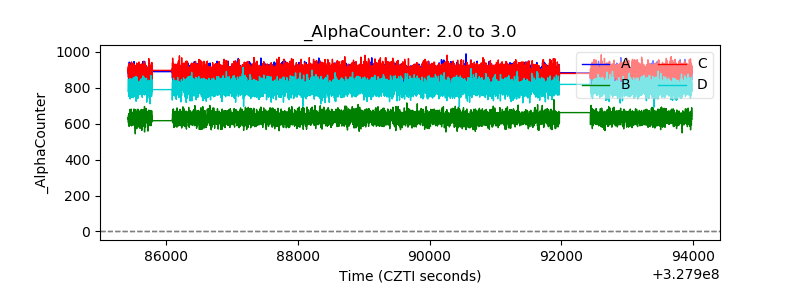 |
| _CPM_Rate | 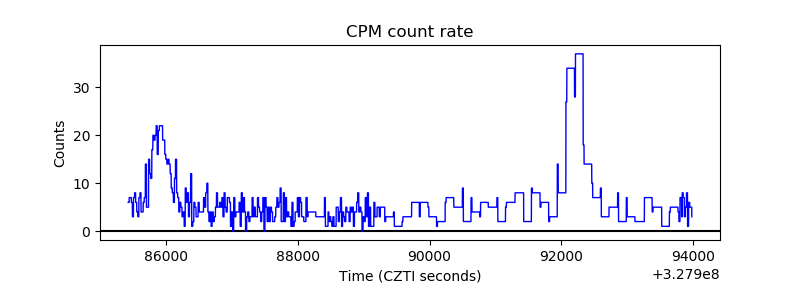 |
| CZT Counter | 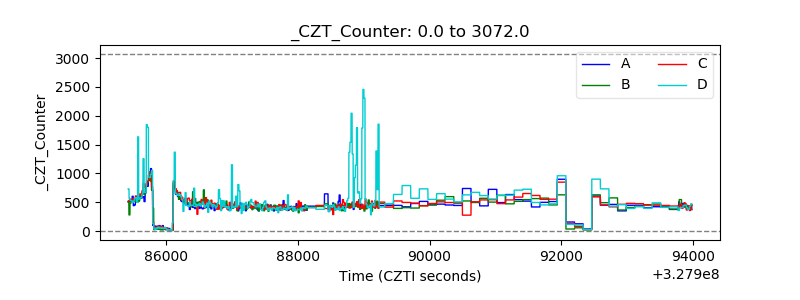 |
| +2.5 Volts monitor | 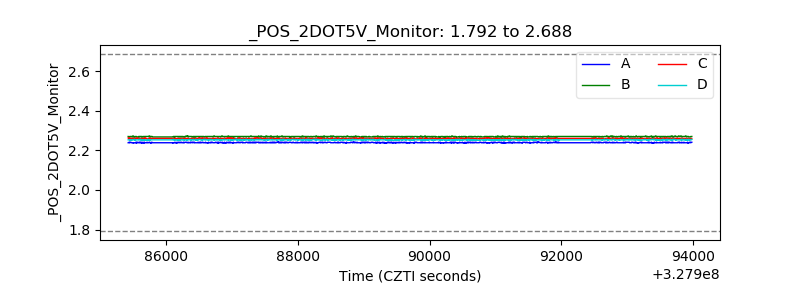 |
| +5 Volts monitor |  |
| _ROLL_ROT | 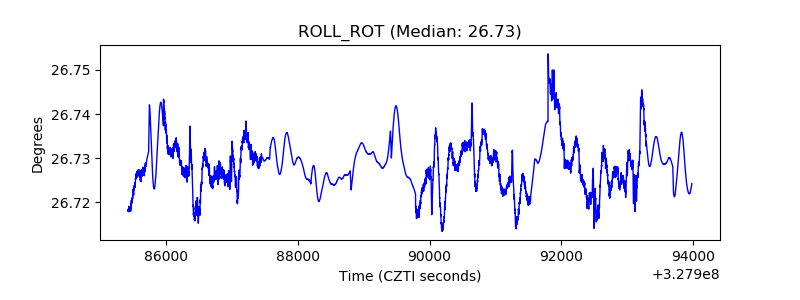 |
| _Roll_DEC | 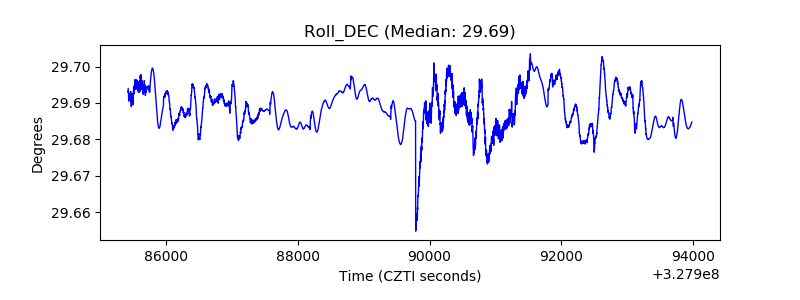 |
| _Roll_RA | 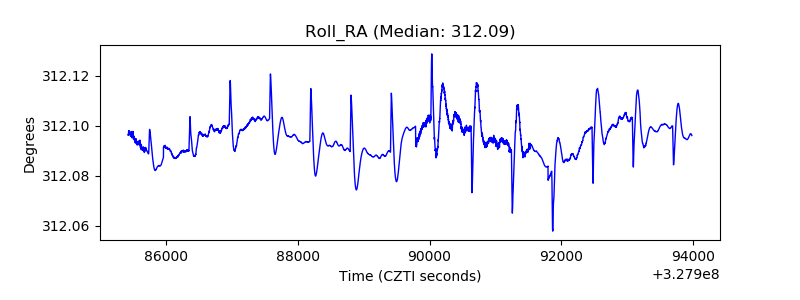 |
| Veto Counter | 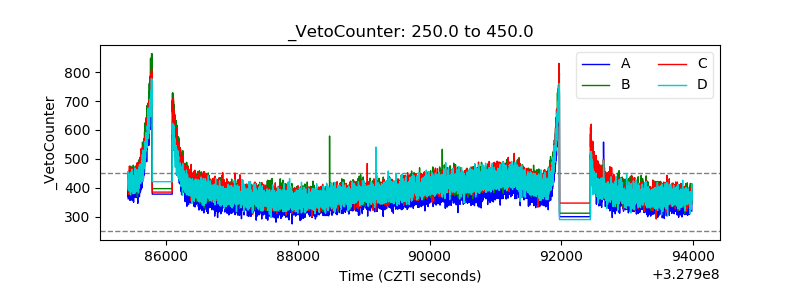 |