| Param | Original file | Final file |
|---|---|---|
| Filename | modeM0/AS1A07_018T02_9000003684_25167cztM0_level2.evt | modeM0/AS1A07_018T02_9000003684_25167cztM0_level2_quad_clean.evt |
| Size (bytes) | 857,799,360 | 127,186,560 |
| Size | 818.1 MB | 121.3 MB |
| Events in quadrant A | 5,549,509 | 781,510 |
| Events in quadrant B | 5,635,535 | 791,956 |
| Events in quadrant C | 6,364,391 | 755,223 |
| Events in quadrant D | 7,656,661 | 733,170 |
| Mode M9 | |||
|---|---|---|---|
| Quadrant | BADHDUFLAG | Total packets | Discarded packets |
| A | 0 | 20 | 0 |
| B | 0 | 20 | 0 |
| C | 0 | 20 | 0 |
| D | 0 | 20 | 0 |
| Mode M0 | |||
|---|---|---|---|
| Quadrant | BADHDUFLAG | Total packets | Discarded packets |
| A | 0 | 23587 | 0 |
| B | 0 | 23730 | 0 |
| C | 0 | 25807 | 0 |
| D | 0 | 30406 | 0 |
| Quadrant | Total seconds | Saturated seconds | Saturation percentage |
|---|---|---|---|
| A | 11417 | 82 | 0.718227% |
| B | 11417 | 91 | 0.797057% |
| C | 11417 | 297 | 2.601384% |
| D | 11416 | 468 | 4.099509% |
Noise dominated data is calculated using 1-second bins in cleaned event files. If a bin has >2000 counts, and if more than 50% of those come from <1% of pixels, then it is considered to be noise-dominated and hence unusable.
| Quadrant | # 1 sec bins | Bins with >0 counts | Bins with >2000 counts | High rate bins dominated by noise | Noise dominated (total time) | Noise dominated (detector-on time) | Marked lightcurve |
|---|---|---|---|---|---|---|---|
| A | 13377 | 11417 | 0 | 0 | 0.00% | 0.00% | 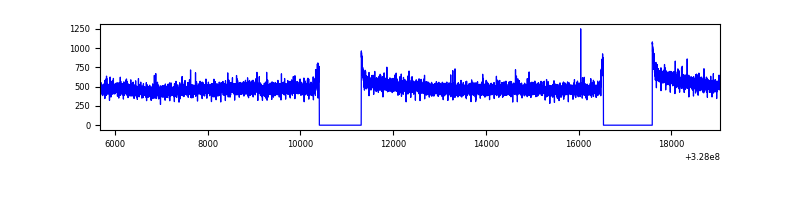 |
| B | 13377 | 11417 | 2 | 2 | 0.01% | 0.02% | 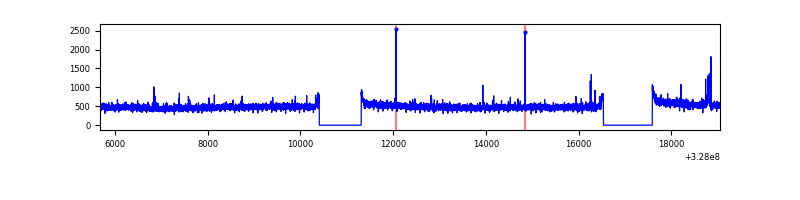 |
| C | 13377 | 11417 | 134 | 134 | 1.00% | 1.17% | 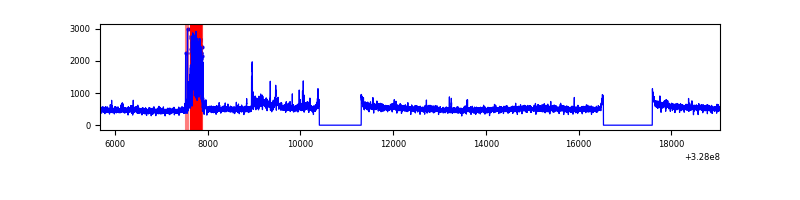 |
| D | 13376 | 11416 | 387 | 387 | 2.89% | 3.39% | 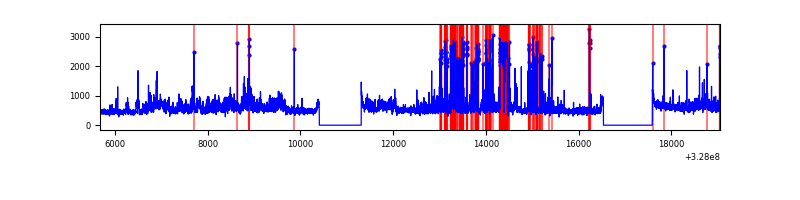 |
Top three noisy pixels from each quadrant. If the there are fewer than three noisy pixels in the level2.evt file, extra rows are filled as -1
| Pixel properties | Quadrant properties | ||||||
|---|---|---|---|---|---|---|---|
| Quadrant | DetID | PixID | Counts | Sigma | Mean | Median | Sigma |
| A | 13 | 254 | 17994 | 57.7 | 1439 | 1407 | 287.5 |
| A | 3 | 137 | 13359 | 41.58 | 1439 | 1407 | 287.5 |
| A | 0 | 226 | 12419 | 38.31 | 1439 | 1407 | 287.5 |
| B | 0 | 190 | 37648 | 133.54 | 1422 | 1383 | 271.6 |
| B | 12 | 111 | 33658 | 118.85 | 1422 | 1383 | 271.6 |
| B | 11 | 111 | 30241 | 106.26 | 1422 | 1383 | 271.6 |
| C | 7 | 87 | 688576 | 2167.93 | 1363 | 1373 | 317.0 |
| C | 14 | 238 | 219968 | 689.6 | 1363 | 1373 | 317.0 |
| C | 7 | 247 | 113485 | 353.68 | 1363 | 1373 | 317.0 |
| D | 1 | 52 | 1584012 | 4739.64 | 1375 | 1332 | 333.9 |
| D | 12 | 235 | 486163 | 1451.92 | 1375 | 1332 | 333.9 |
| D | 8 | 195 | 270882 | 807.22 | 1375 | 1332 | 333.9 |
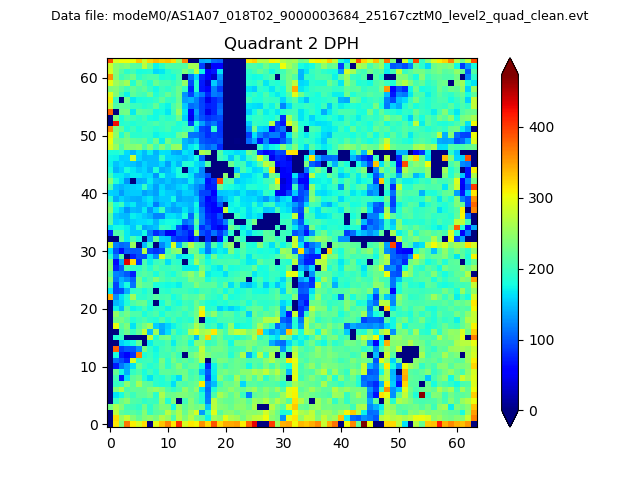
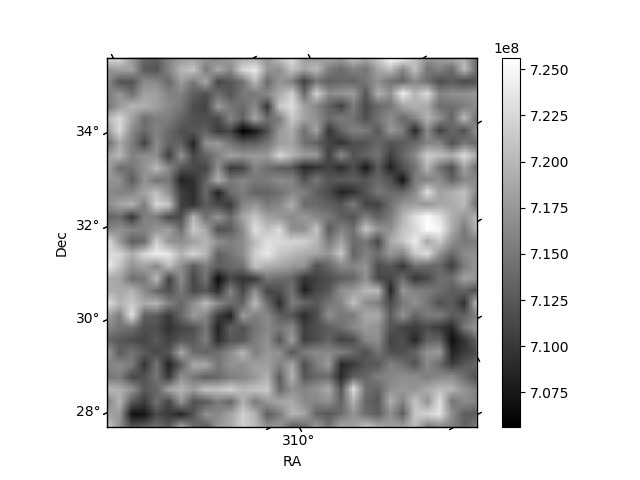
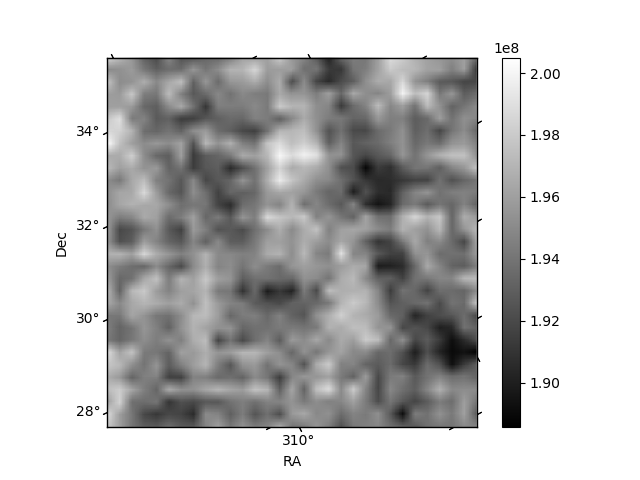
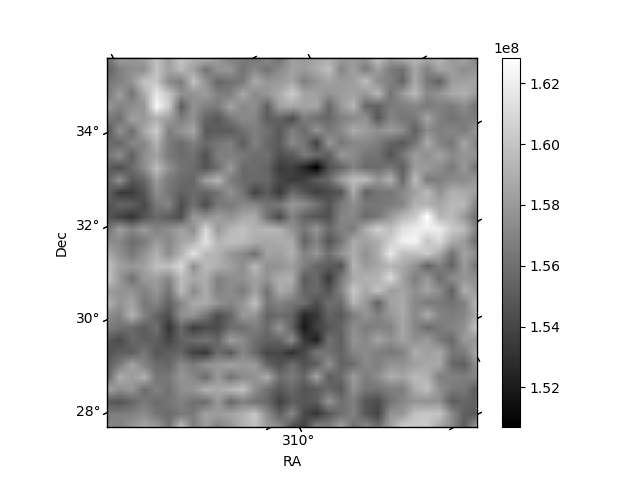
Histogram calculated using DETX and DETY for each event in the final _common_clean file
| Quadrant A | 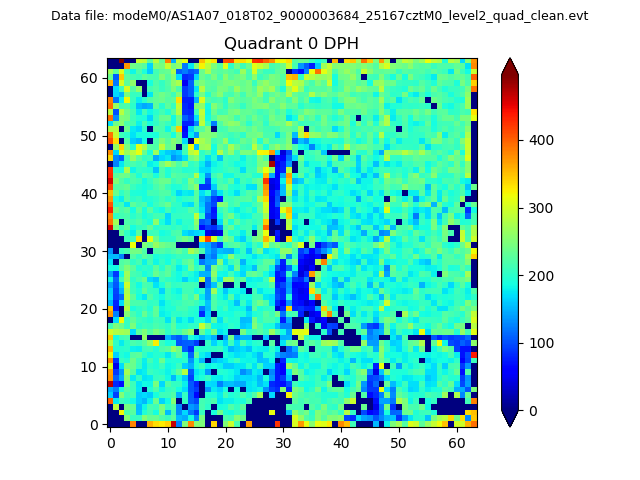 |
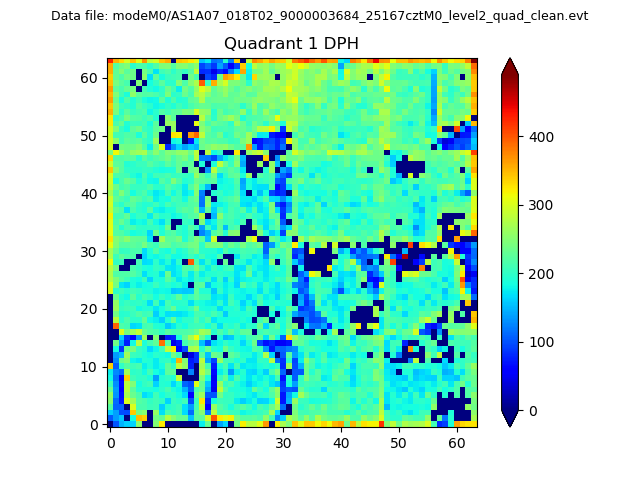 |
Quadrant B |
|---|---|---|---|
| Quadrant D | 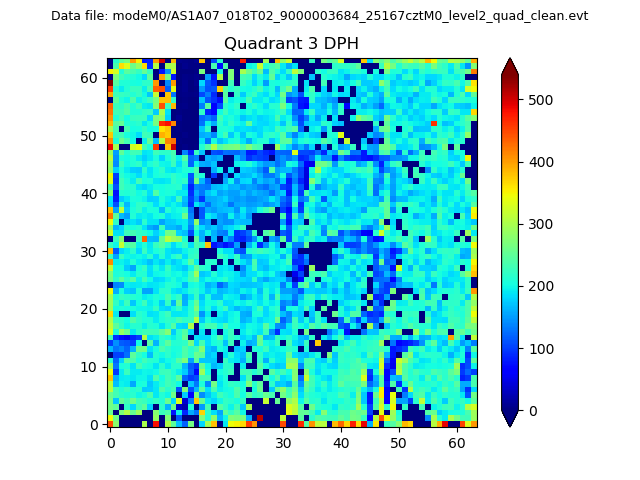 |
 |
Quadrant C |
| Plot type | Count rate plots | Images |
|---|---|---|
| Comparison with Poisson distribution Blue bars denote a histogram of data divided into 1 sec bins. Red curve is a Poisson curve with rate = median count rate of data. |
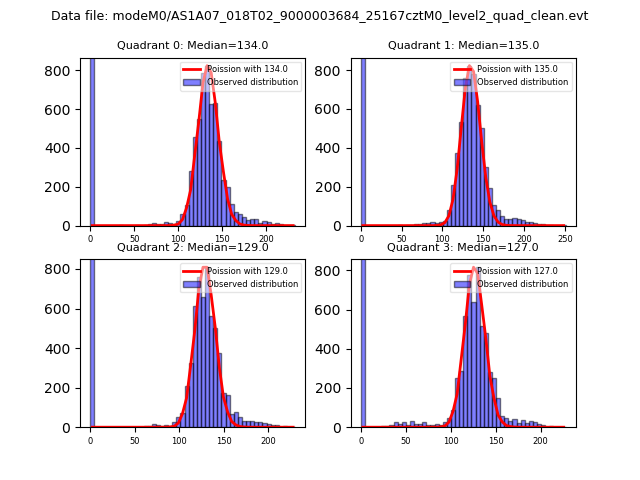 |
 |
| Quadrant-wise count rates Data is divided into 100 sec bins |
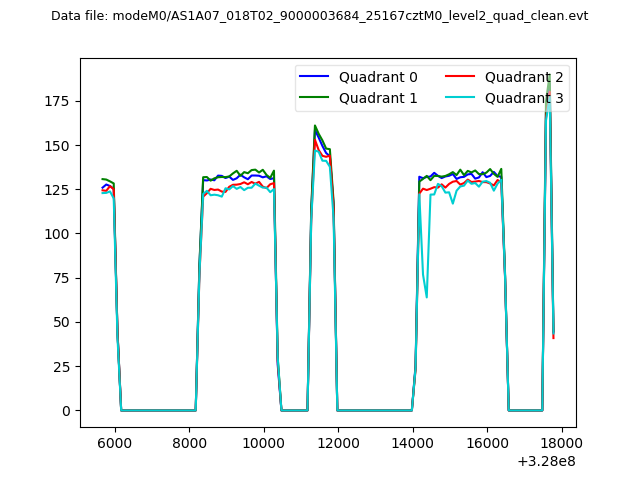 |
|
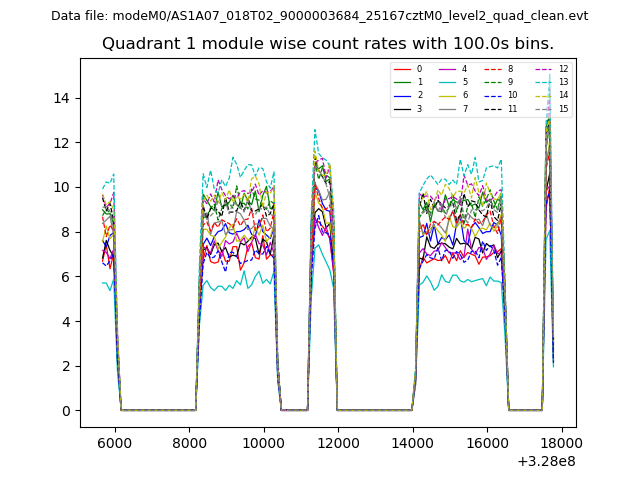
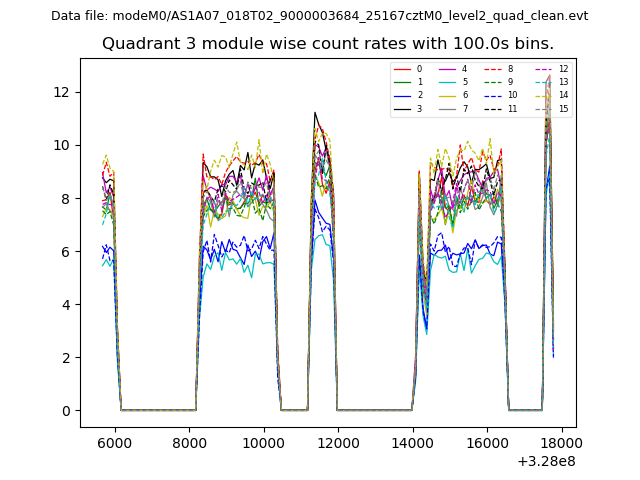
| Module-wise count rates for Quadrant A Data is divided into 100 sec bins |
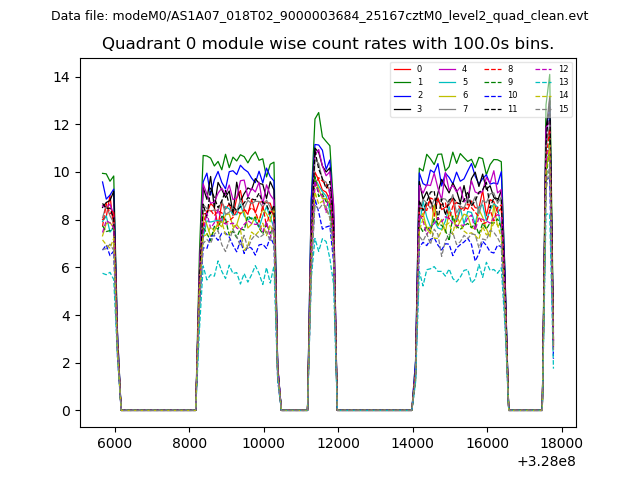 |
 |
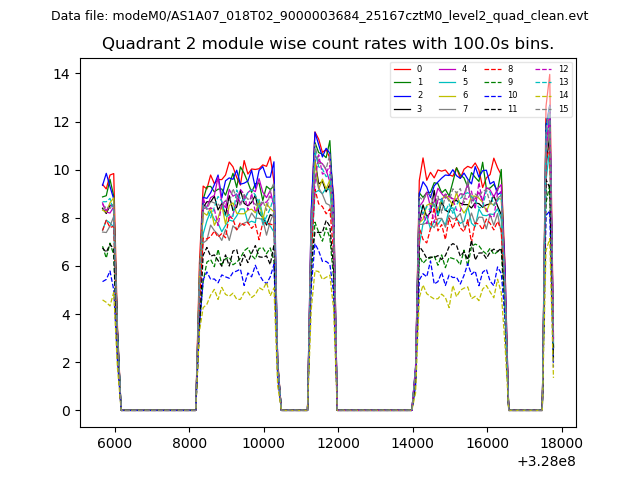
| Module-wise count rates for Quadrant B Data is divided into 100 sec bins |
 |
 |
| Module-wise count rates for Quadrant C Data is divided into 100 sec bins |
 |
 |
| Module-wise count rates for Quadrant D Data is divided into 100 sec bins |
 |
 |
| Parameter | Plot |
|---|---|
| CZT HV Monitor | 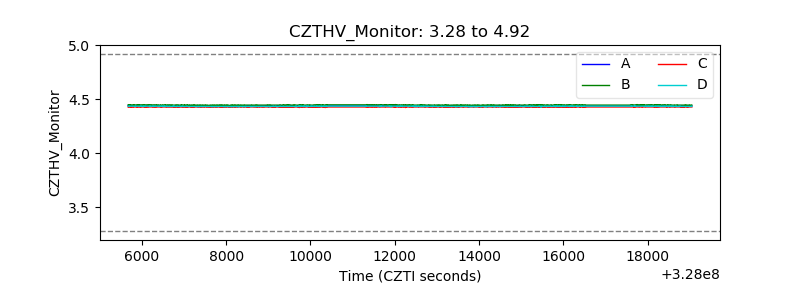 |
| D_VDD |  |
| Temperature 1 |  |
| Veto HV Monitor | 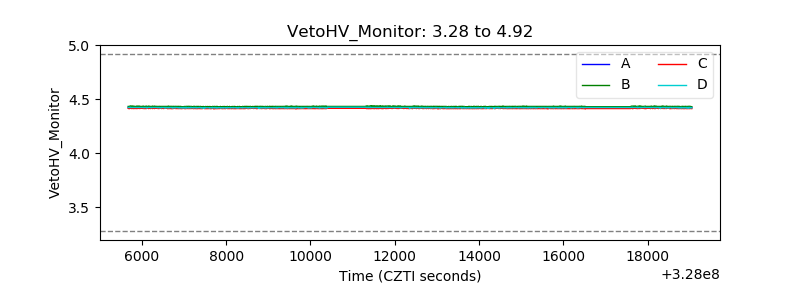 |
| Veto LLD | 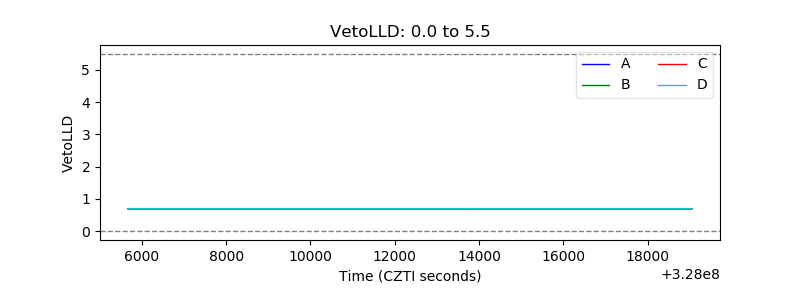 |
| Alpha Counter | 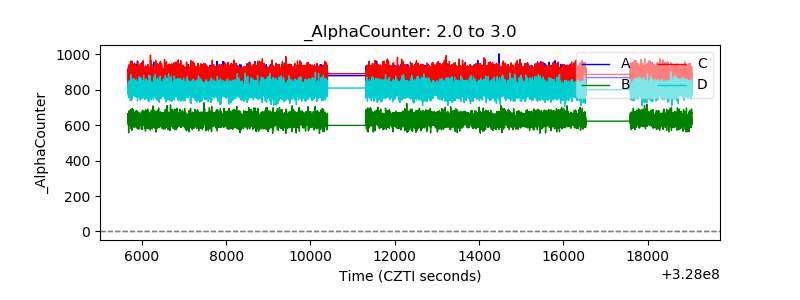 |
| _CPM_Rate | 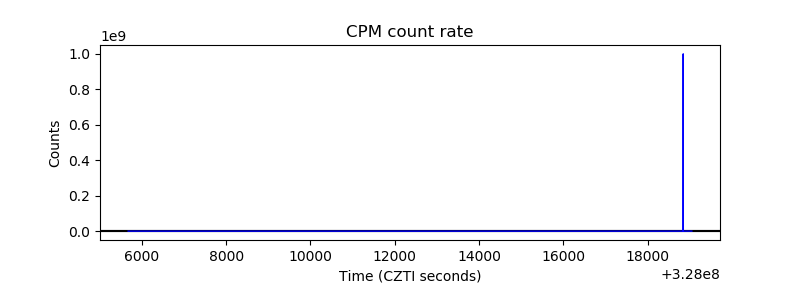 |
| CZT Counter | 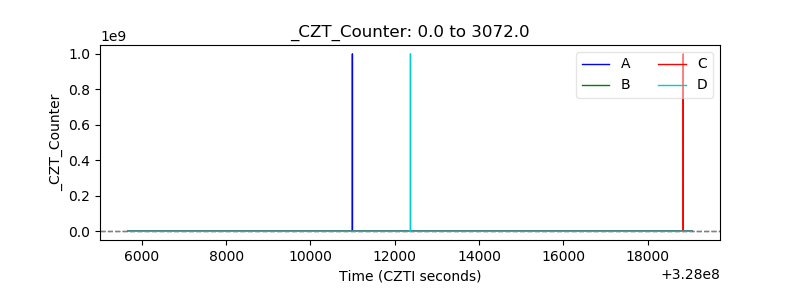 |
| +2.5 Volts monitor |  |
| +5 Volts monitor |  |
| _ROLL_ROT | 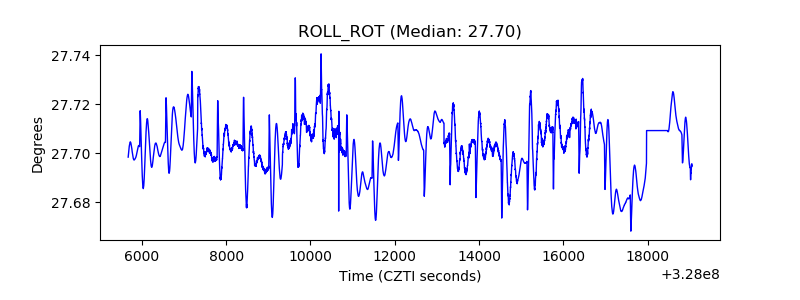 |
| _Roll_DEC | 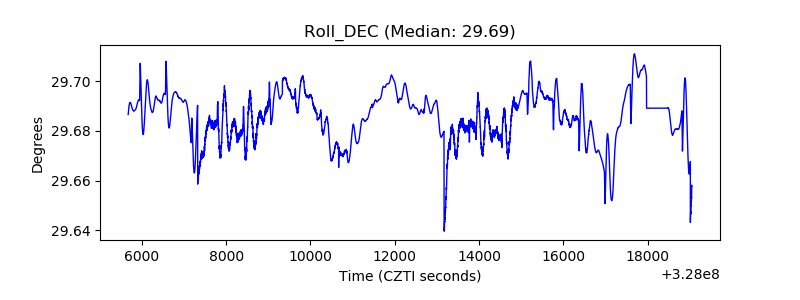 |
| _Roll_RA | 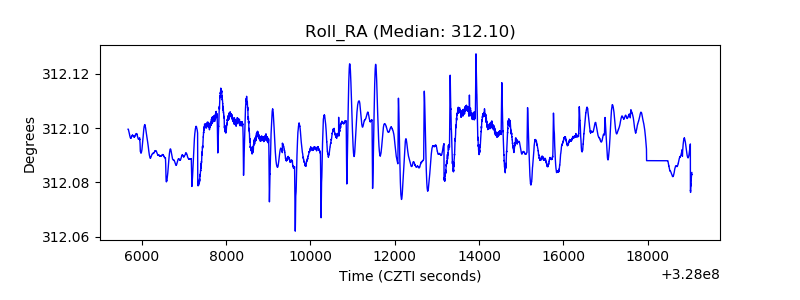 |
| Veto Counter | 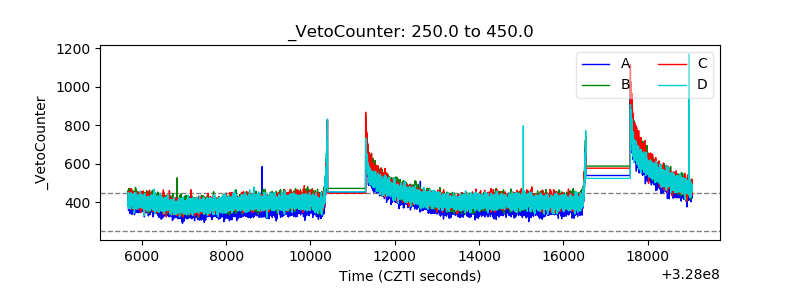 |