| Param | Original file | Final file |
|---|---|---|
| Filename | modeM0/AS1A07_018T02_9000003684_25169cztM0_level2.evt | modeM0/AS1A07_018T02_9000003684_25169cztM0_level2_quad_clean.evt |
| Size (bytes) | 514,152,000 | 66,954,240 |
| Size | 490.3 MB | 63.9 MB |
| Events in quadrant A | 3,410,866 | 402,347 |
| Events in quadrant B | 3,467,968 | 406,279 |
| Events in quadrant C | 3,474,987 | 387,431 |
| Events in quadrant D | 4,779,945 | 381,184 |
| Mode M9 | |||
|---|---|---|---|
| Quadrant | BADHDUFLAG | Total packets | Discarded packets |
| A | 0 | 12 | 0 |
| B | 0 | 12 | 0 |
| C | 0 | 12 | 0 |
| D | 0 | 12 | 0 |
| Mode M0 | |||
|---|---|---|---|
| Quadrant | BADHDUFLAG | Total packets | Discarded packets |
| A | 0 | 14227 | 0 |
| B | 0 | 14393 | 0 |
| C | 0 | 14215 | 0 |
| D | 0 | 18657 | 0 |
| Quadrant | Total seconds | Saturated seconds | Saturation percentage |
|---|---|---|---|
| A | 6451 | 67 | 1.038599% |
| B | 6452 | 71 | 1.100434% |
| C | 6452 | 95 | 1.472412% |
| D | 6452 | 322 | 4.990701% |
Noise dominated data is calculated using 1-second bins in cleaned event files. If a bin has >2000 counts, and if more than 50% of those come from <1% of pixels, then it is considered to be noise-dominated and hence unusable.
| Quadrant | # 1 sec bins | Bins with >0 counts | Bins with >2000 counts | High rate bins dominated by noise | Noise dominated (total time) | Noise dominated (detector-on time) | Marked lightcurve |
|---|---|---|---|---|---|---|---|
| A | 7626 | 6451 | 0 | 0 | 0.00% | 0.00% |  |
| B | 7627 | 6452 | 0 | 0 | 0.00% | 0.00% |  |
| C | 7627 | 6452 | 0 | 0 | 0.00% | 0.00% |  |
| D | 7627 | 6452 | 286 | 286 | 3.75% | 4.43% |  |
Top three noisy pixels from each quadrant. If the there are fewer than three noisy pixels in the level2.evt file, extra rows are filled as -1
| Pixel properties | Quadrant properties | ||||||
|---|---|---|---|---|---|---|---|
| Quadrant | DetID | PixID | Counts | Sigma | Mean | Median | Sigma |
| A | 13 | 254 | 10322 | 53.61 | 885 | 868 | 176.3 |
| A | 3 | 137 | 7823 | 39.44 | 885 | 868 | 176.3 |
| A | 0 | 226 | 7614 | 38.25 | 885 | 868 | 176.3 |
| B | 0 | 190 | 49460 | 296.11 | 870 | 850 | 164.2 |
| B | 12 | 111 | 19393 | 112.96 | 870 | 850 | 164.2 |
| B | 11 | 111 | 17737 | 102.87 | 870 | 850 | 164.2 |
| C | 14 | 238 | 136555 | 699.61 | 840 | 846 | 194.0 |
| C | 7 | 87 | 29194 | 146.14 | 840 | 846 | 194.0 |
| C | 7 | 247 | 20279 | 100.18 | 840 | 846 | 194.0 |
| D | 1 | 52 | 1098750 | 5397.98 | 849 | 827 | 203.4 |
| D | 12 | 235 | 201586 | 987.04 | 849 | 827 | 203.4 |
| D | 8 | 195 | 160325 | 784.18 | 849 | 827 | 203.4 |
Histogram calculated using DETX and DETY for each event in the final _common_clean file
| Quadrant A |  |
 |
Quadrant B |
|---|---|---|---|
| Quadrant D |  |
 |
Quadrant C |
| Plot type | Count rate plots | Images |
|---|---|---|
| Comparison with Poisson distribution Blue bars denote a histogram of data divided into 1 sec bins. Red curve is a Poisson curve with rate = median count rate of data. |
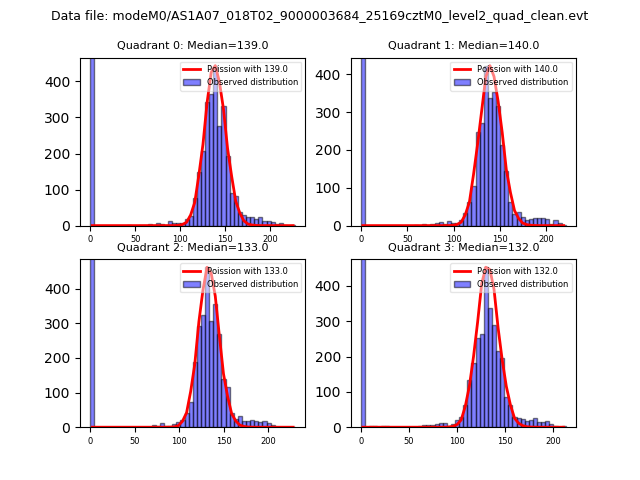 |
 |
| Quadrant-wise count rates Data is divided into 100 sec bins |
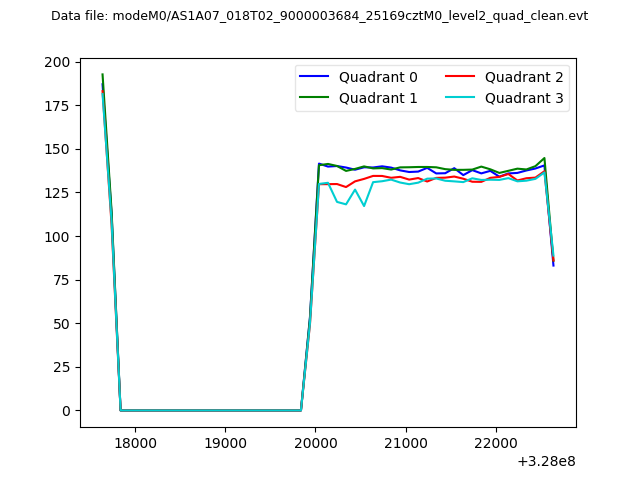 |
|
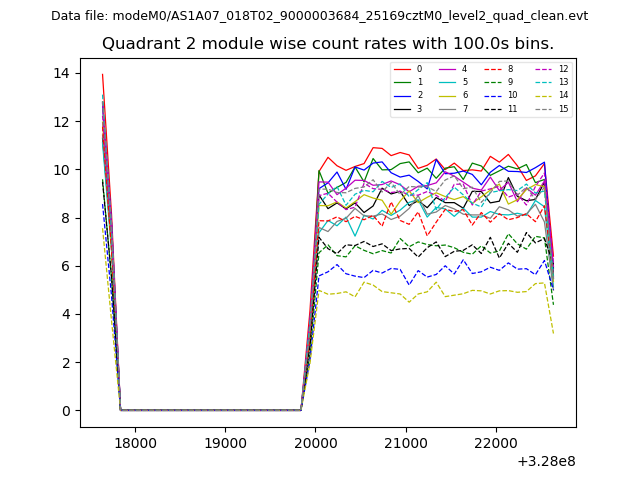
| Module-wise count rates for Quadrant A Data is divided into 100 sec bins |
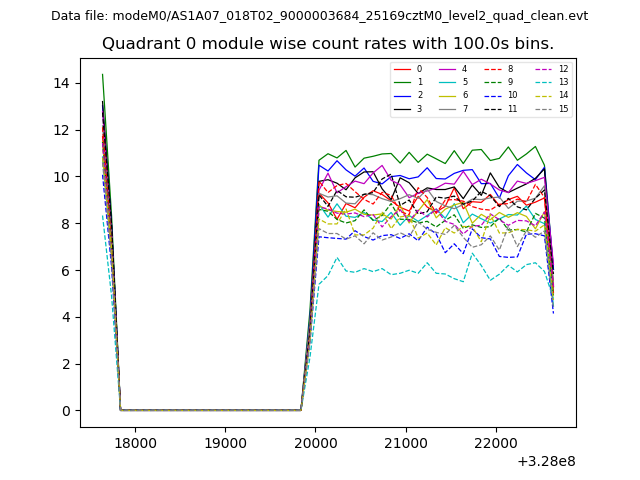 |
 |
| Module-wise count rates for Quadrant B Data is divided into 100 sec bins |
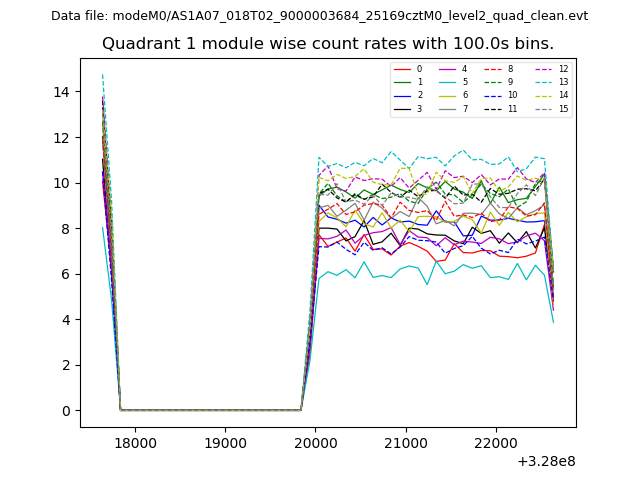 |
 |
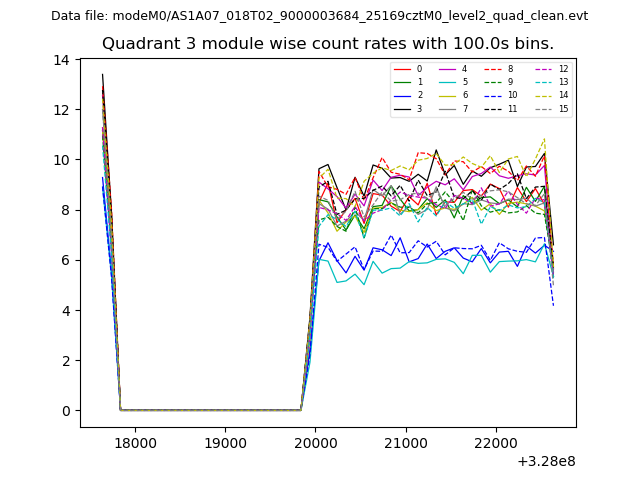
| Module-wise count rates for Quadrant C Data is divided into 100 sec bins |
 |
 |
| Module-wise count rates for Quadrant D Data is divided into 100 sec bins |
 |
 |
| Parameter | Plot |
|---|---|
| CZT HV Monitor | 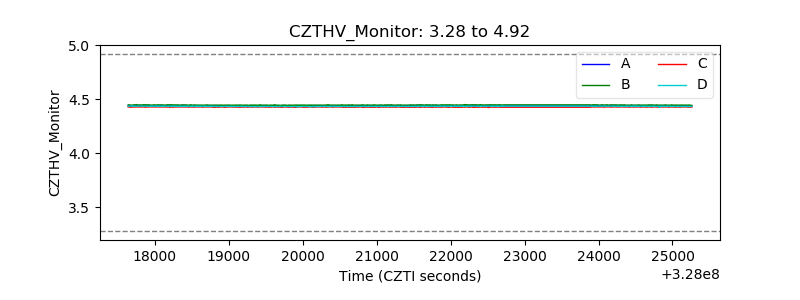 |
| D_VDD |  |
| Temperature 1 |  |
| Veto HV Monitor |  |
| Veto LLD |  |
| Alpha Counter | 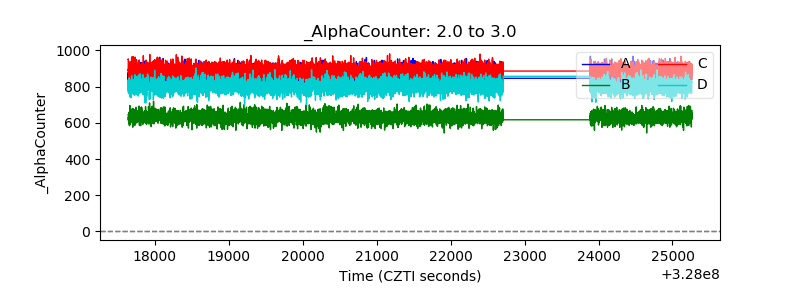 |
| _CPM_Rate | 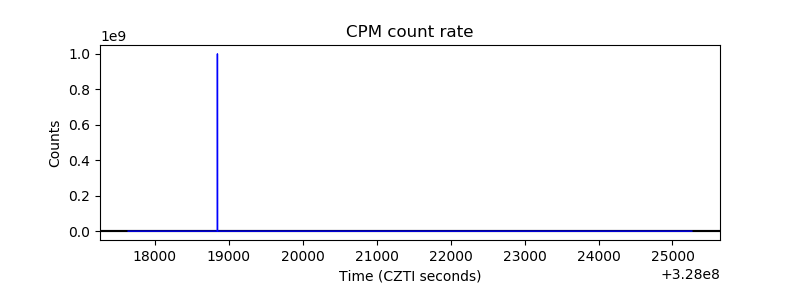 |
| CZT Counter |  |
| +2.5 Volts monitor |  |
| +5 Volts monitor |  |
| _ROLL_ROT | 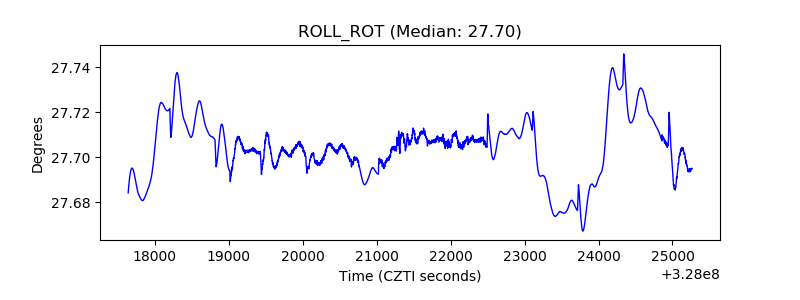 |
| _Roll_DEC | 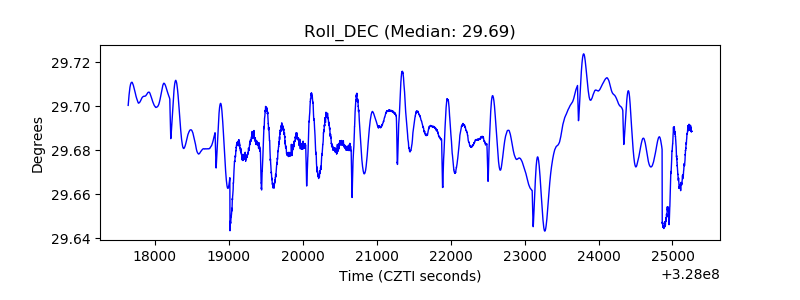 |
| _Roll_RA |  |
| Veto Counter | 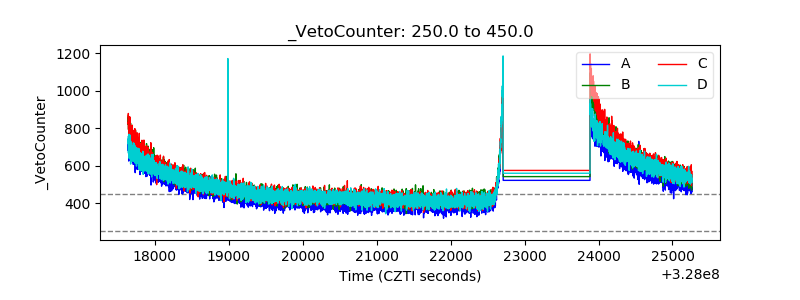 |